Gene: TNNI3
chr19: 55663136-55667849Expression Profile
(log scale)
Graphical Connections
Distribution of linked clusters:
You may find it interesting if many of the connected DHS sites belong to the same cluster.| Cluster Profile | Cluster ID | Number of DHS sites in this cluster |
|---|---|---|
 | 615 | 3 |
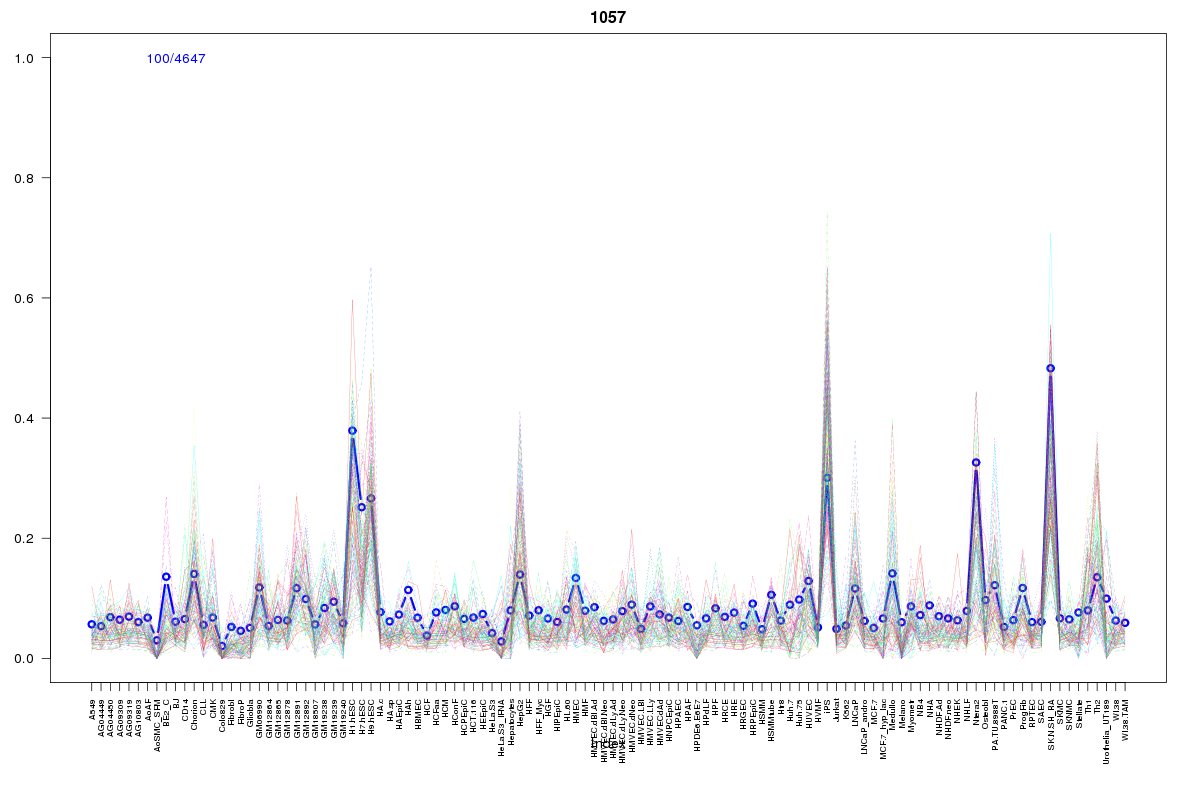 | 1057 | 1 |
 | 402 | 1 |
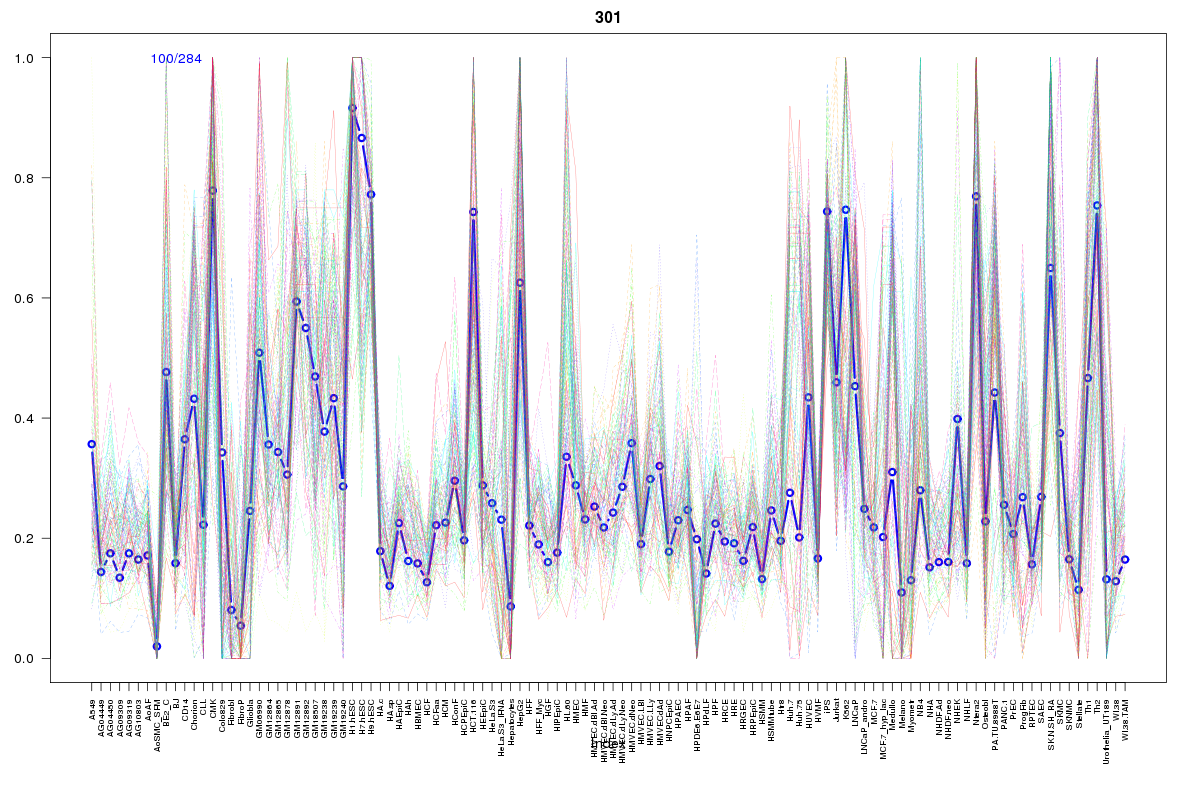 | 301 | 1 |
 | 2017 | 1 |
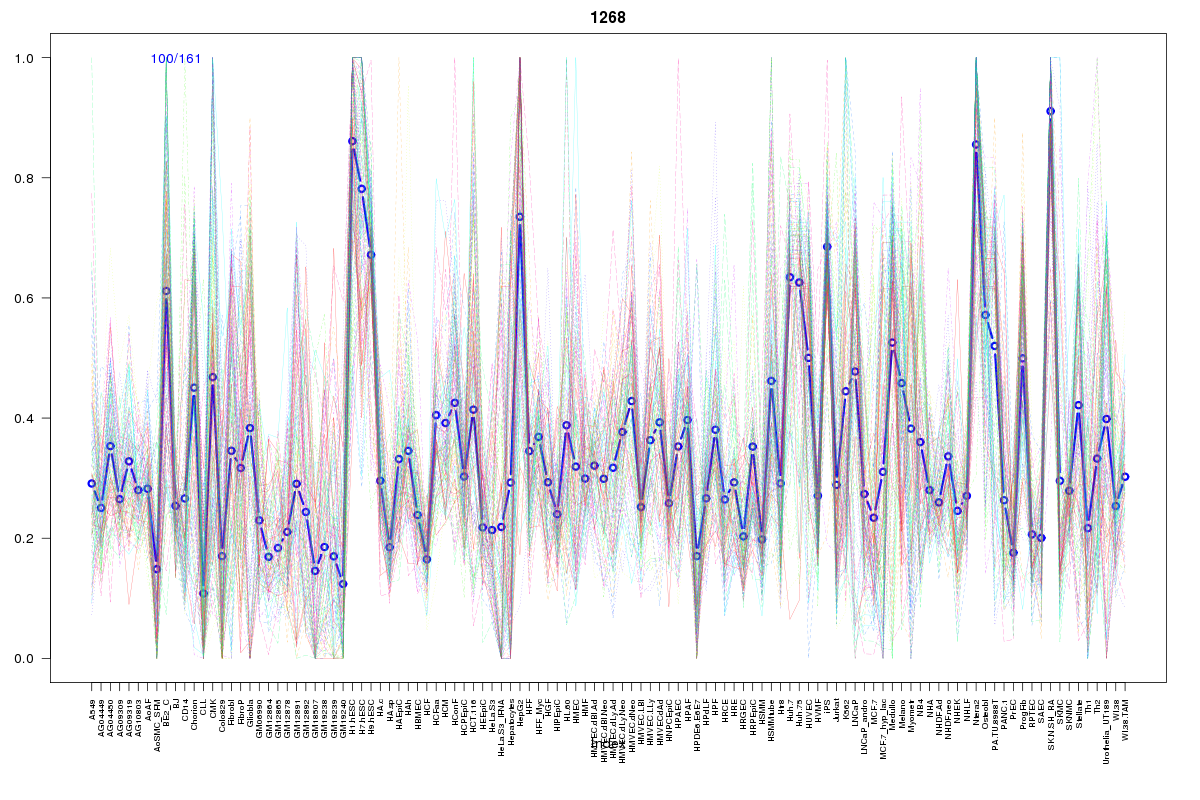 | 1268 | 1 |
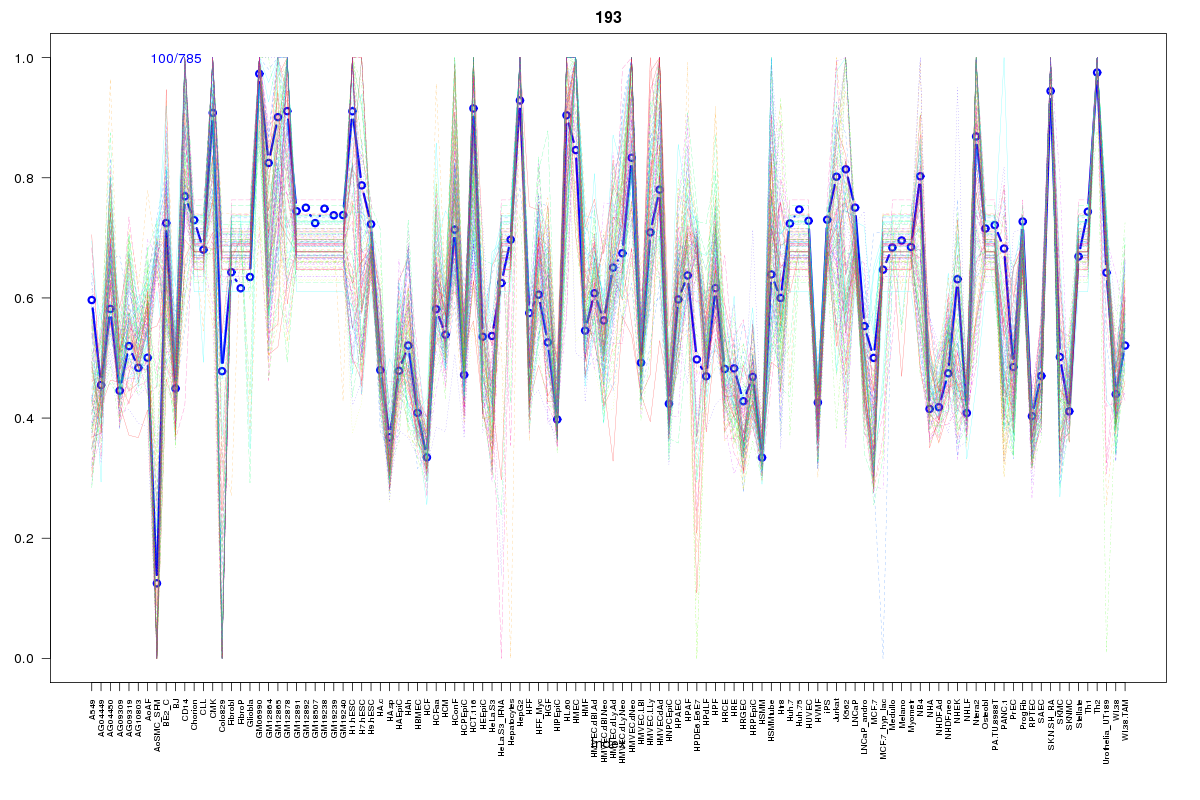 | 193 | 1 |
 | 1963 | 1 |
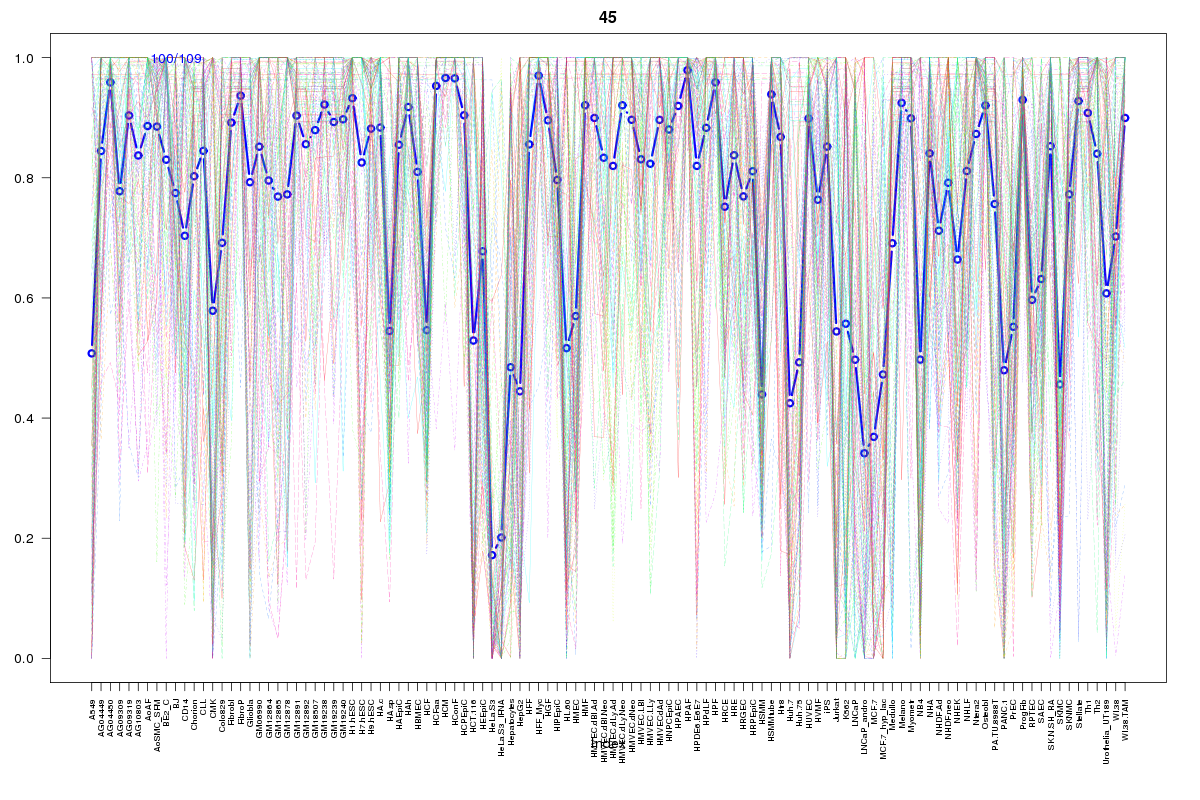 | 45 | 1 |
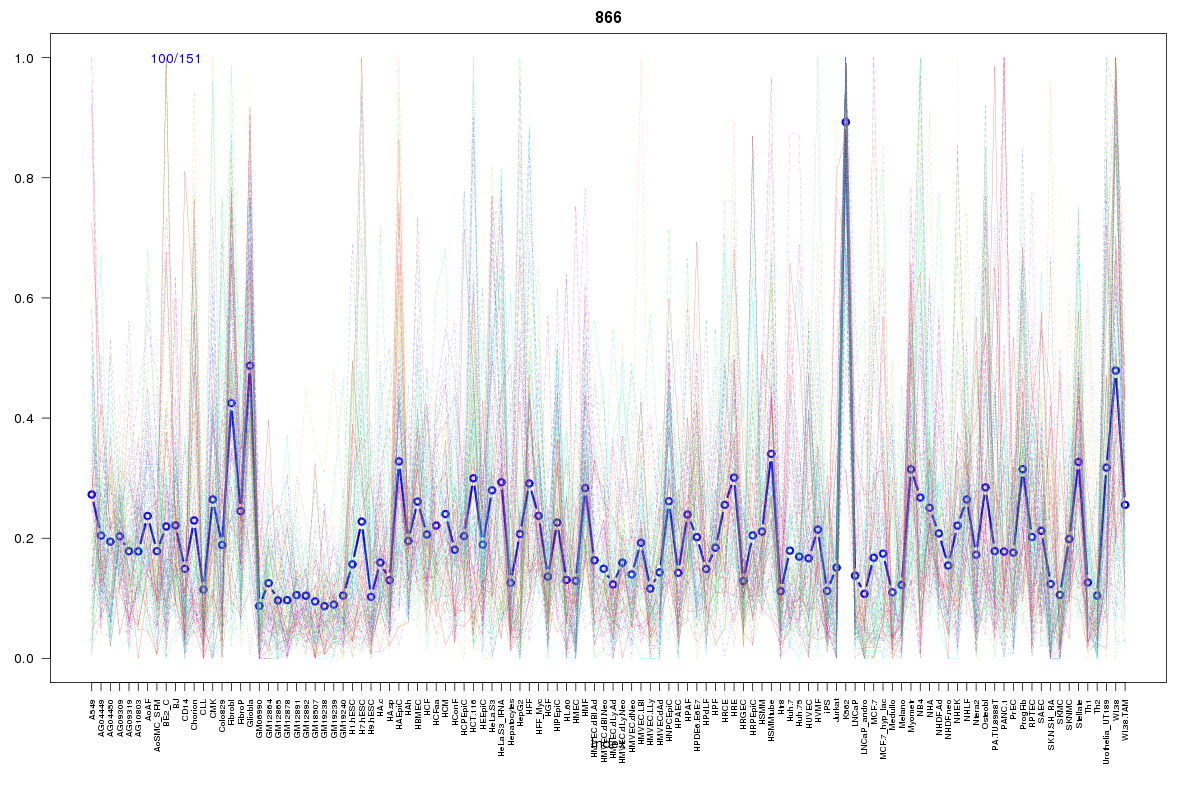 | 866 | 1 |
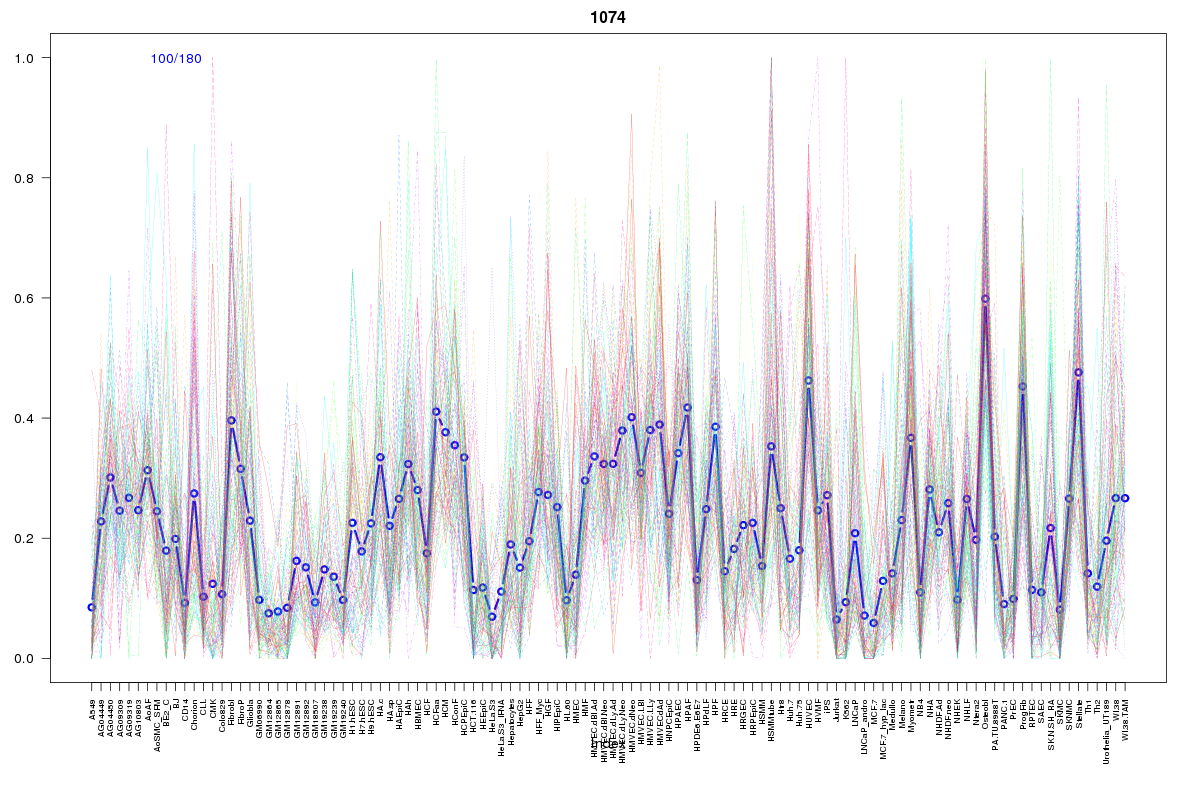 | 1074 | 1 |
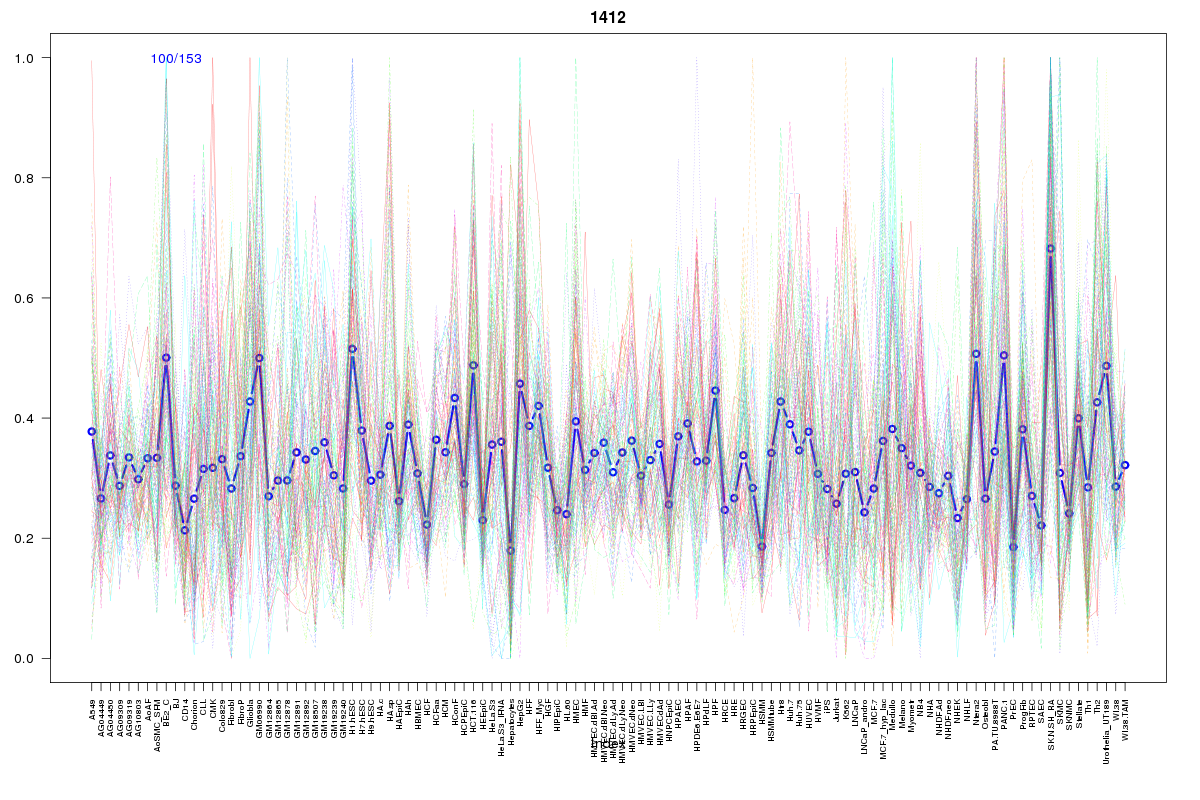 | 1412 | 1 |
 | 253 | 1 |
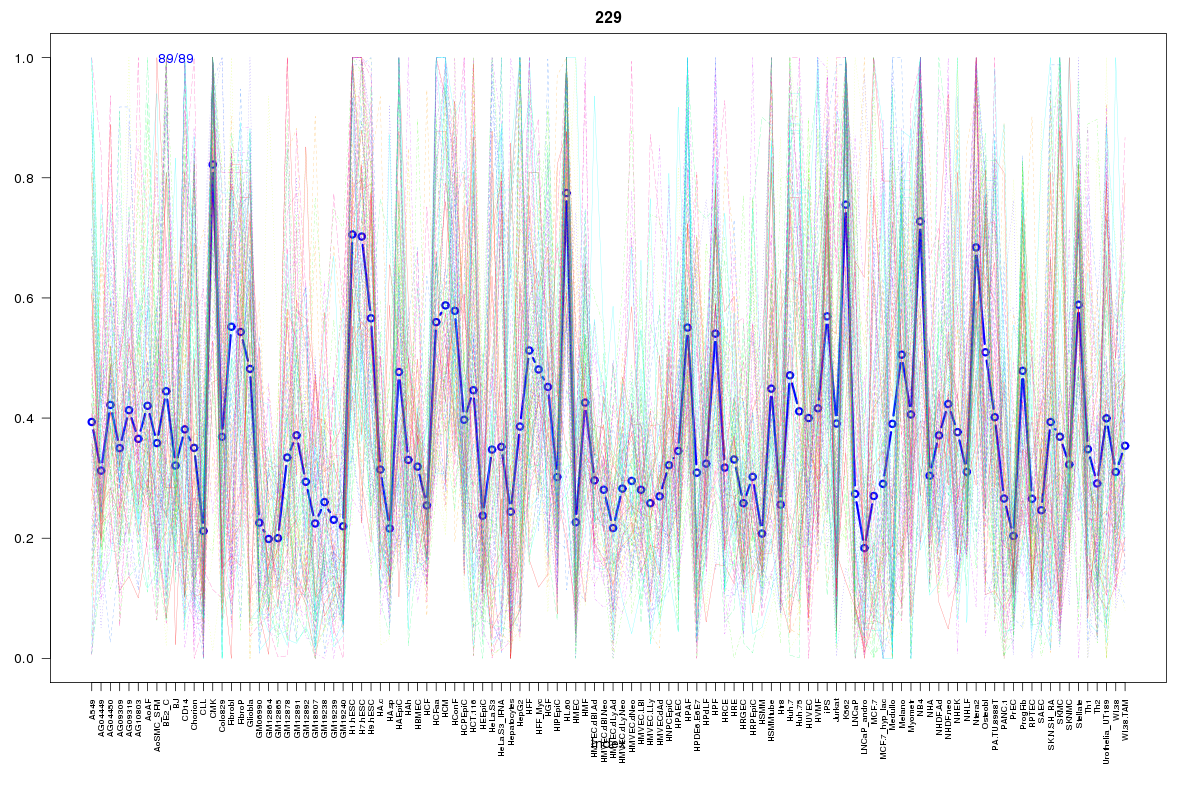 | 229 | 1 |
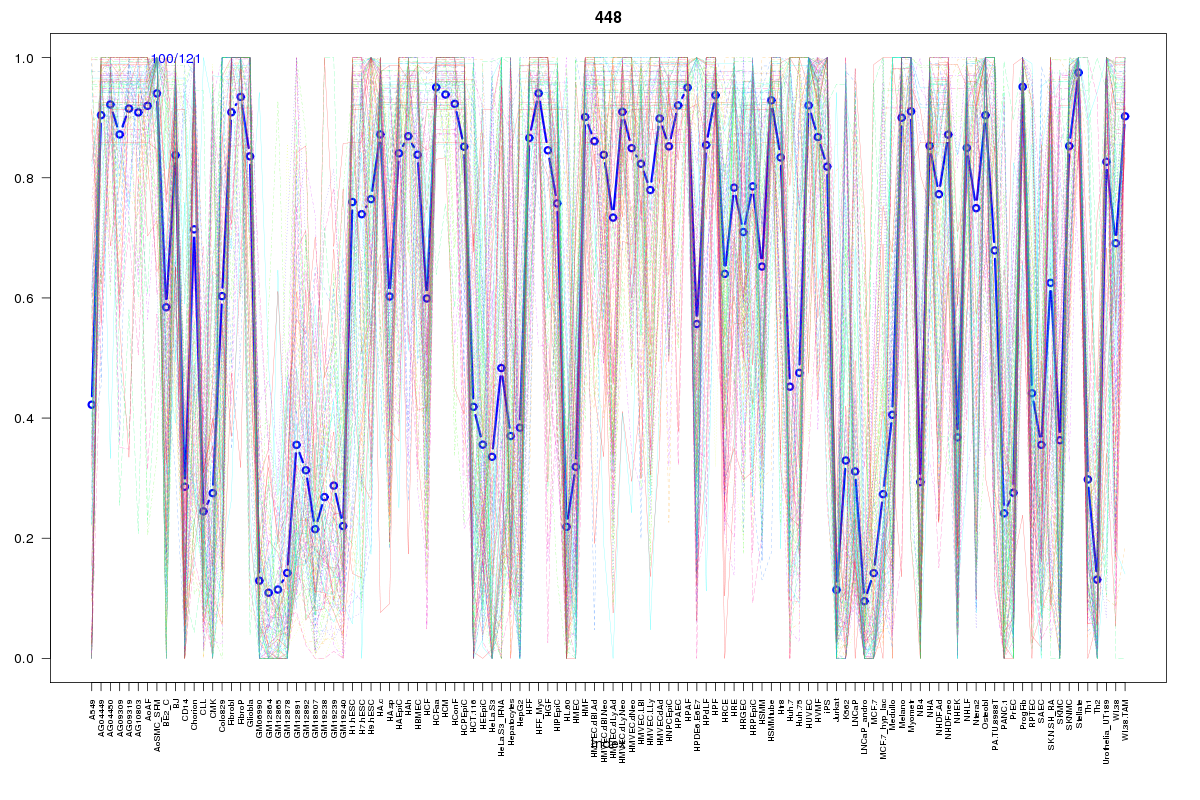 | 448 | 1 |
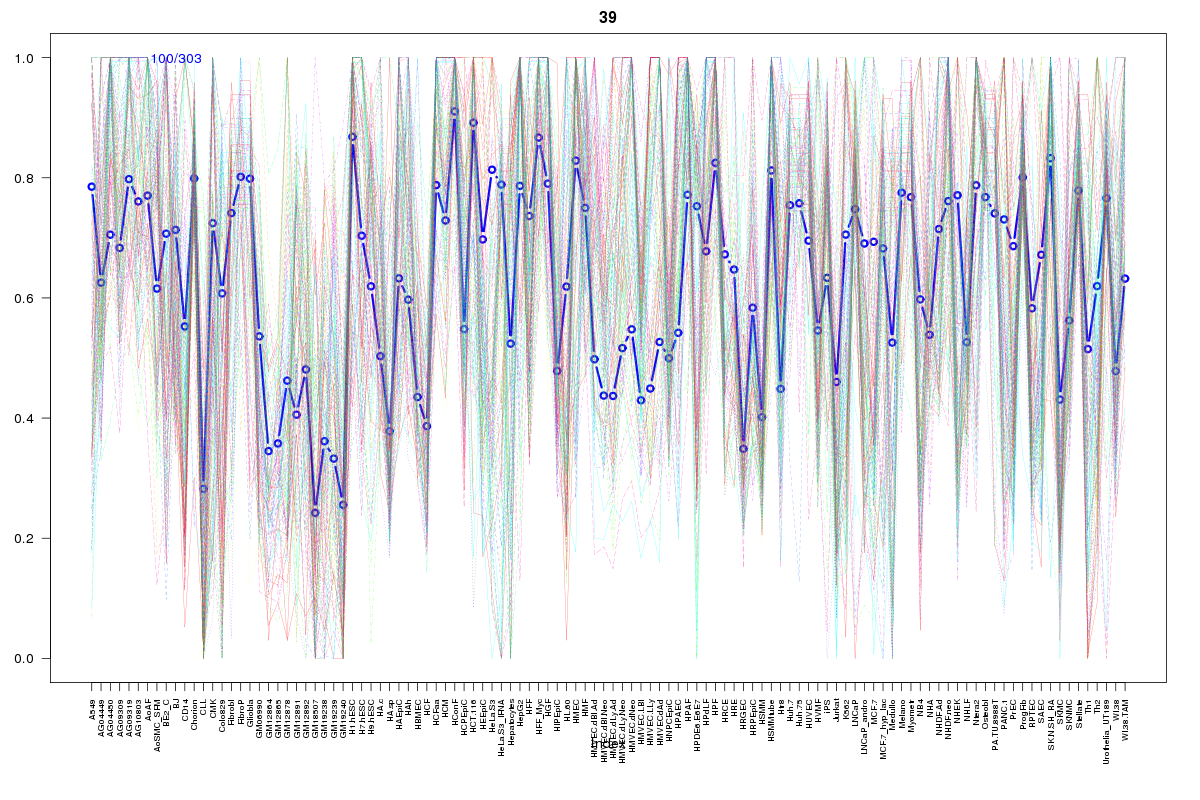 | 39 | 1 |
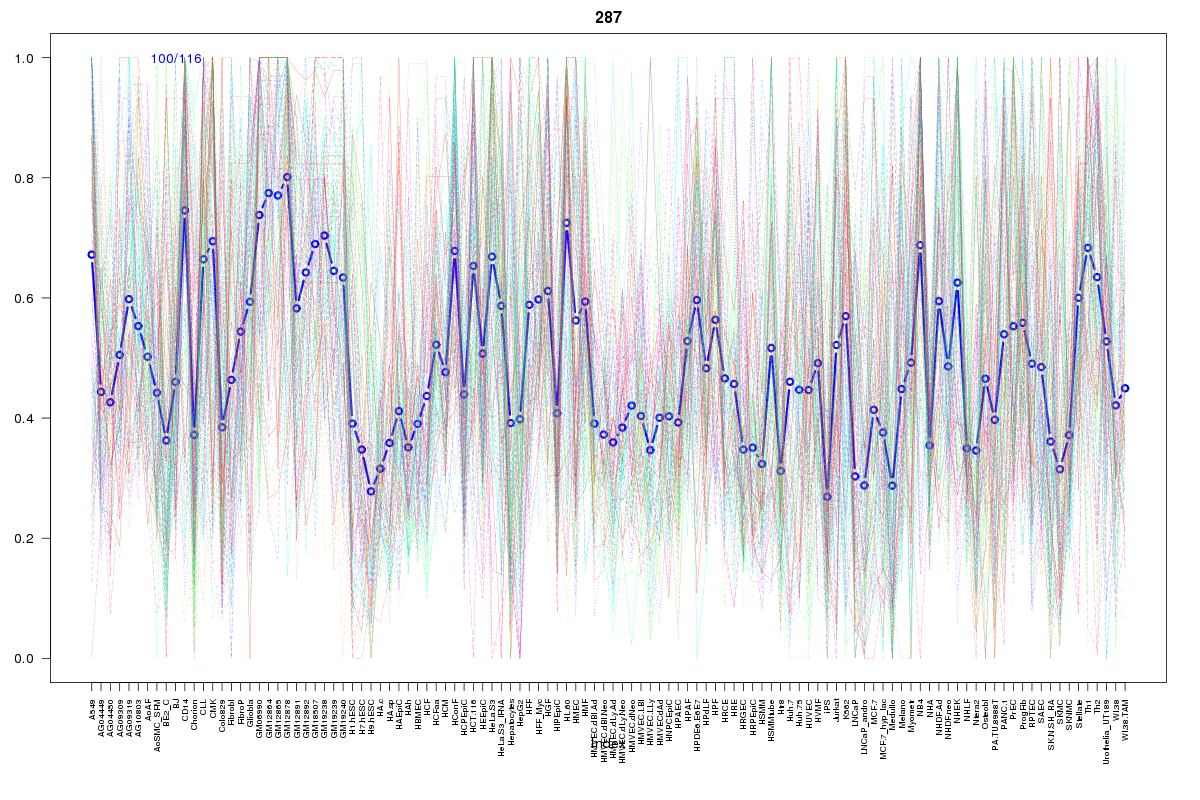 | 287 | 1 |
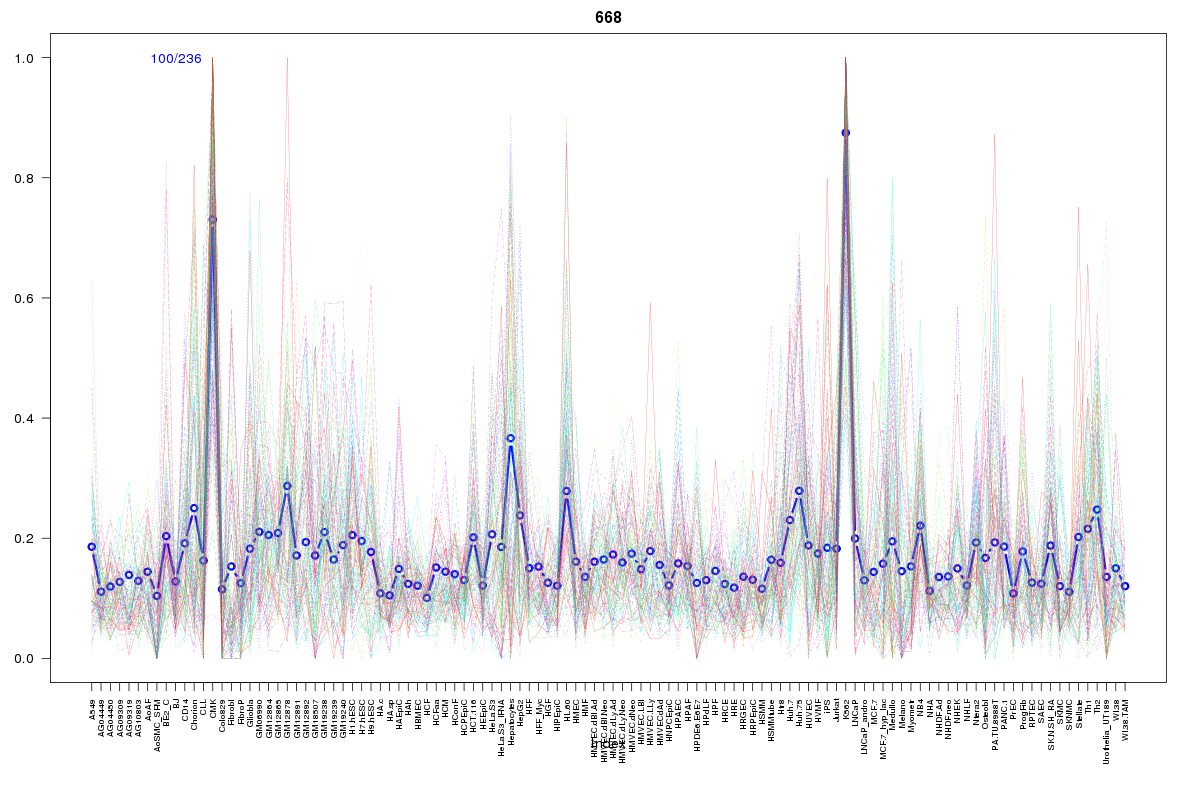 | 668 | 1 |
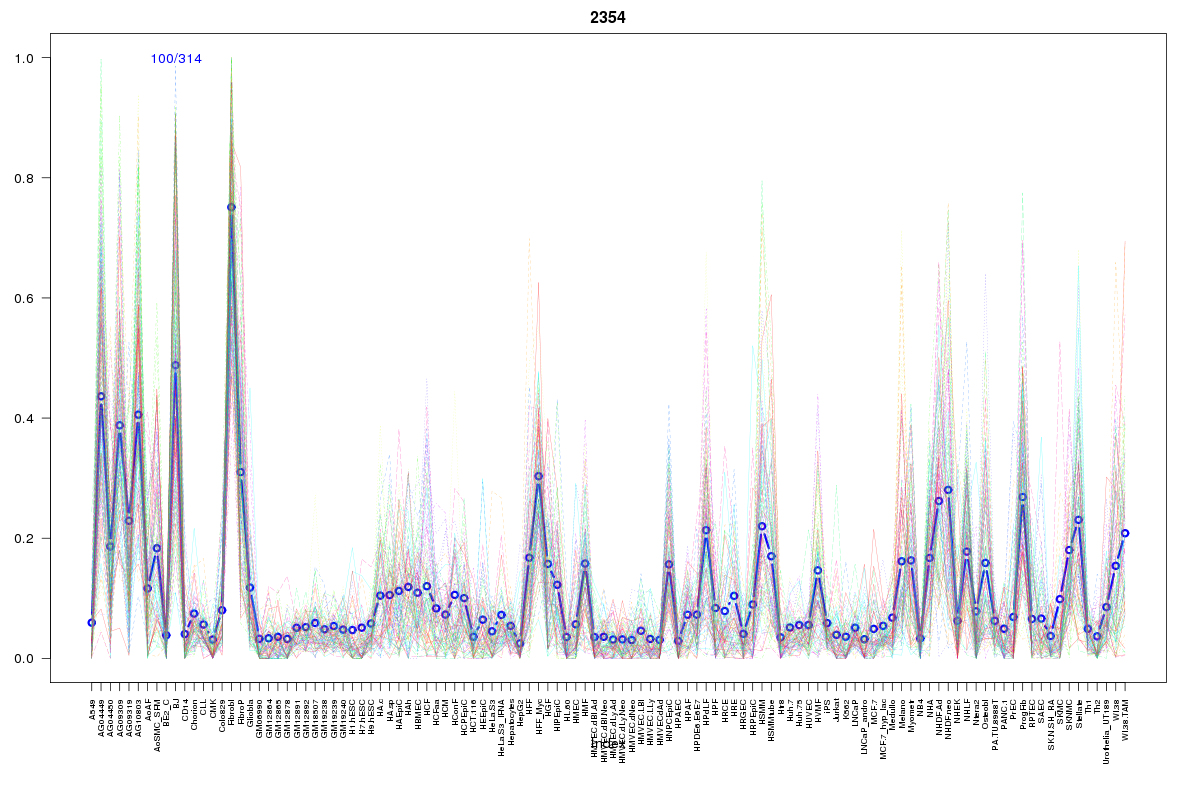 | 2354 | 1 |
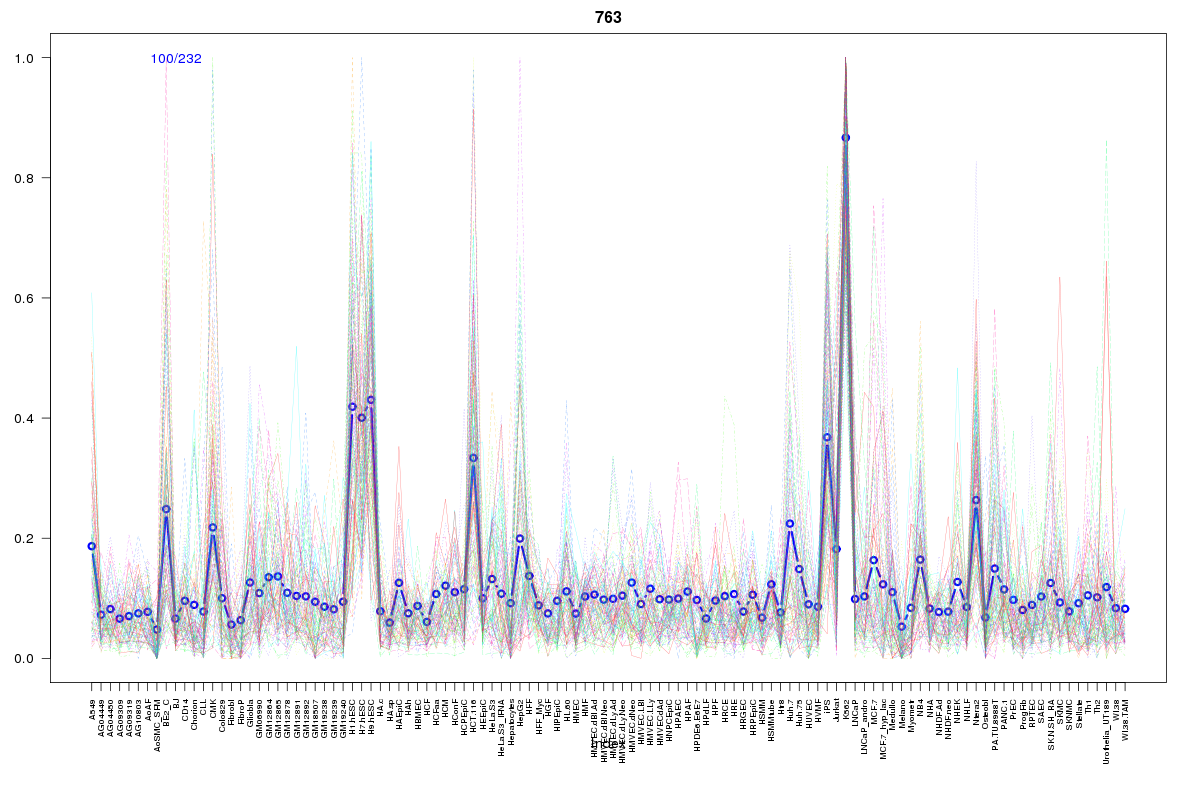 | 763 | 1 |
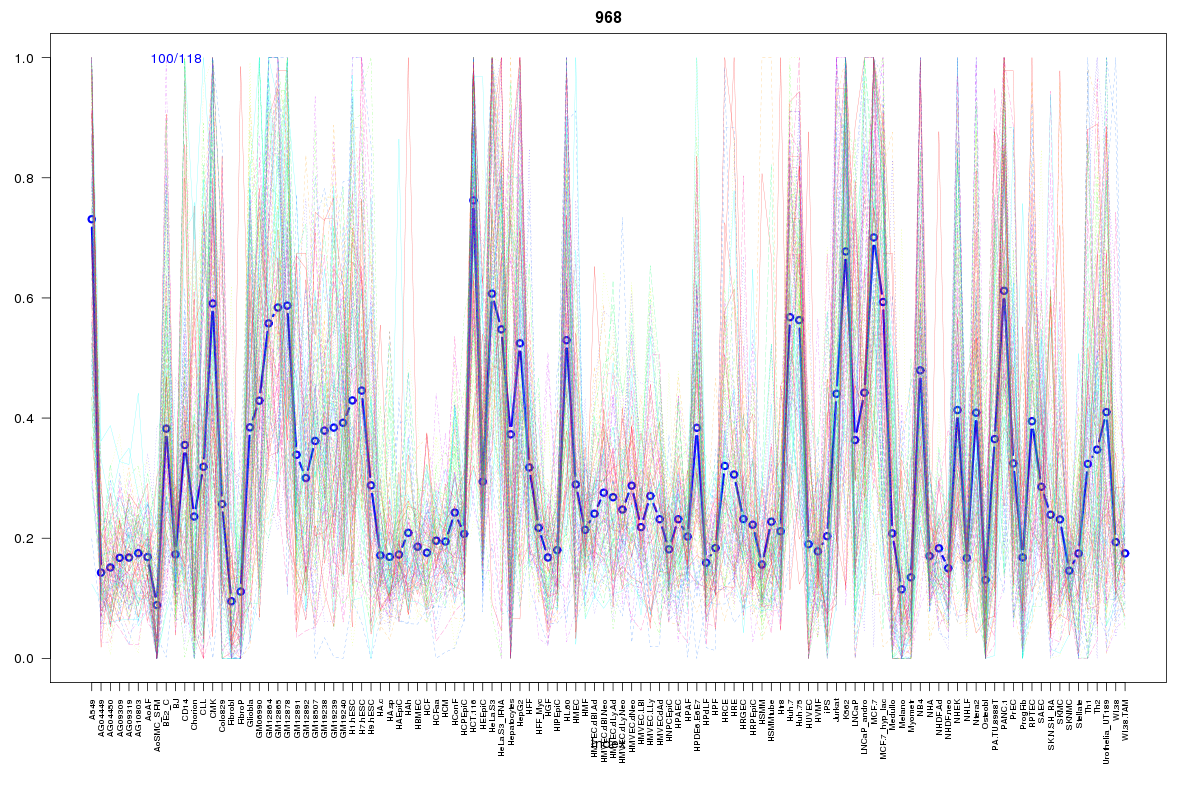 | 968 | 1 |
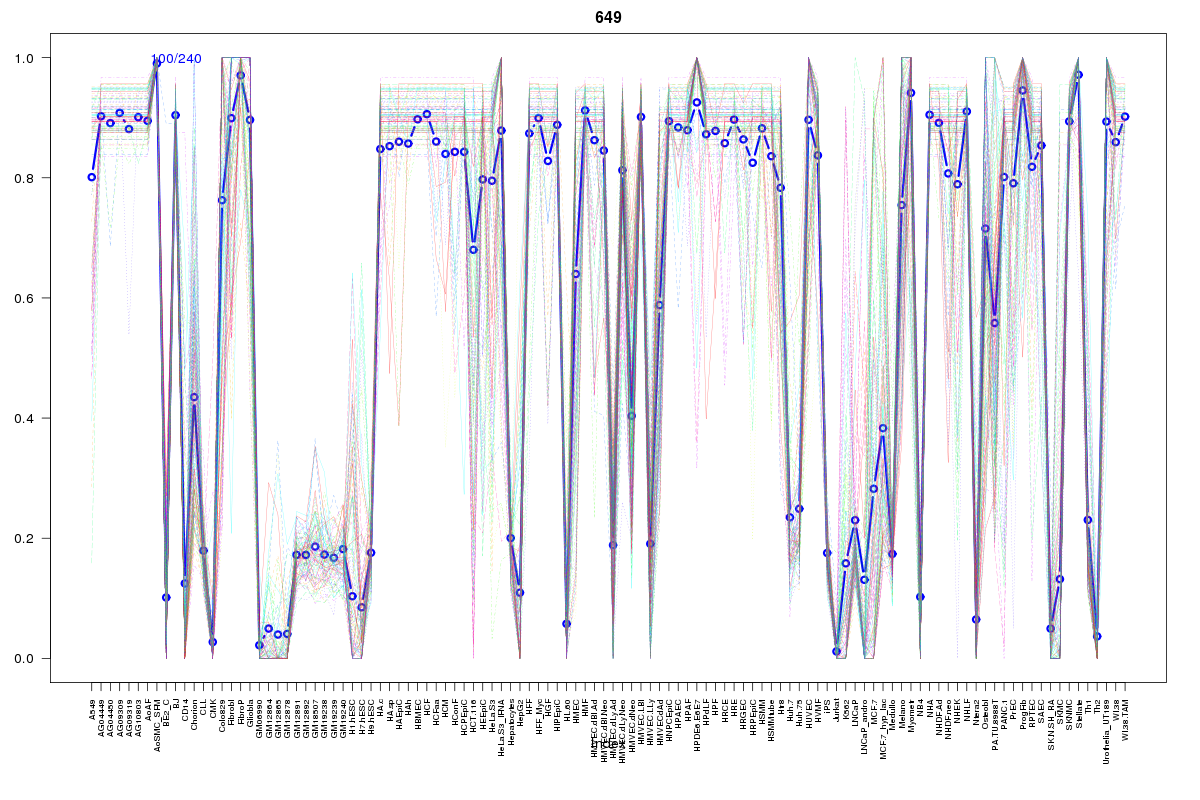 | 649 | 1 |
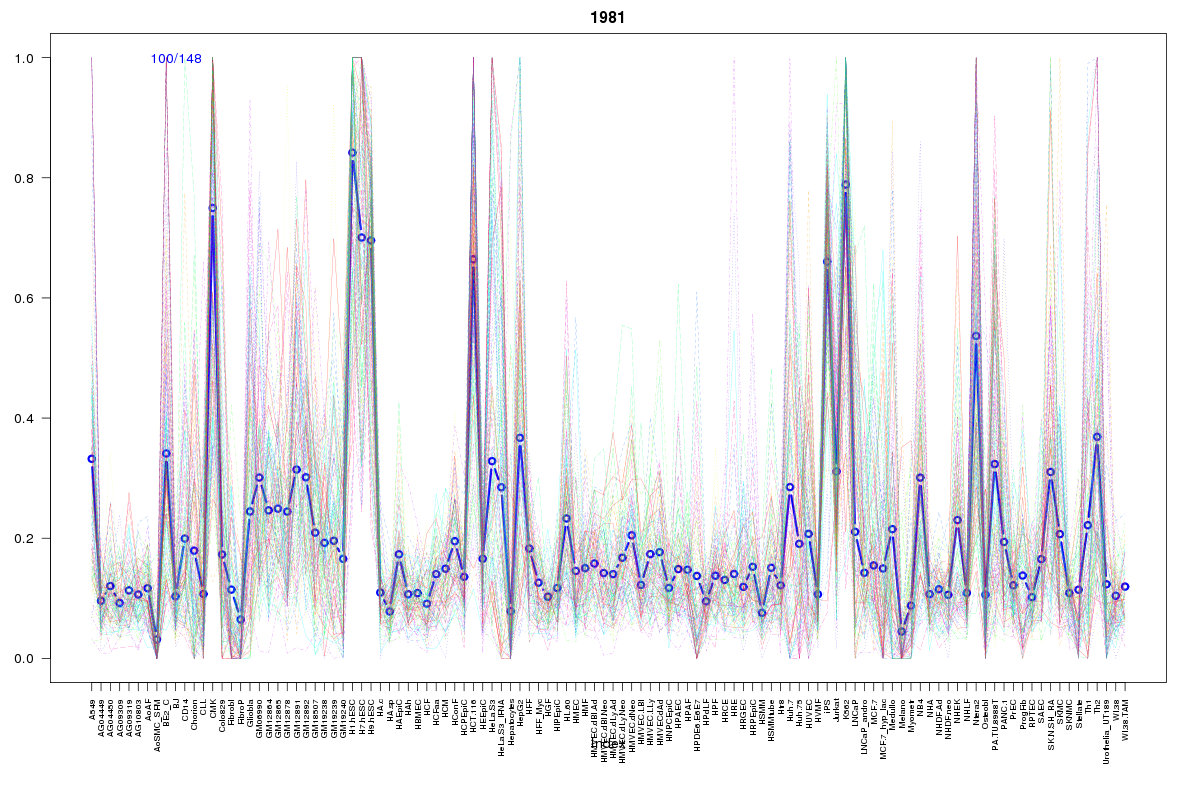 | 1981 | 1 |
 | 2175 | 1 |
 | 404 | 1 |
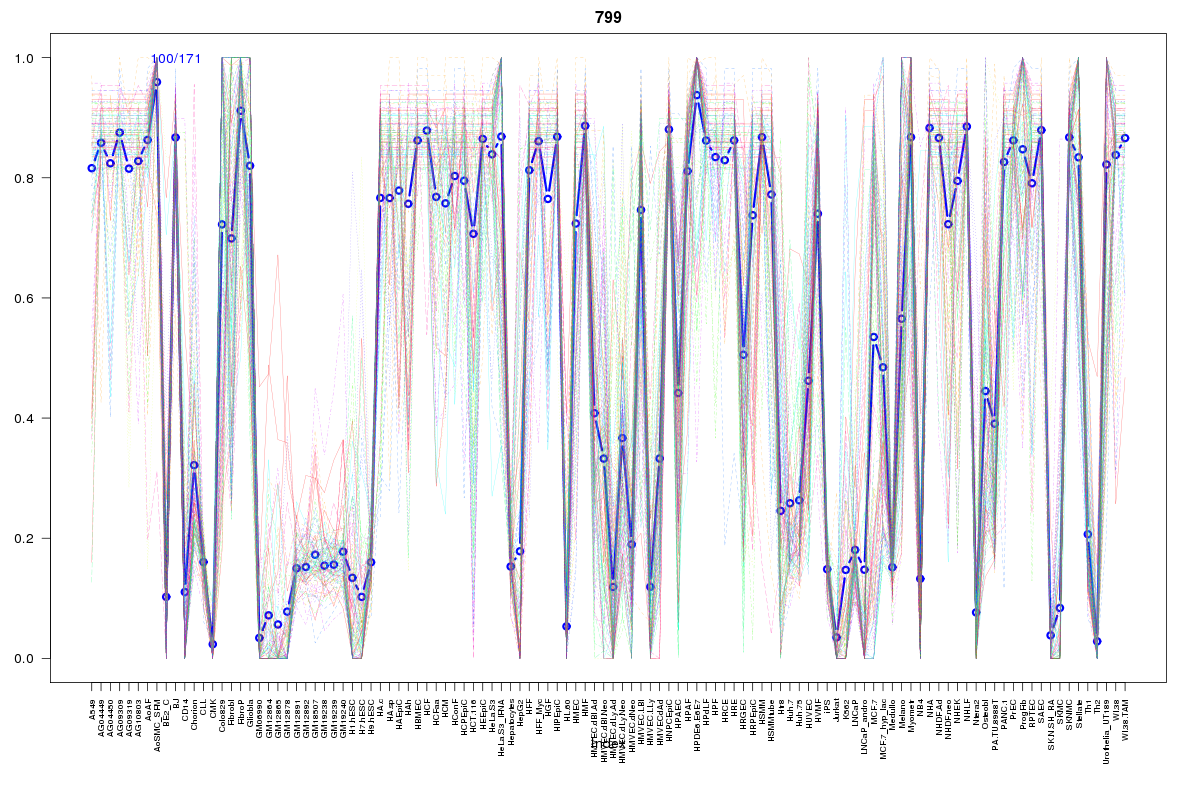 | 799 | 1 |
 | 2029 | 1 |
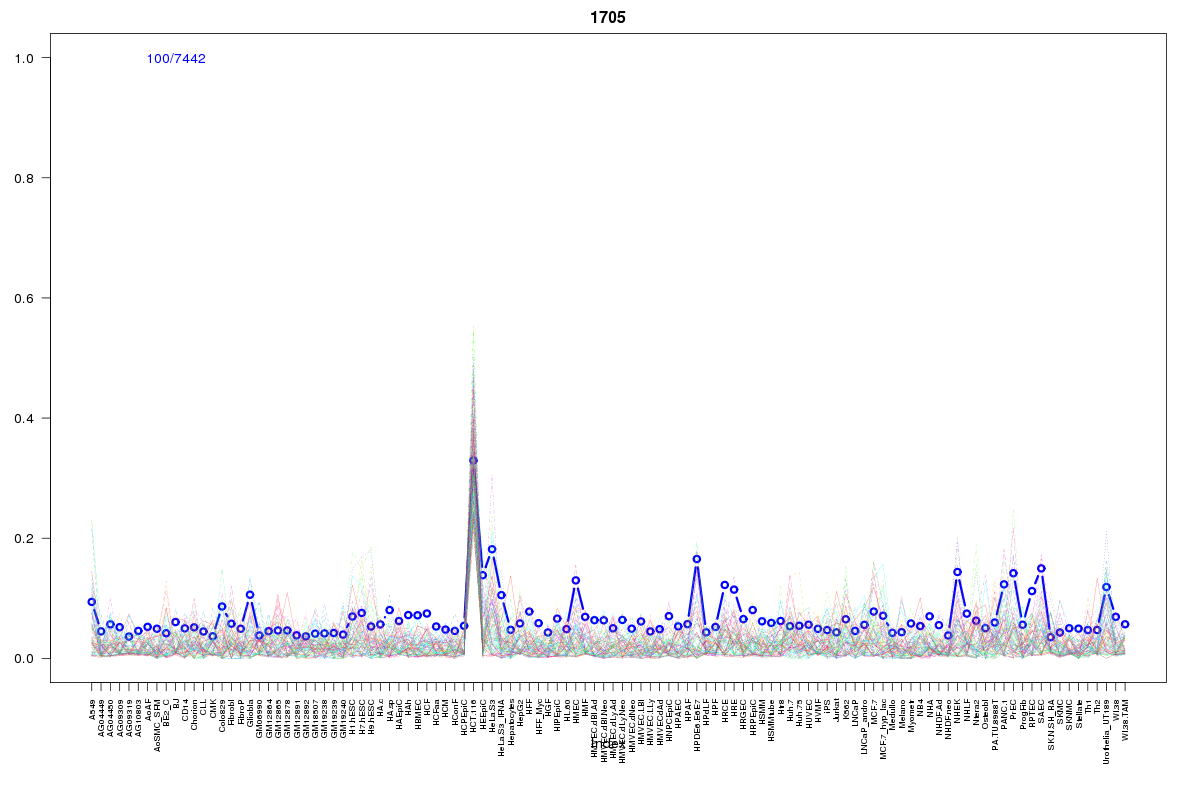 | 1705 | 1 |
 | 865 | 1 |
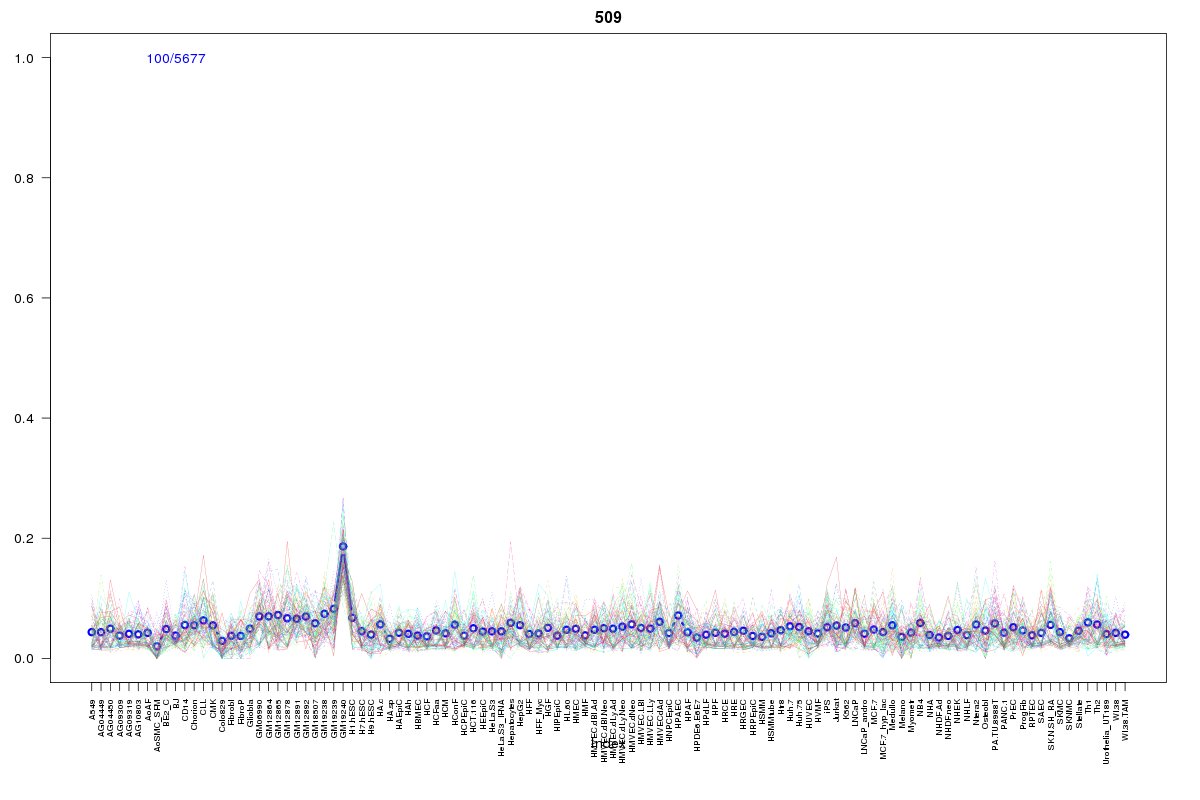 | 509 | 1 |
Resources
BED file downloads
Connects to 32 DHS sitesTop 10 Correlated DHS Sites
p-values indiciate significant higher or lower correlation| Location | Cluster | P-value |
|---|---|---|
| chr19:55667840-55667990 | 301 | 0 |
| chr19:55668160-55668310 | 1268 | 0.001 |
| chr19:55658140-55658290 | 404 | 0.002 |
| chr19:55658320-55658470 | 2029 | 0.002 |
| chr19:55667685-55667835 | 402 | 0.002 |
| chr19:55591640-55591790 | 193 | 0.002 |
| chr19:55686440-55686590 | 763 | 0.002 |
| chr19:55657860-55658010 | 1981 | 0.002 |
| chr19:55685205-55685355 | 1412 | 0.006 |
| chr19:55568460-55568610 | 615 | 0.006 |
| chr19:55638760-55638910 | 615 | 0.011 |
External Databases
UCSCEnsembl (ENSG00000129991)