Gene: TNNT3
chr11: 1940791-1959936Expression Profile
(log scale)
Graphical Connections
Distribution of linked clusters:
You may find it interesting if many of the connected DHS sites belong to the same cluster.| Cluster Profile | Cluster ID | Number of DHS sites in this cluster |
|---|---|---|
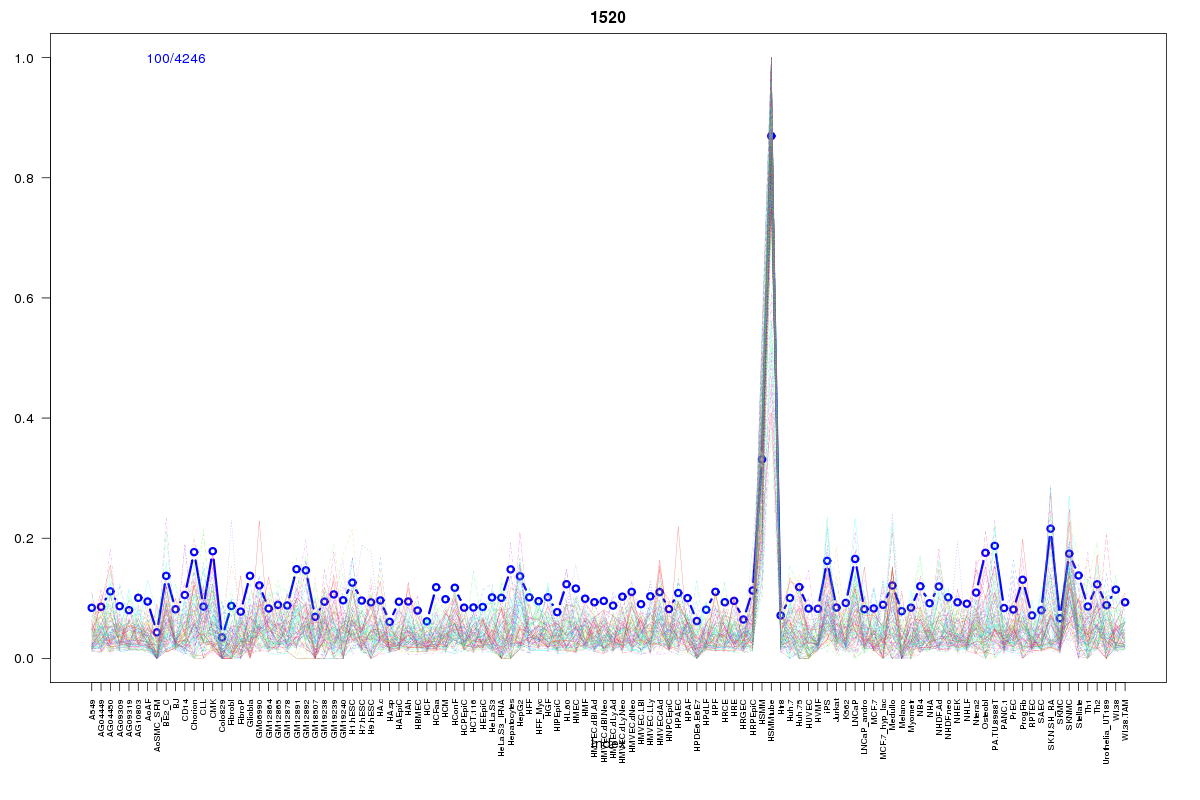 | 1520 | 16 |
 | 1078 | 9 |
 | 2279 | 7 |
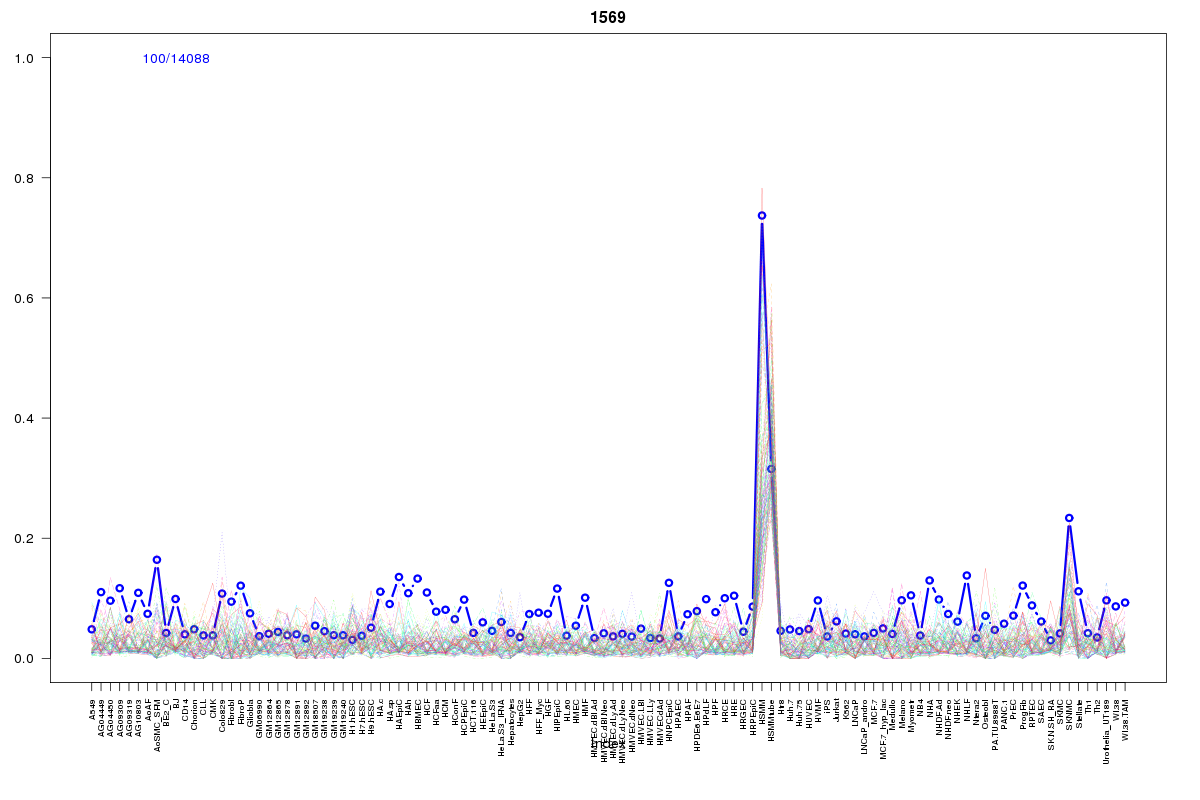 | 1569 | 5 |
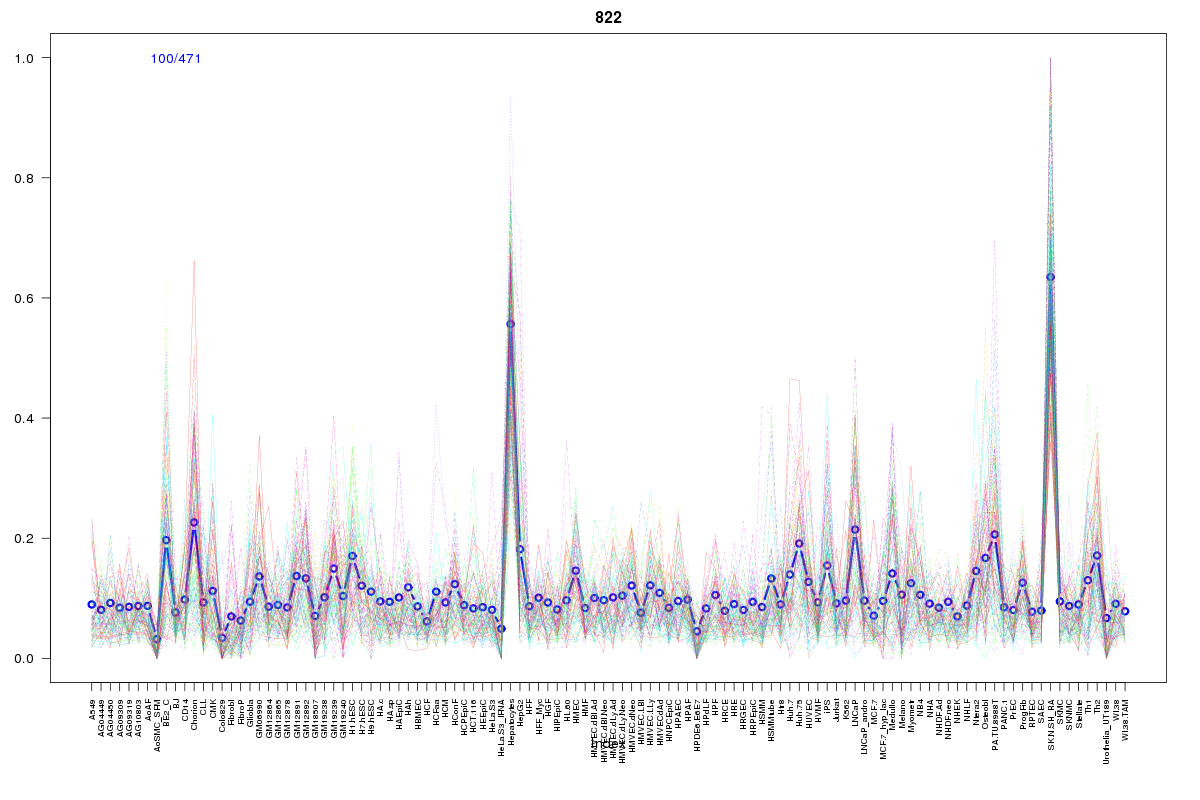 | 822 | 5 |
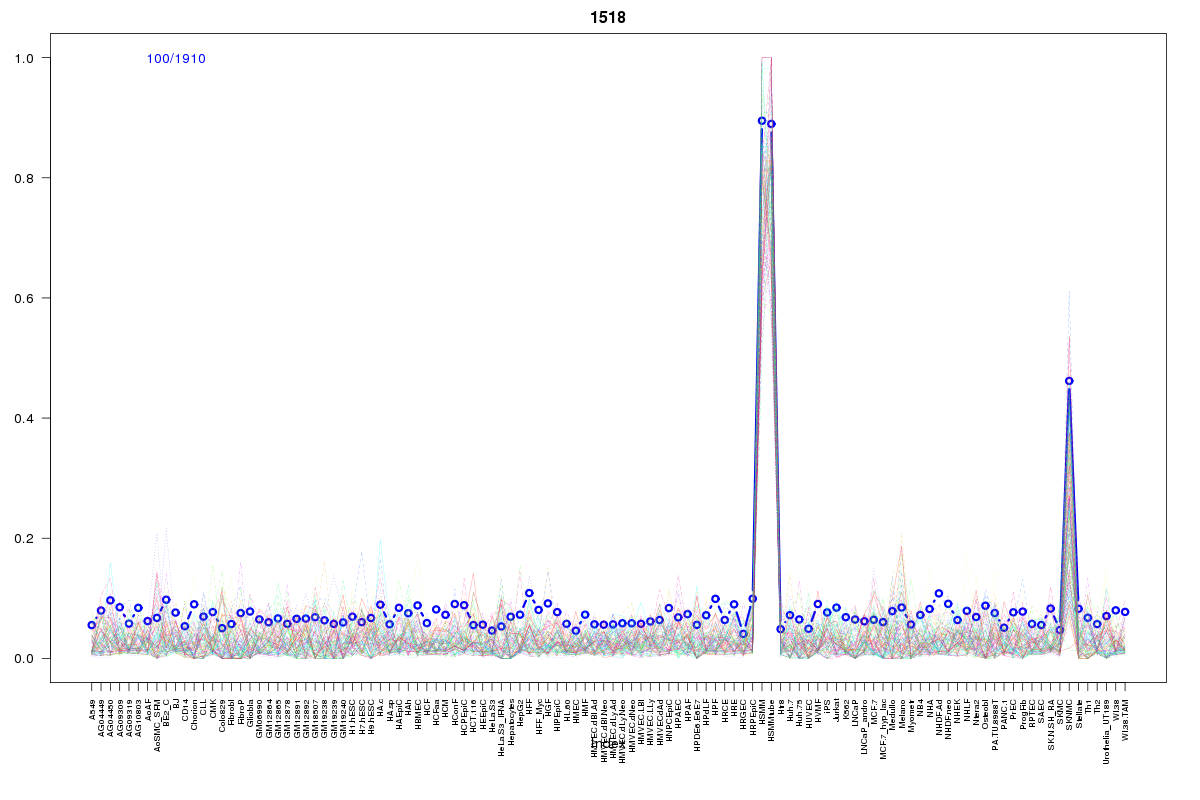 | 1518 | 4 |
 | 1225 | 3 |
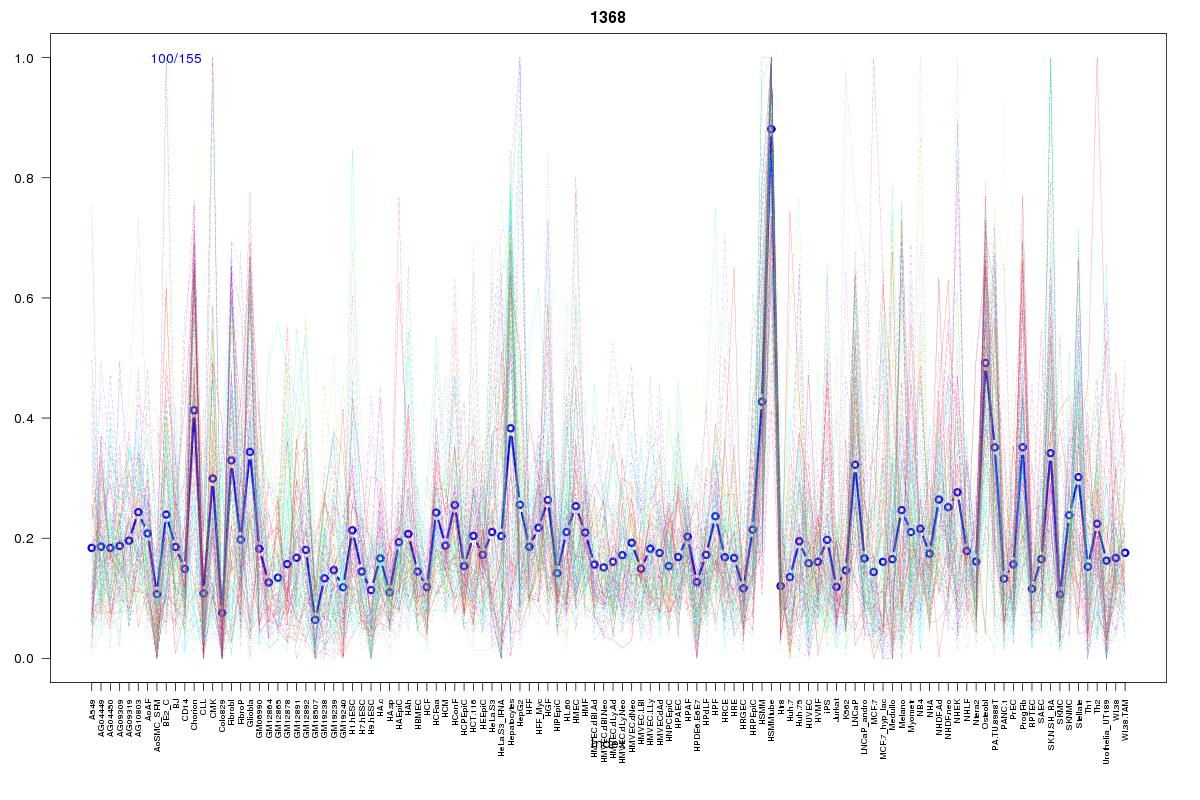 | 1368 | 3 |
 | 1008 | 3 |
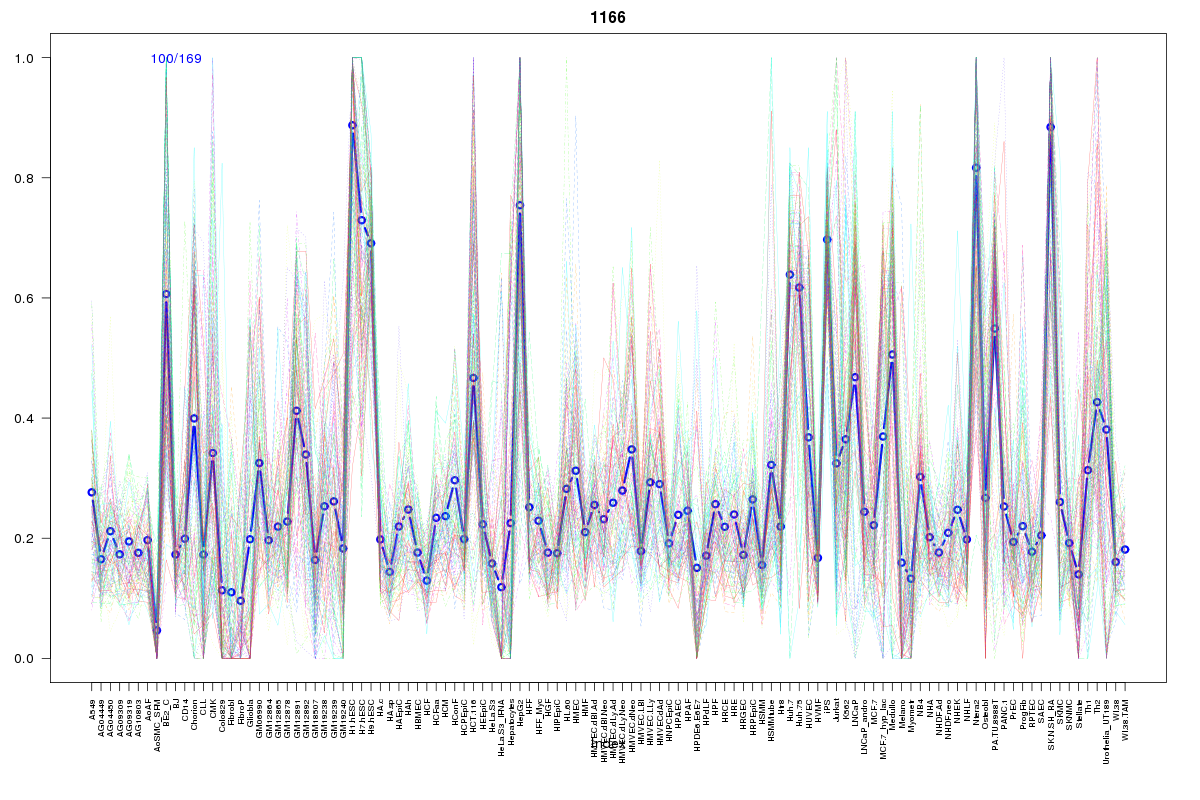 | 1166 | 2 |
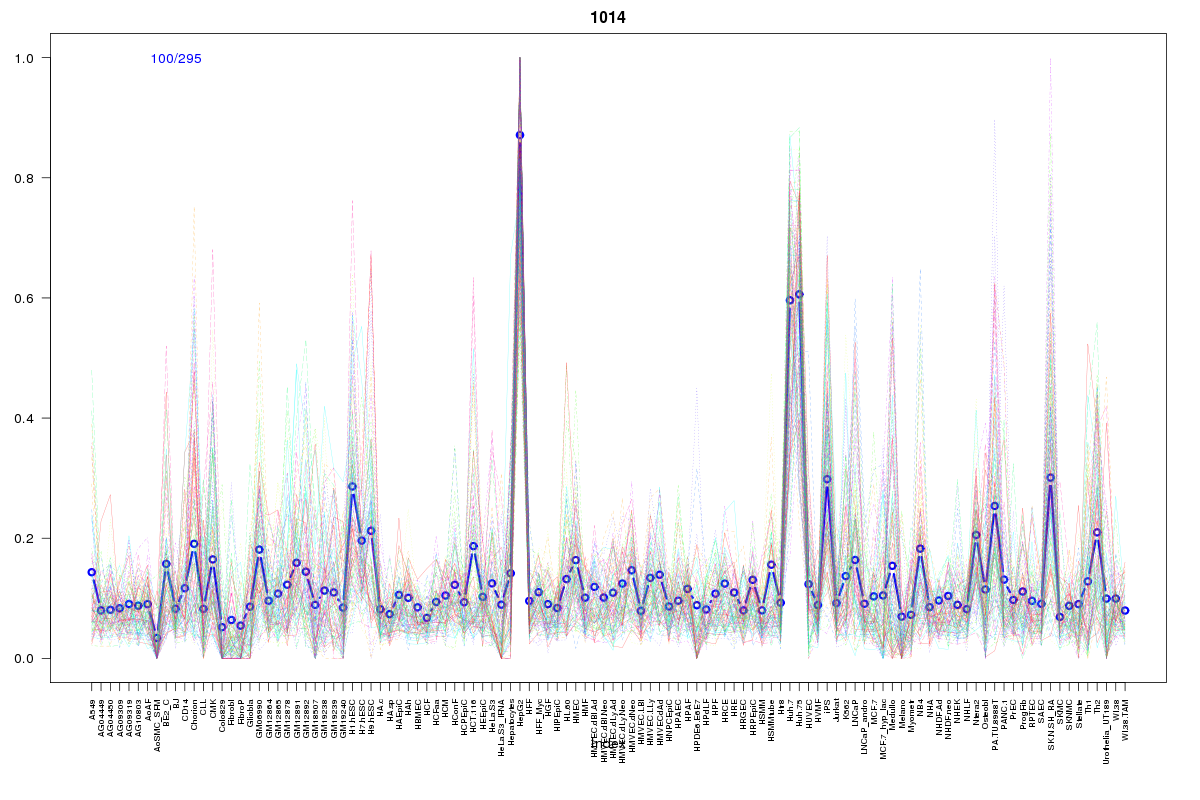 | 1014 | 2 |
 | 1115 | 2 |
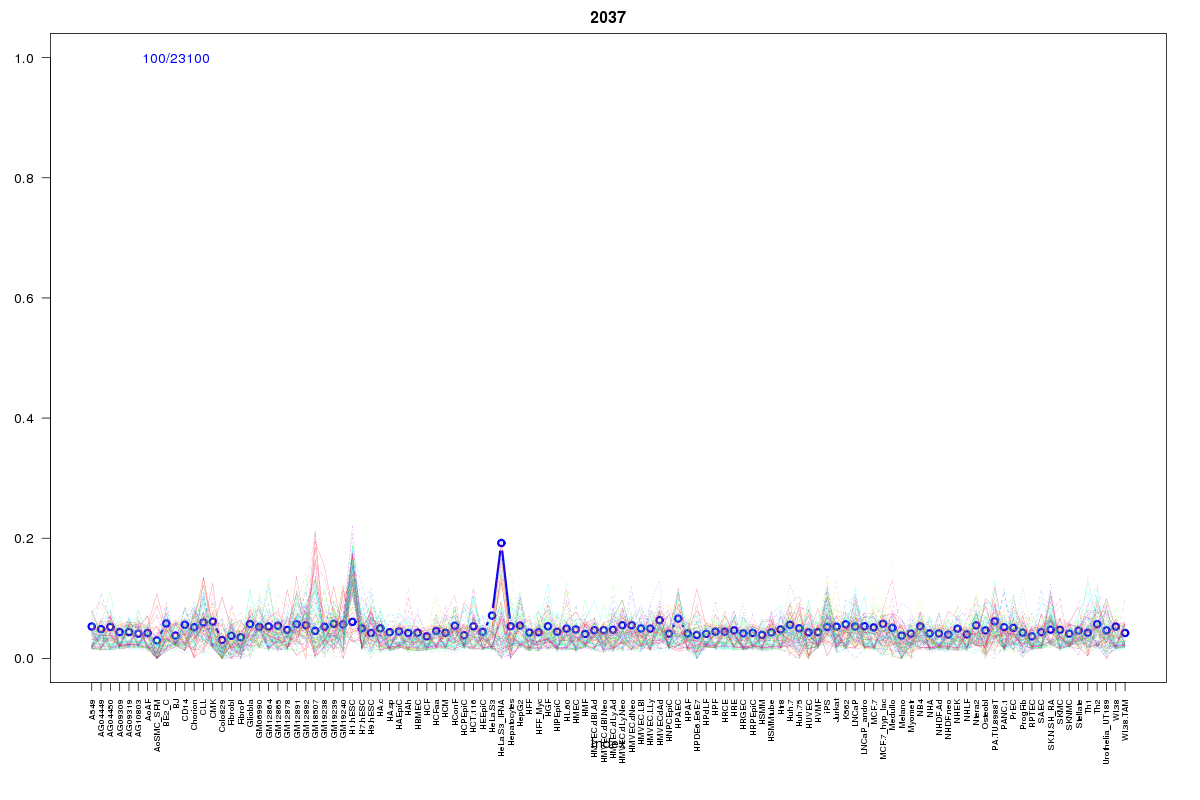 | 2037 | 1 |
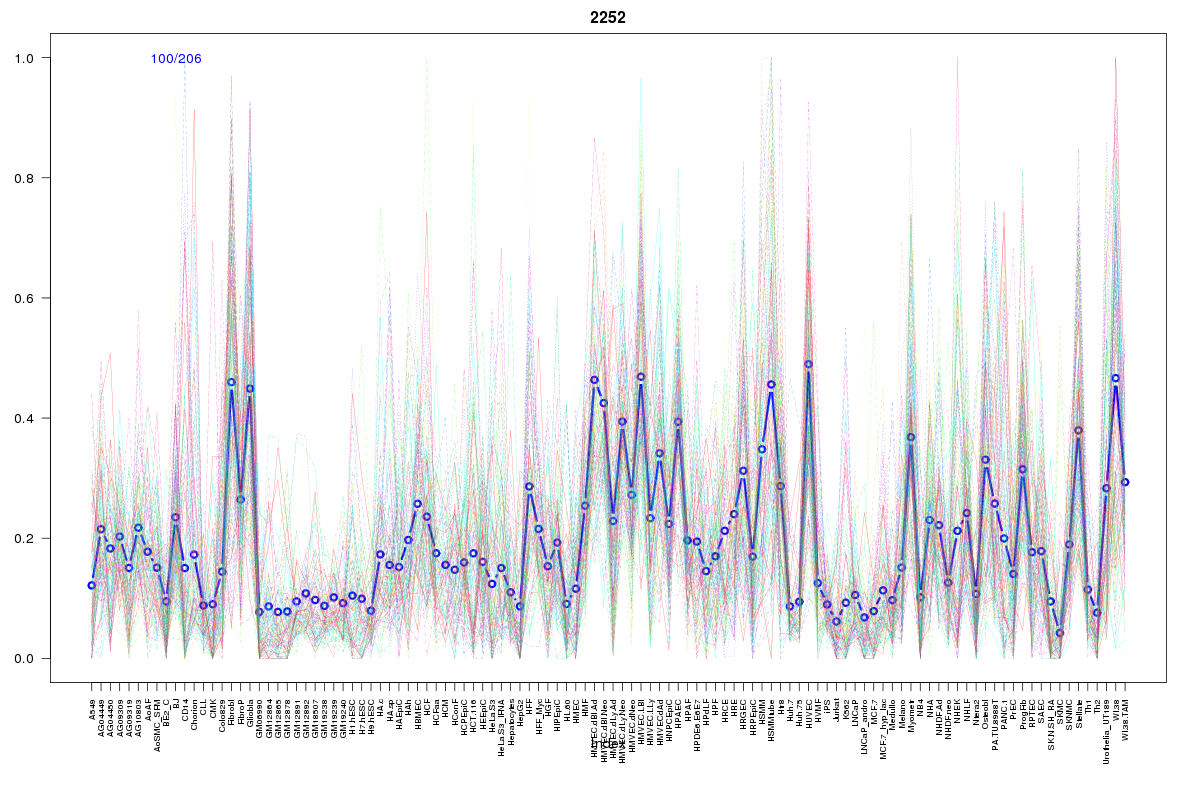 | 2252 | 1 |
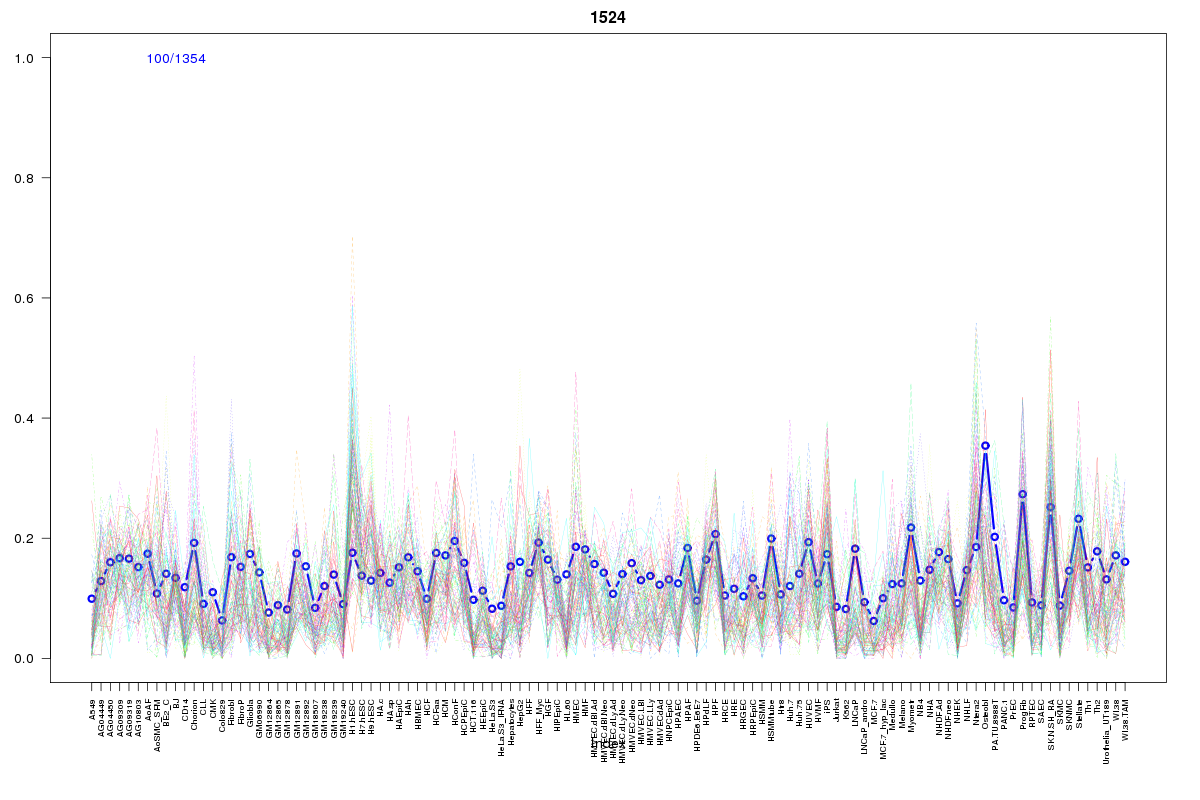 | 1524 | 1 |
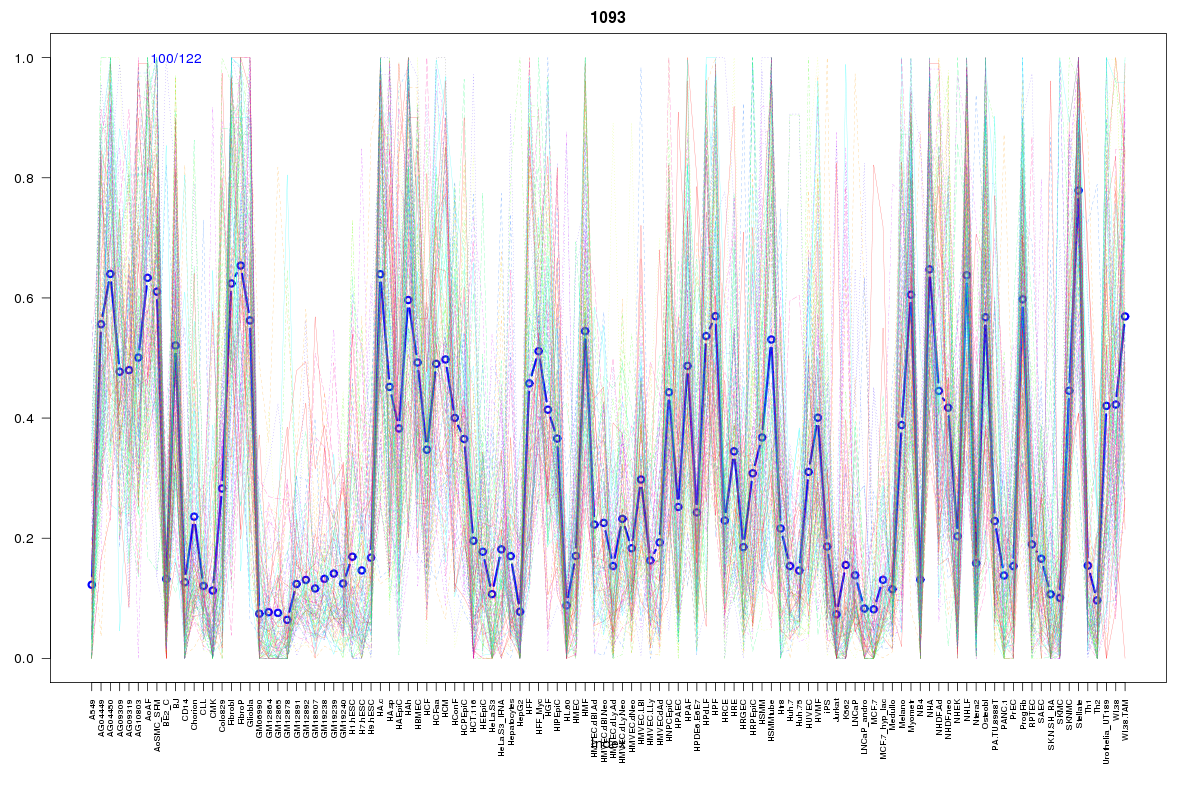 | 1093 | 1 |
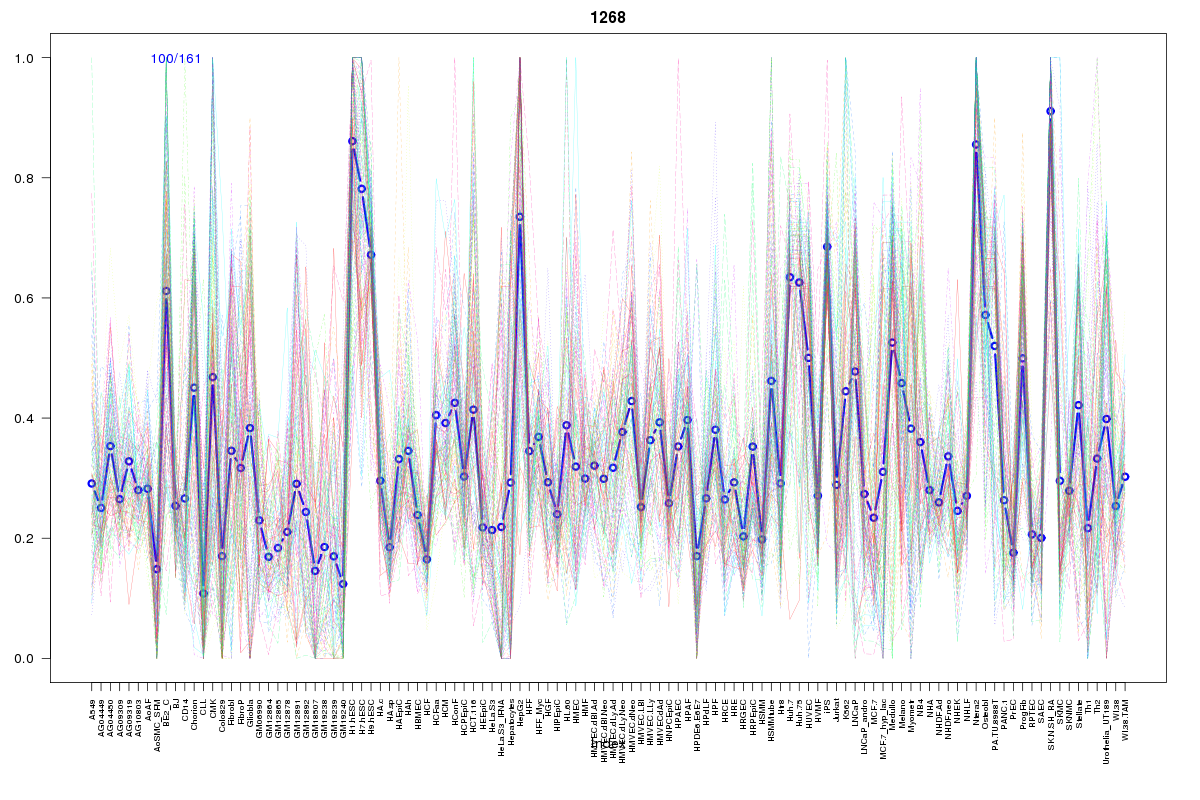 | 1268 | 1 |
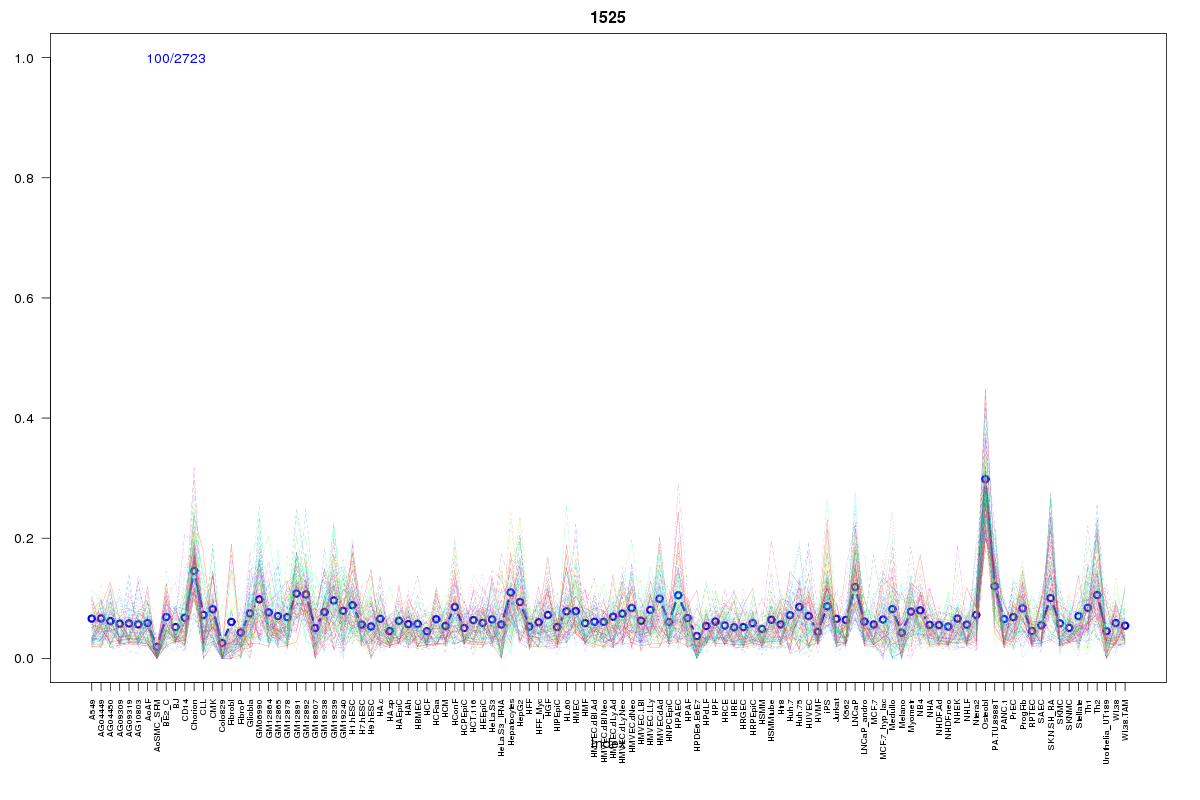 | 1525 | 1 |
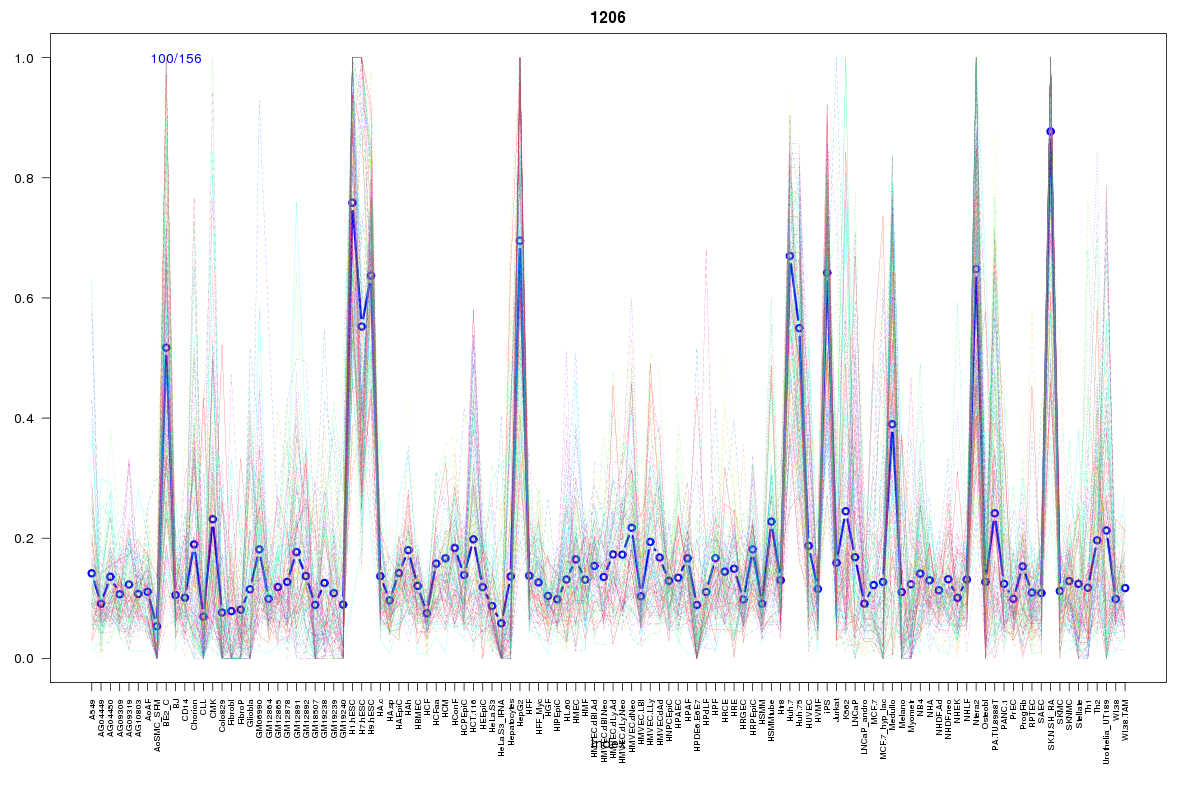 | 1206 | 1 |
 | 1319 | 1 |
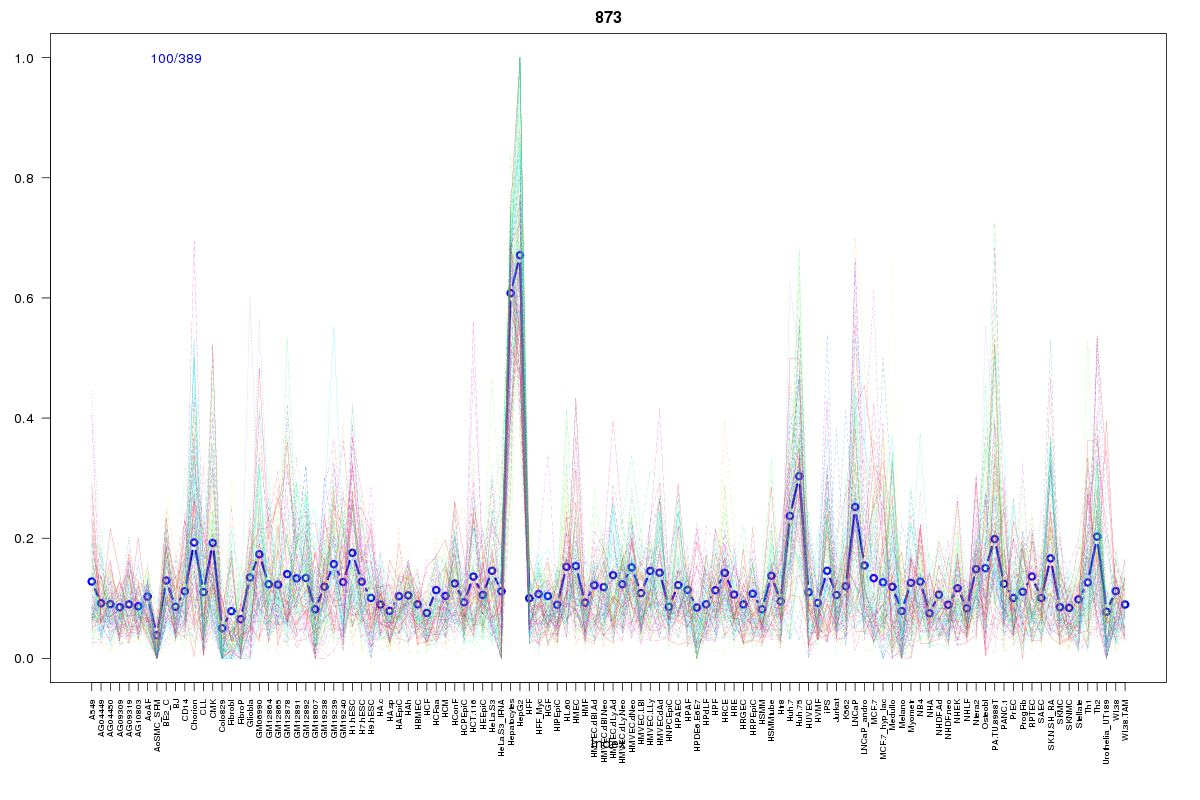 | 873 | 1 |
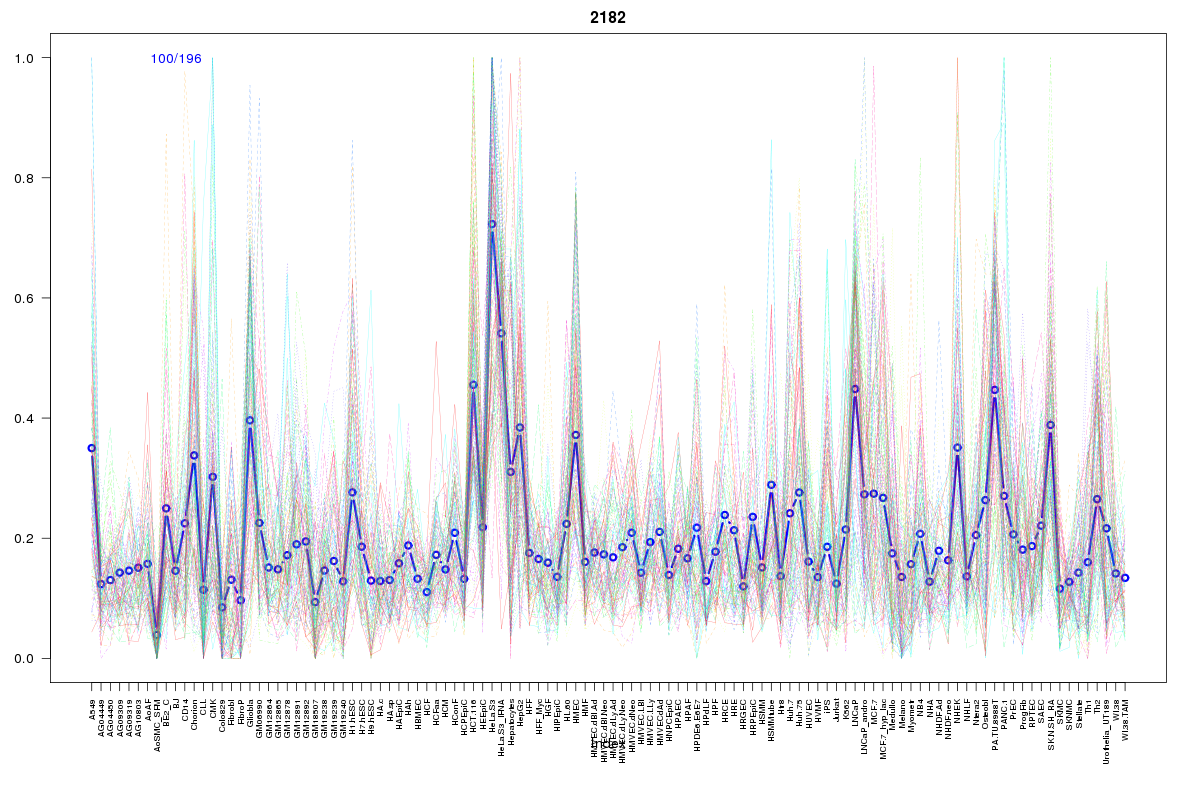 | 2182 | 1 |
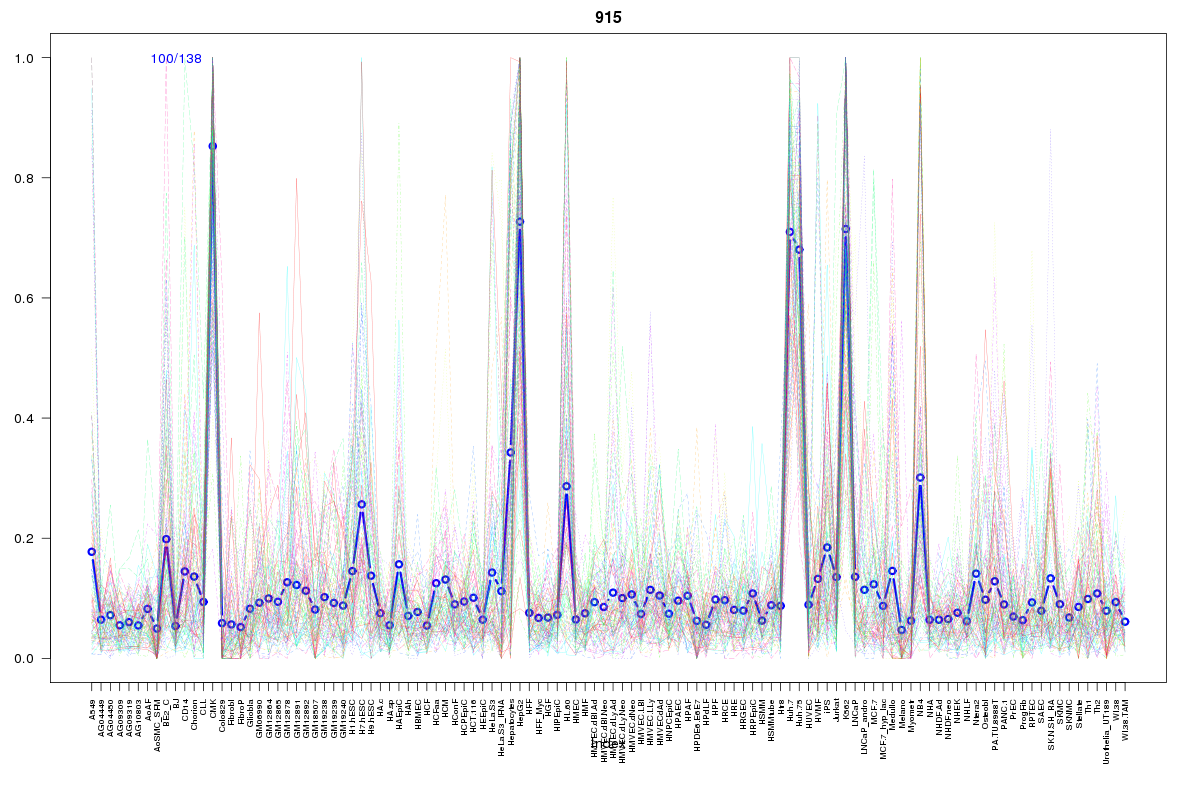 | 915 | 1 |
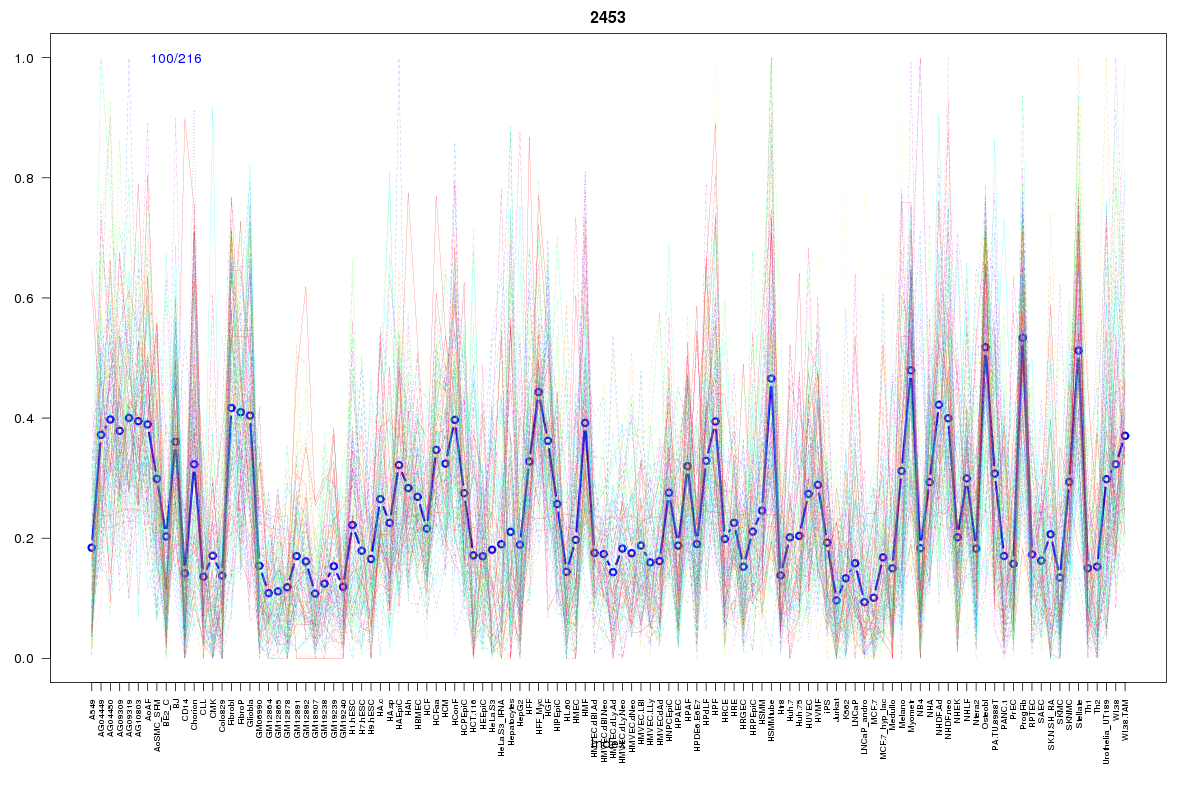 | 2453 | 1 |
 | 2122 | 1 |
 | 510 | 1 |
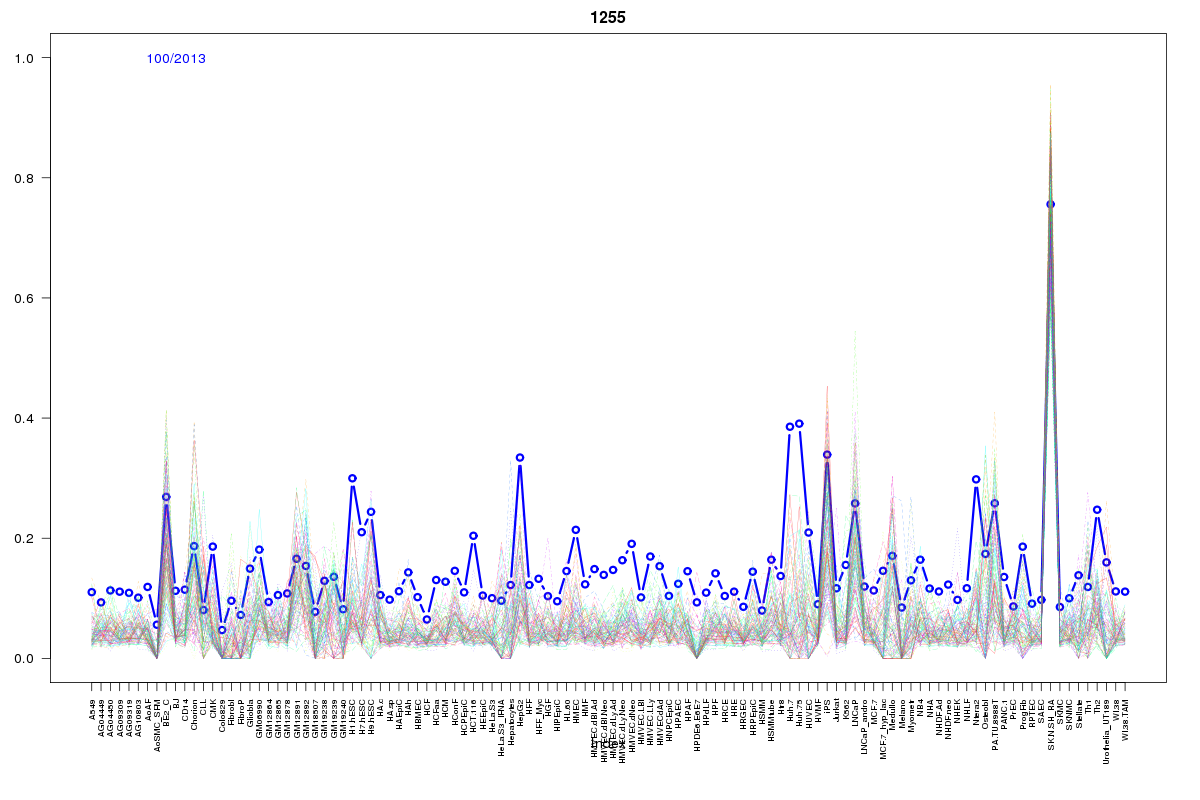 | 1255 | 1 |
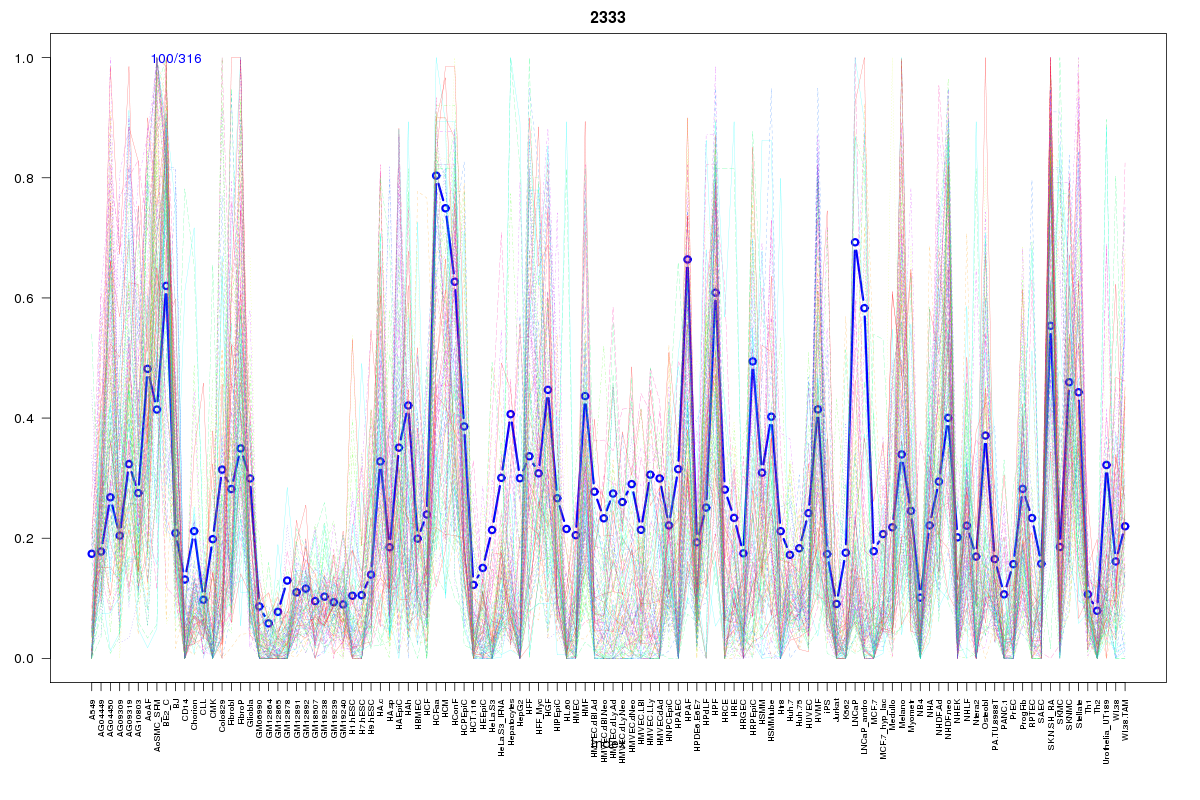 | 2333 | 1 |
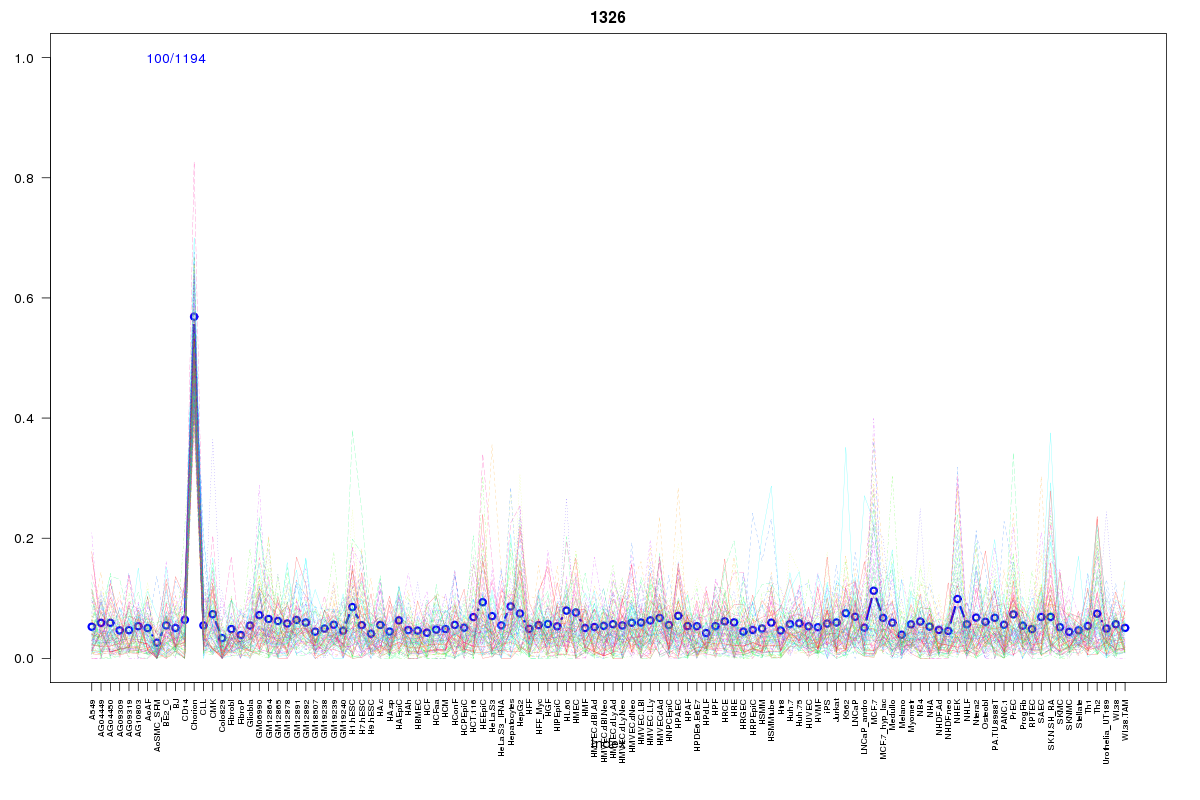 | 1326 | 1 |
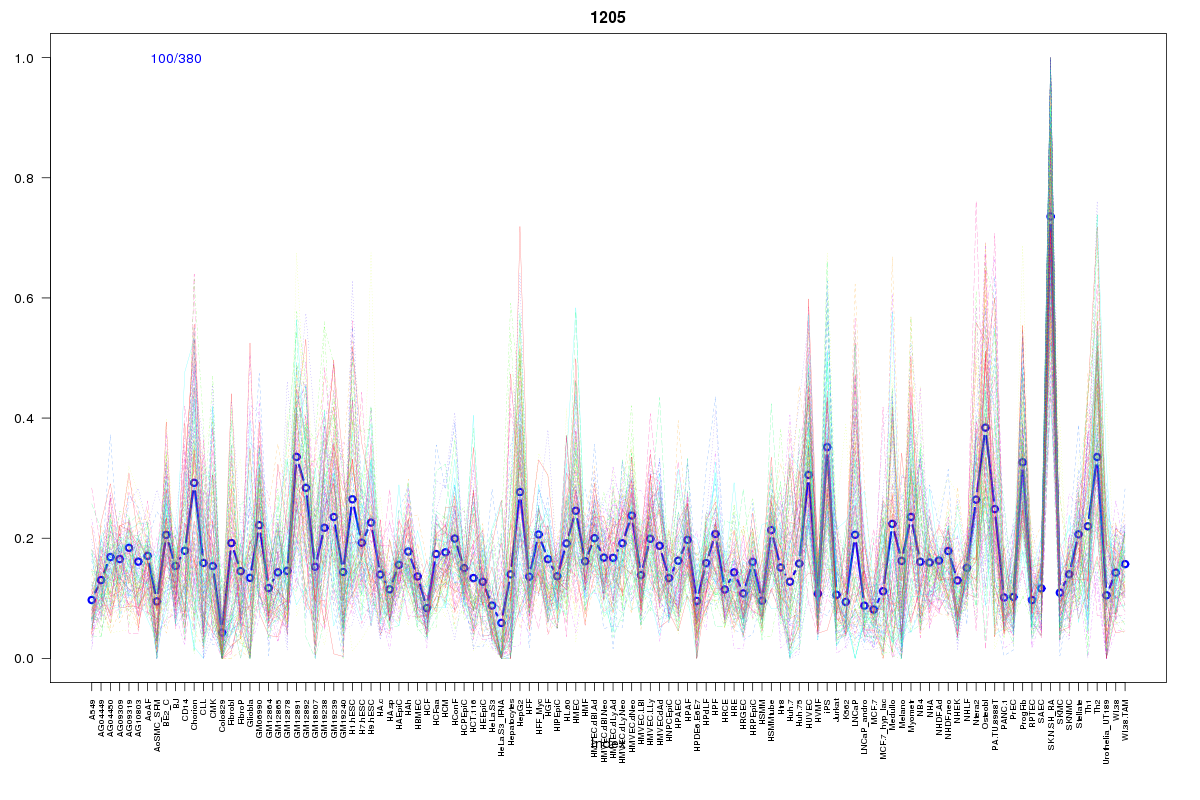 | 1205 | 1 |
Resources
BED file downloads
Connects to 79 DHS sitesTop 10 Correlated DHS Sites
p-values indiciate significant higher or lower correlationExternal Databases
UCSCEnsembl (ENSG00000130595)