Gene: POMT1
chr9: 134378288-134399193Expression Profile
(log scale)
Graphical Connections
Distribution of linked clusters:
You may find it interesting if many of the connected DHS sites belong to the same cluster.| Cluster Profile | Cluster ID | Number of DHS sites in this cluster |
|---|---|---|
 | 2110 | 4 |
 | 2055 | 3 |
 | 626 | 3 |
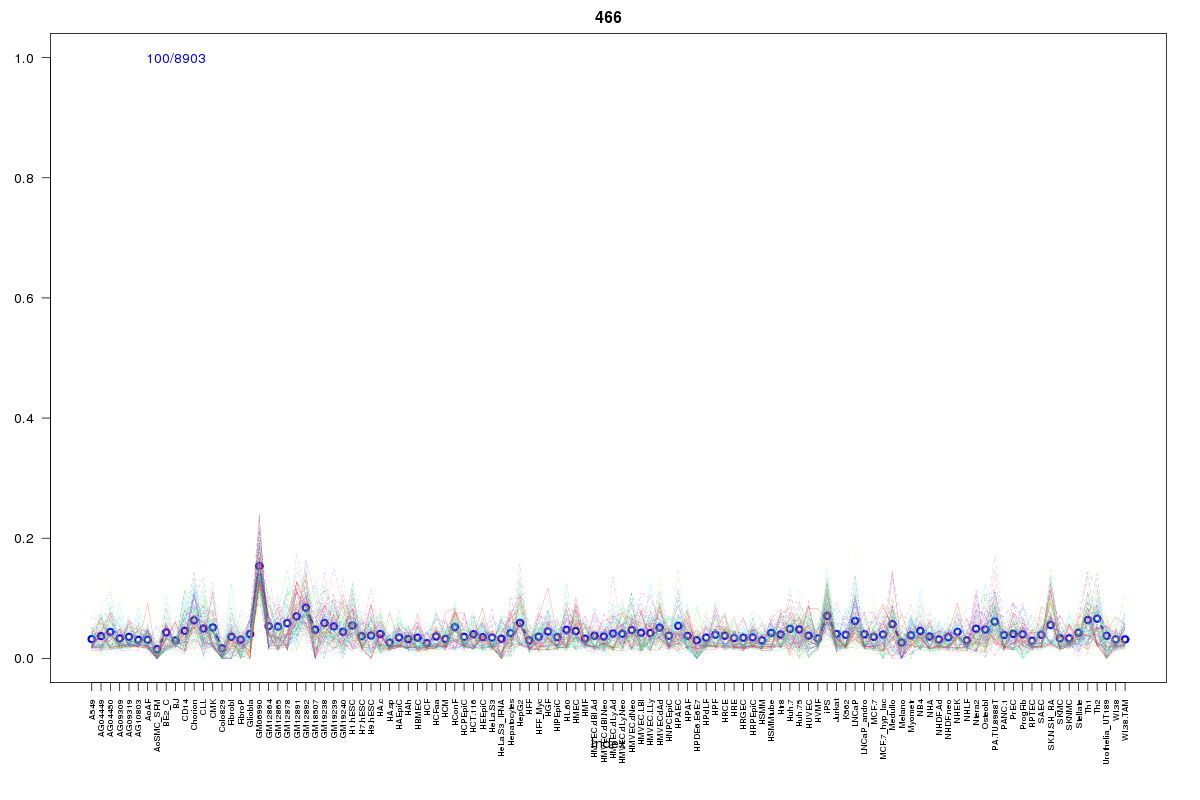 | 466 | 3 |
 | 2114 | 3 |
 | 2052 | 2 |
 | 2170 | 2 |
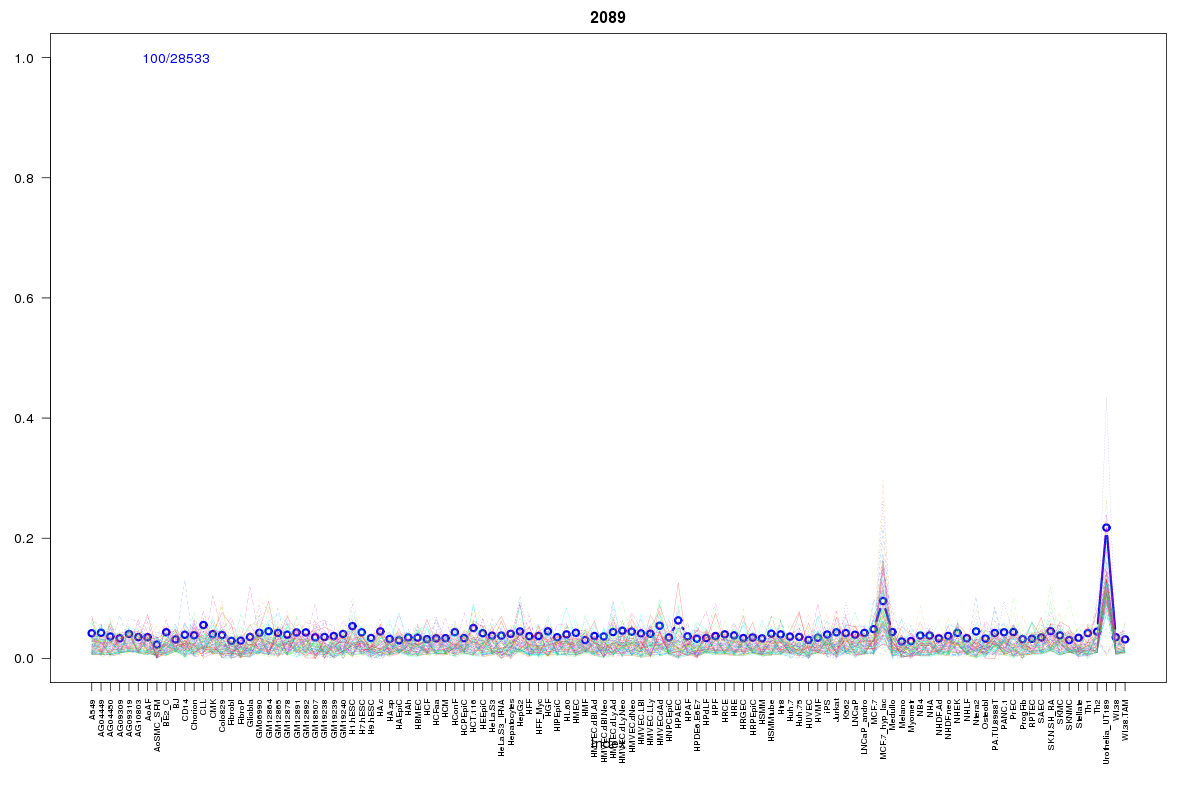 | 2089 | 2 |
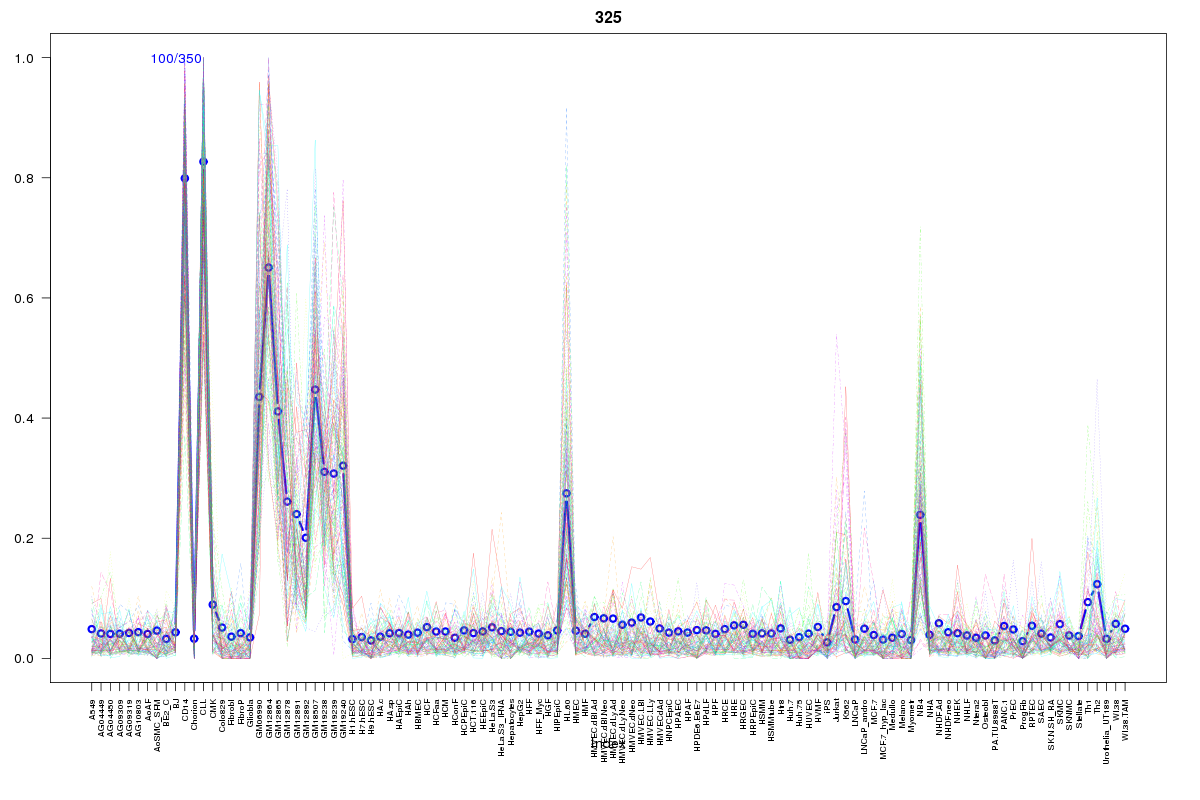 | 325 | 1 |
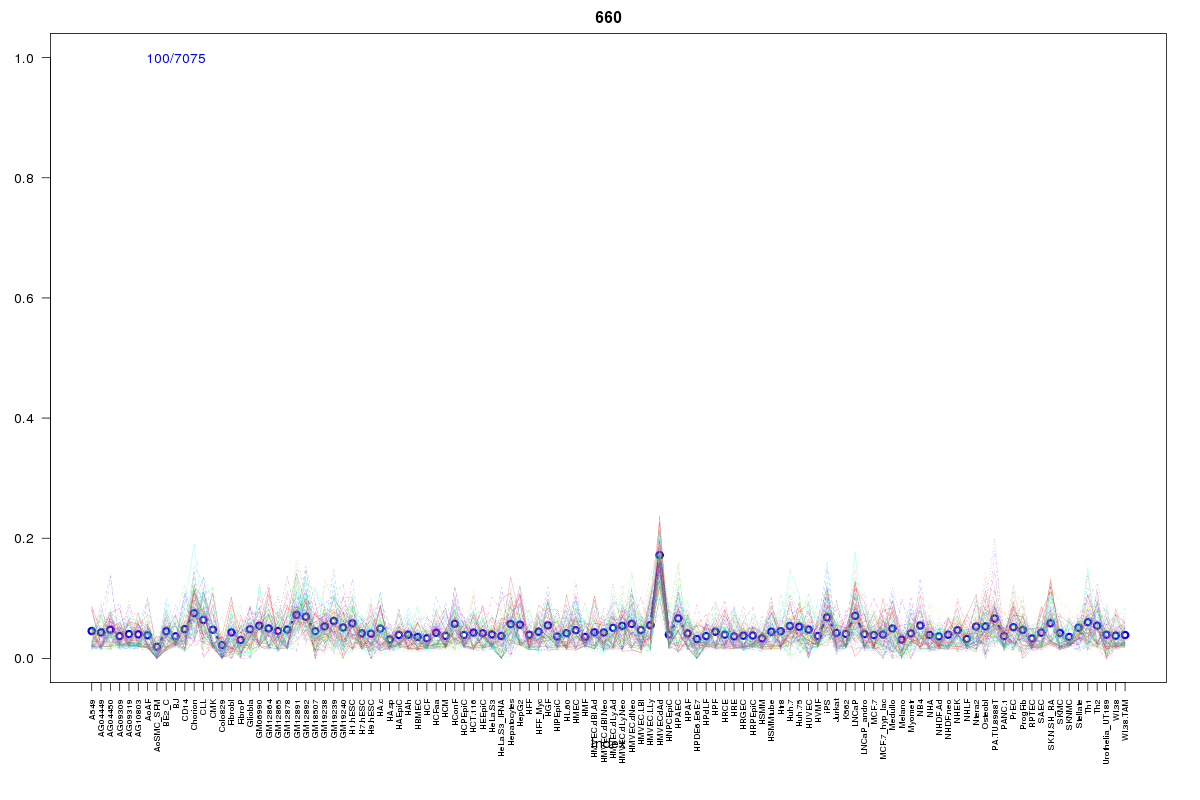 | 660 | 1 |
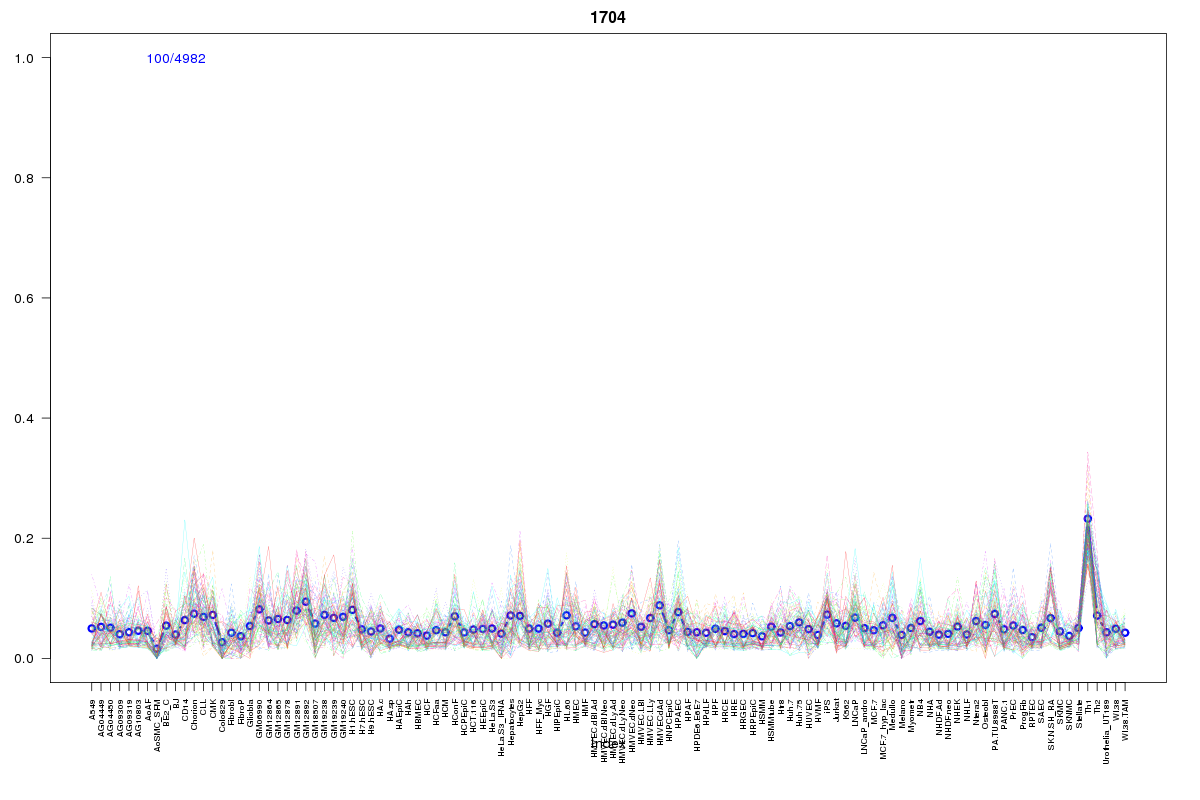 | 1704 | 1 |
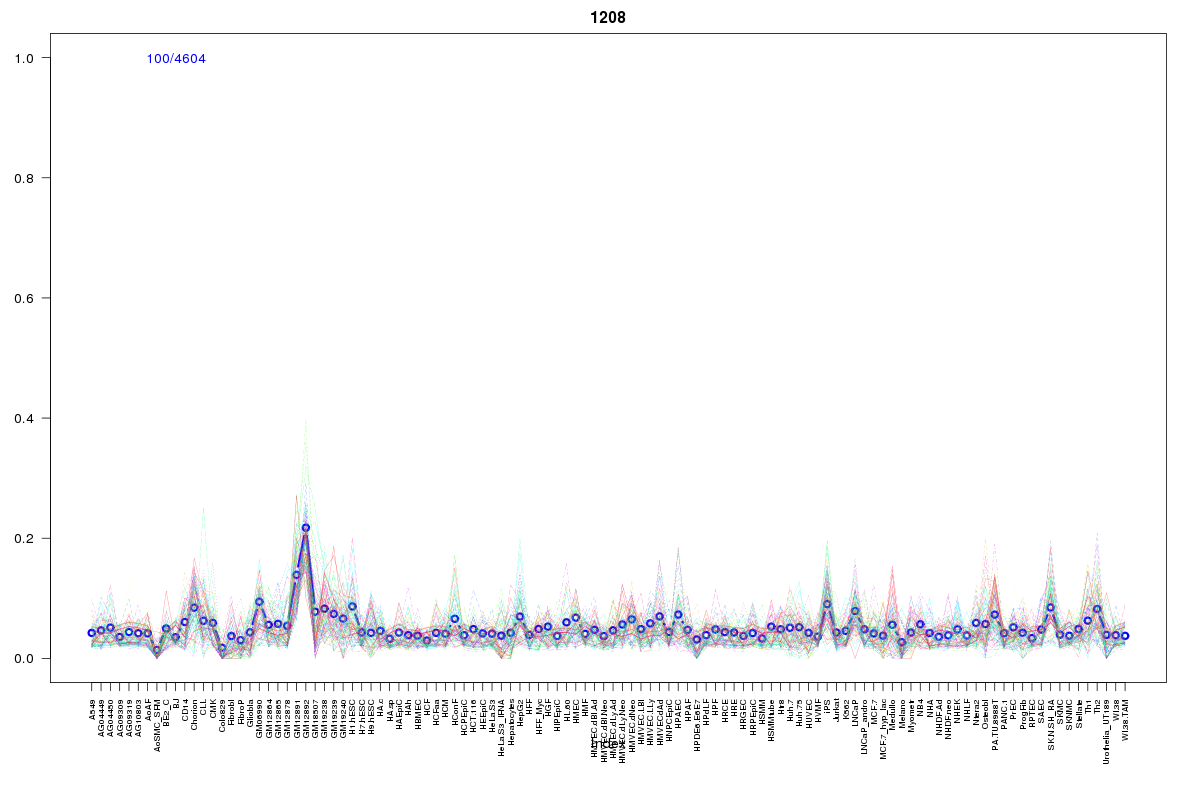 | 1208 | 1 |
 | 1008 | 1 |
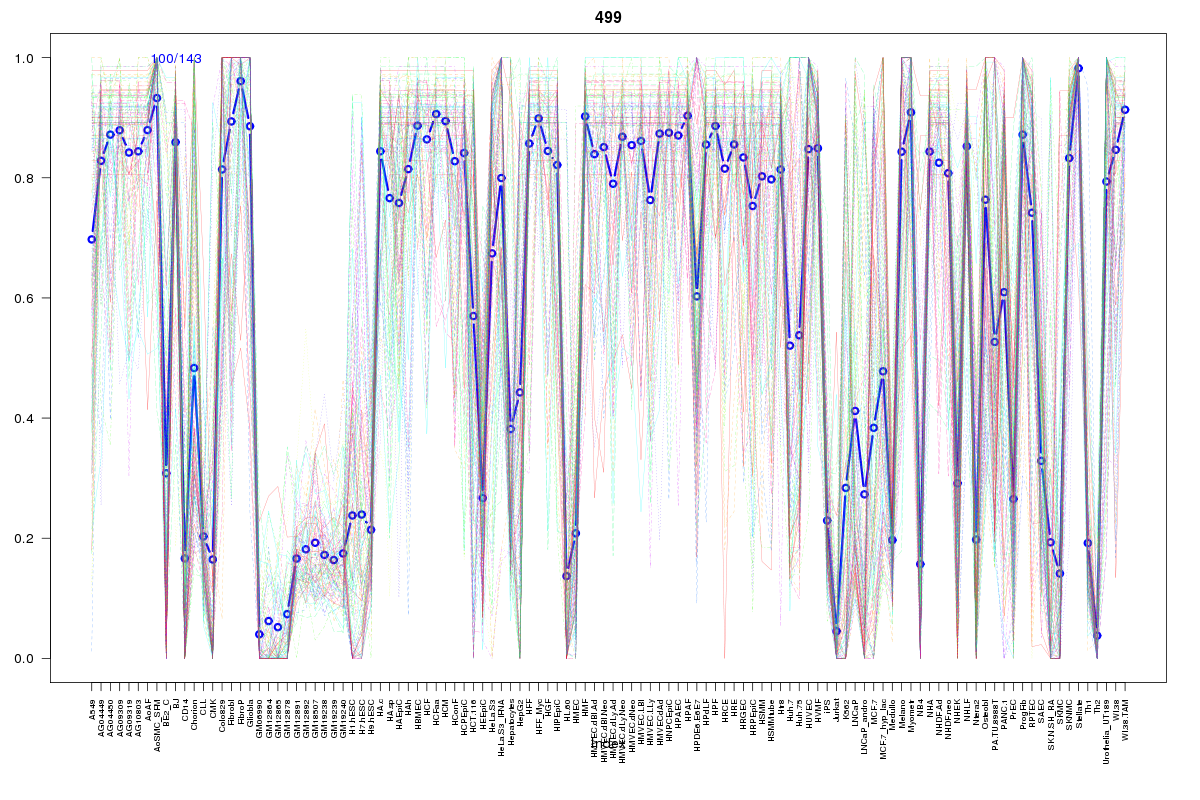 | 499 | 1 |
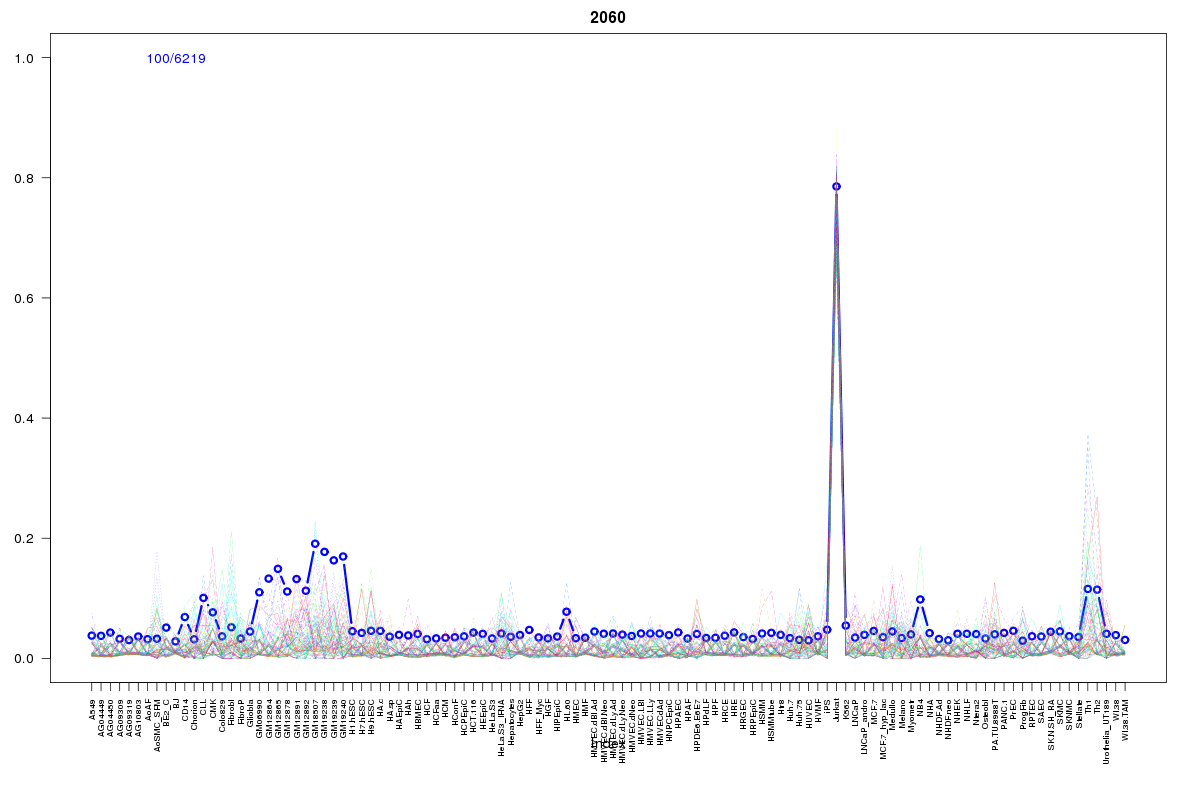 | 2060 | 1 |
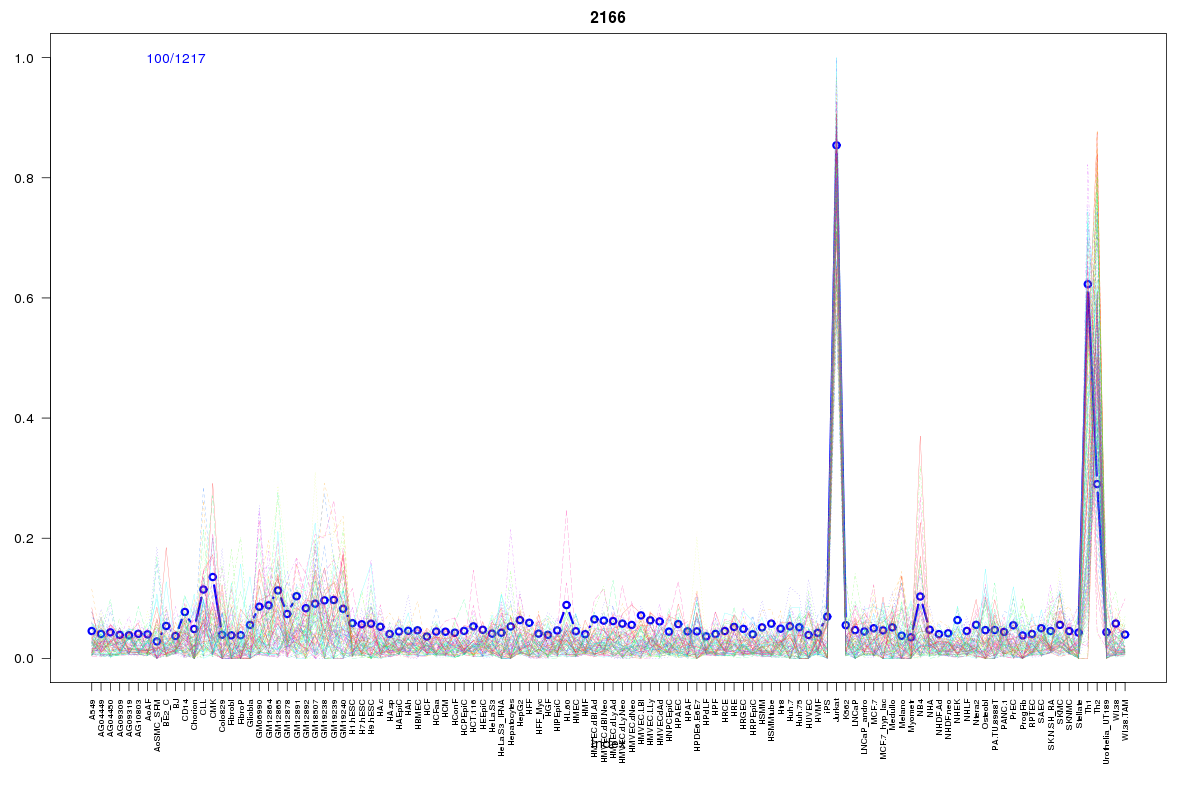 | 2166 | 1 |
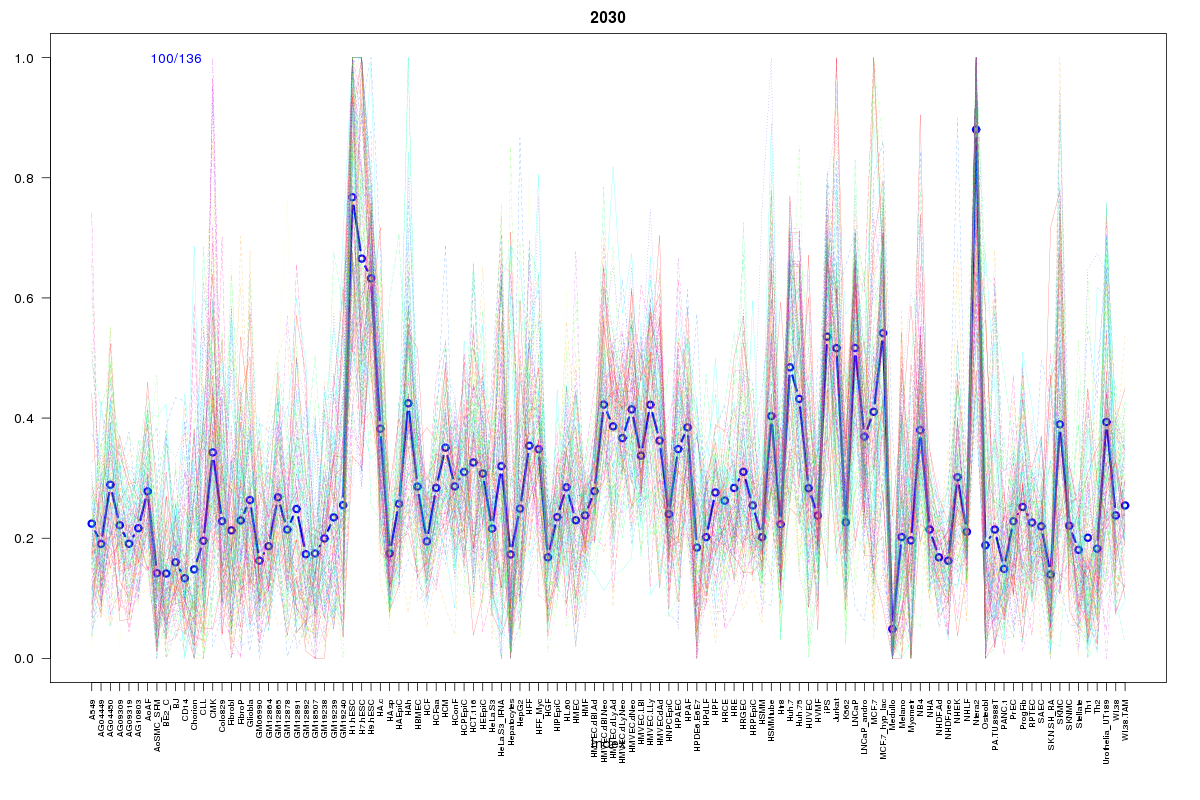 | 2030 | 1 |
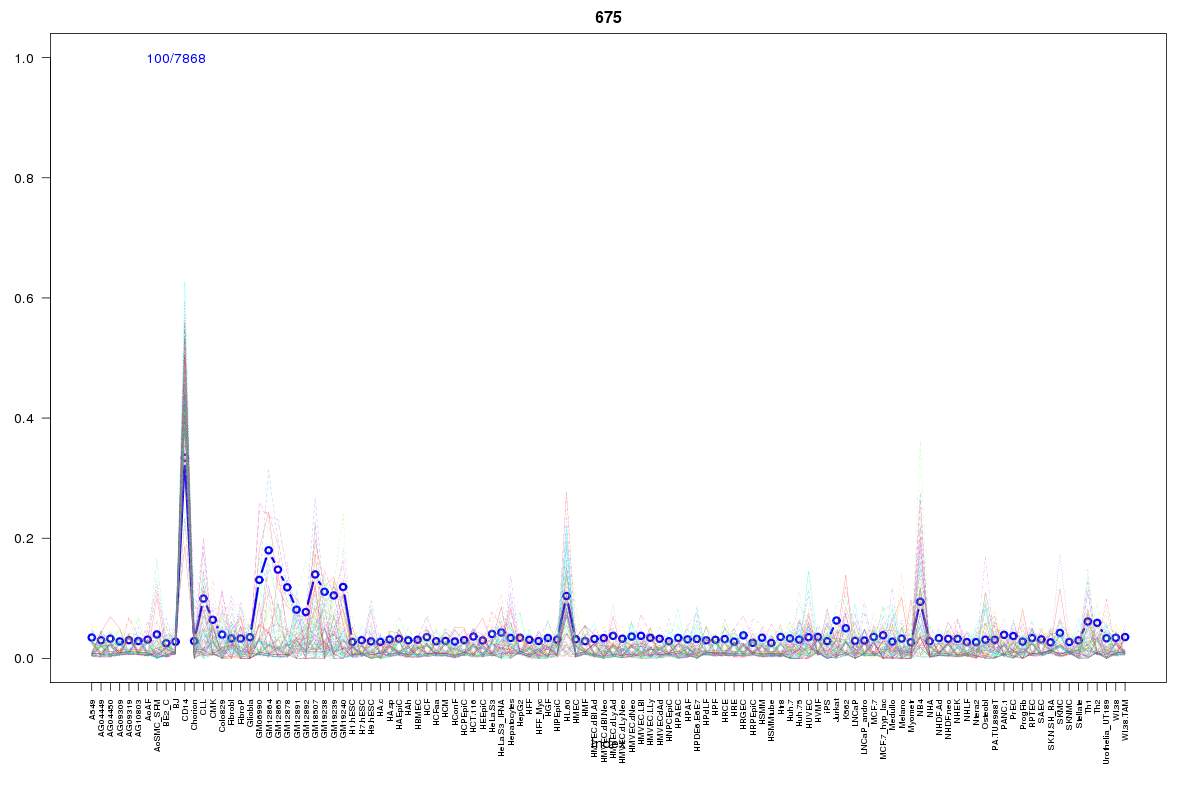 | 675 | 1 |
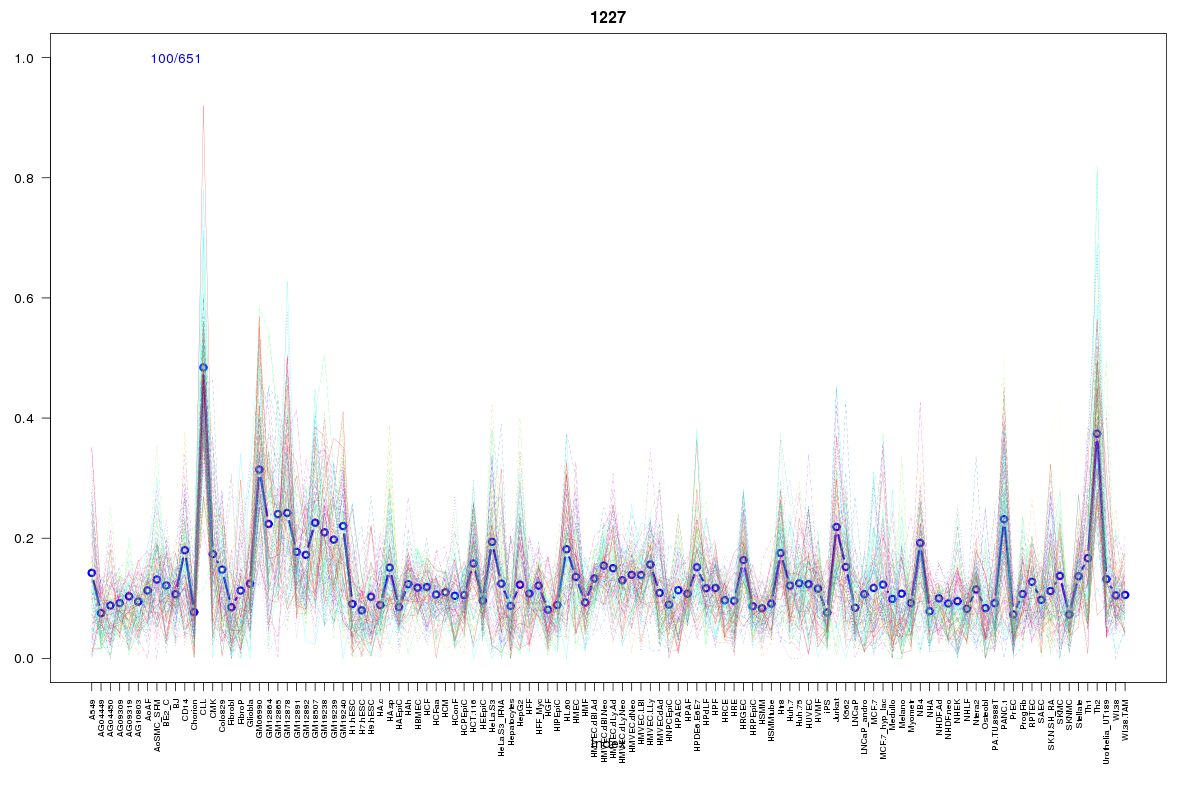 | 1227 | 1 |
 | 570 | 1 |
Resources
BED file downloads
Connects to 34 DHS sitesTop 10 Correlated DHS Sites
p-values indiciate significant higher or lower correlation| Location | Cluster | P-value |
|---|---|---|
| chr9:134283340-134283490 | 2030 | 0 |
| chr9:134375800-134375950 | 2170 | 0 |
| chr9:134373880-134374030 | 2110 | 0.001 |
| chr9:134376000-134376150 | 2170 | 0.001 |
| chr9:134371385-134371535 | 1704 | 0.001 |
| chr9:134410920-134411070 | 2114 | 0.004 |
| chr9:134278240-134278390 | 499 | 0.004 |
| chr9:134281660-134281810 | 2166 | 0.007 |
| chr9:134419545-134419695 | 2052 | 0.01 |
| chr9:134304700-134304850 | 2114 | 0.01 |
| chr9:134415040-134415190 | 2060 | 0.011 |
External Databases
UCSCEnsembl (ENSG00000130714)