Gene: TSPAN31
chr12: 58131795-58140845Expression Profile
(log scale)
Graphical Connections
Distribution of linked clusters:
You may find it interesting if many of the connected DHS sites belong to the same cluster.| Cluster Profile | Cluster ID | Number of DHS sites in this cluster |
|---|---|---|
 | 430 | 2 |
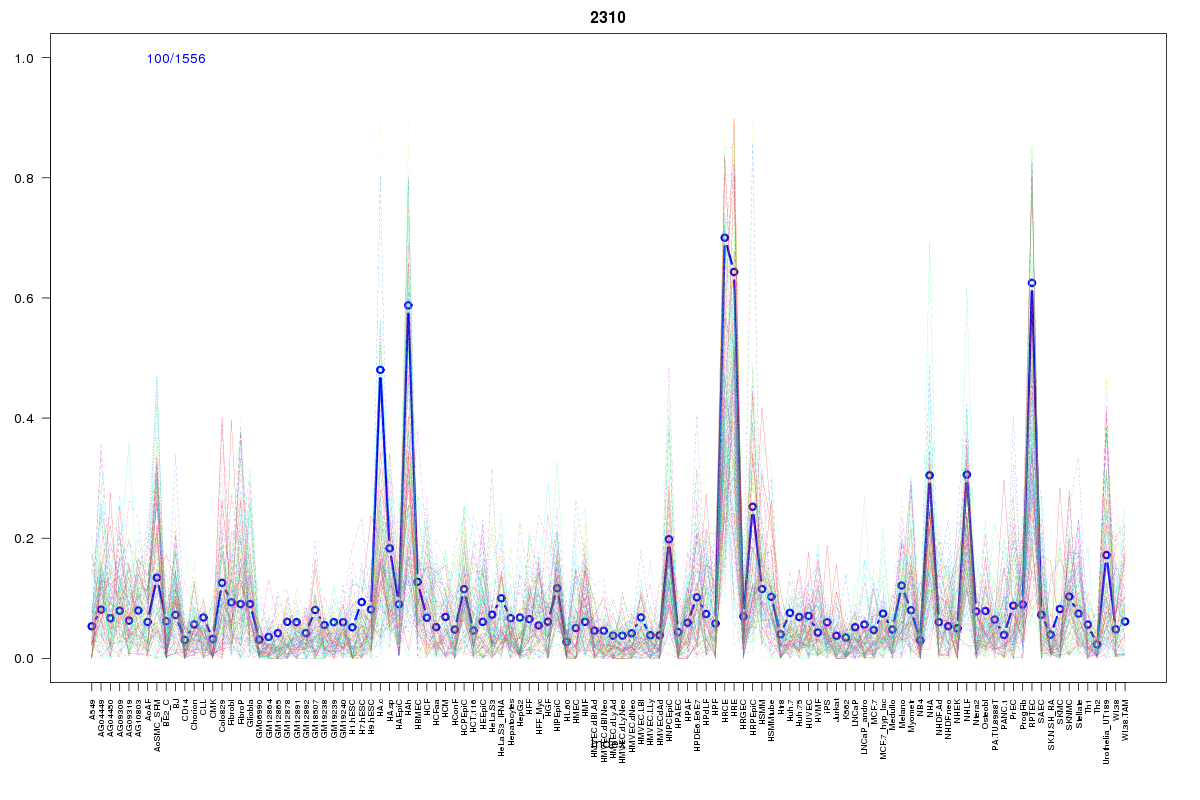 | 2310 | 1 |
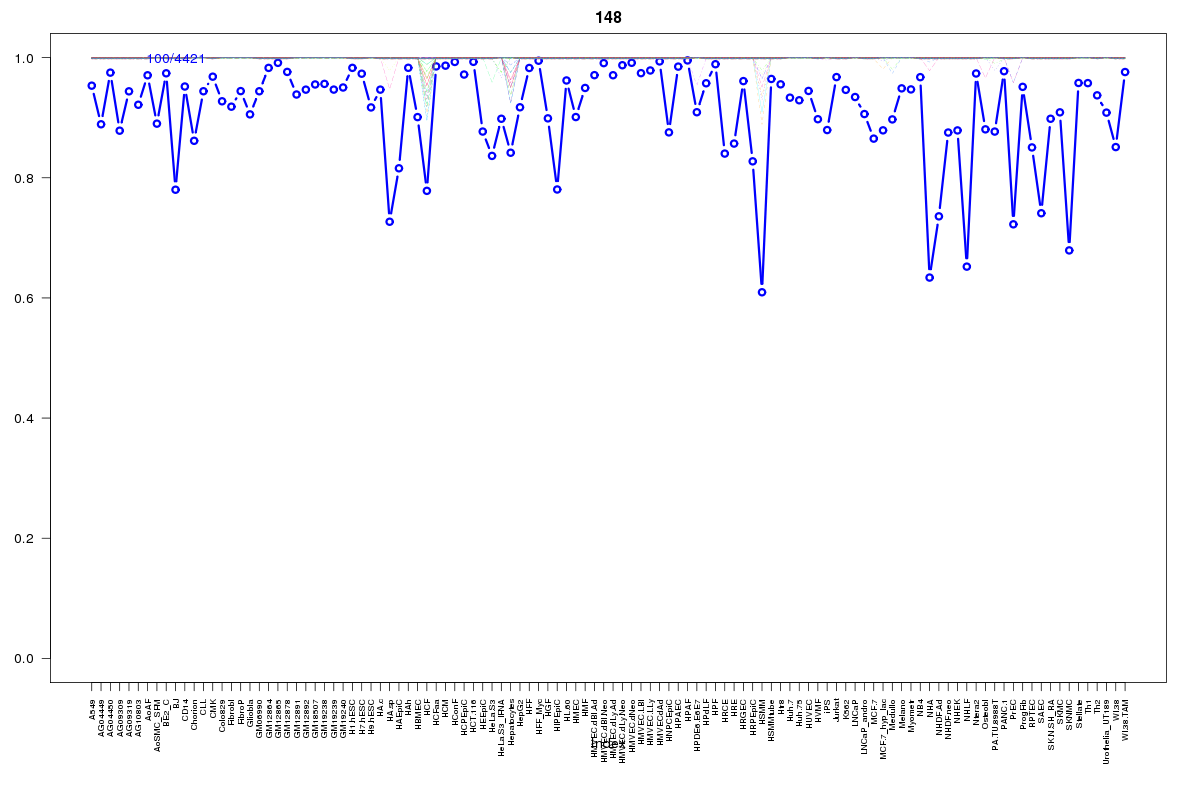 | 148 | 1 |
 | 2114 | 1 |
 | 10 | 1 |
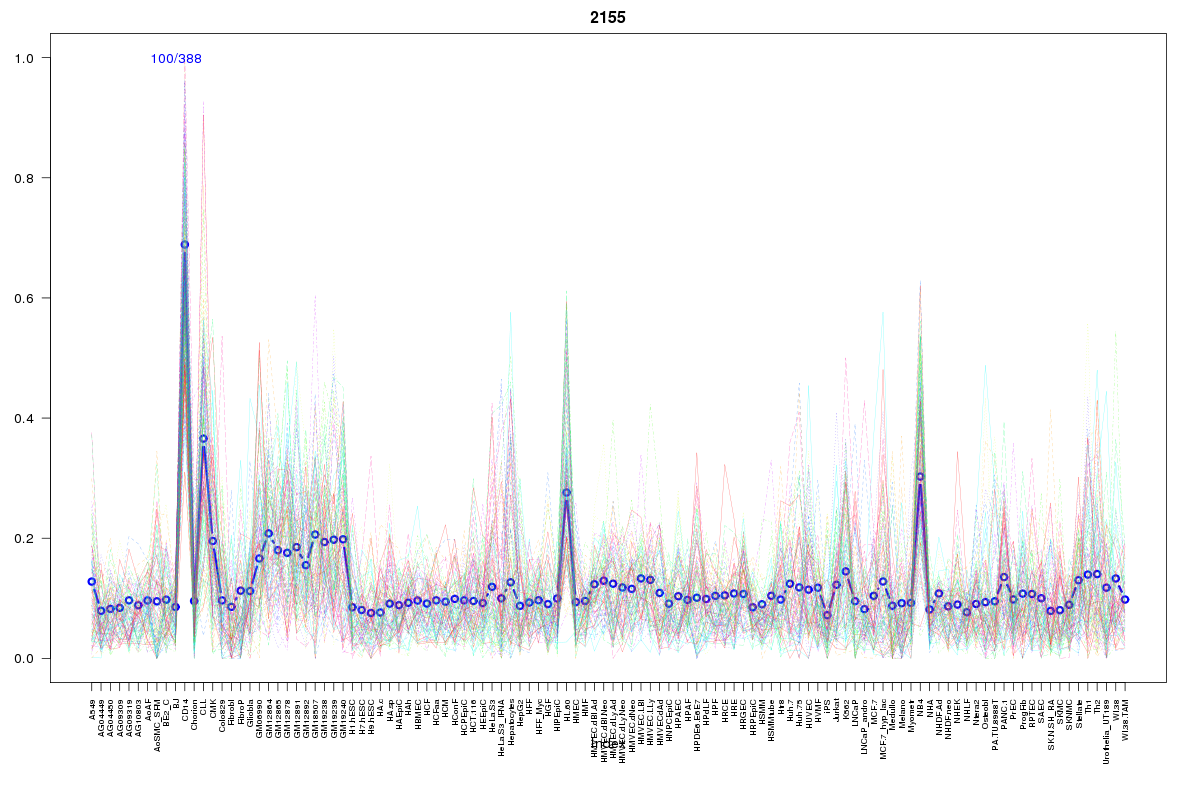 | 2155 | 1 |
 | 2110 | 1 |
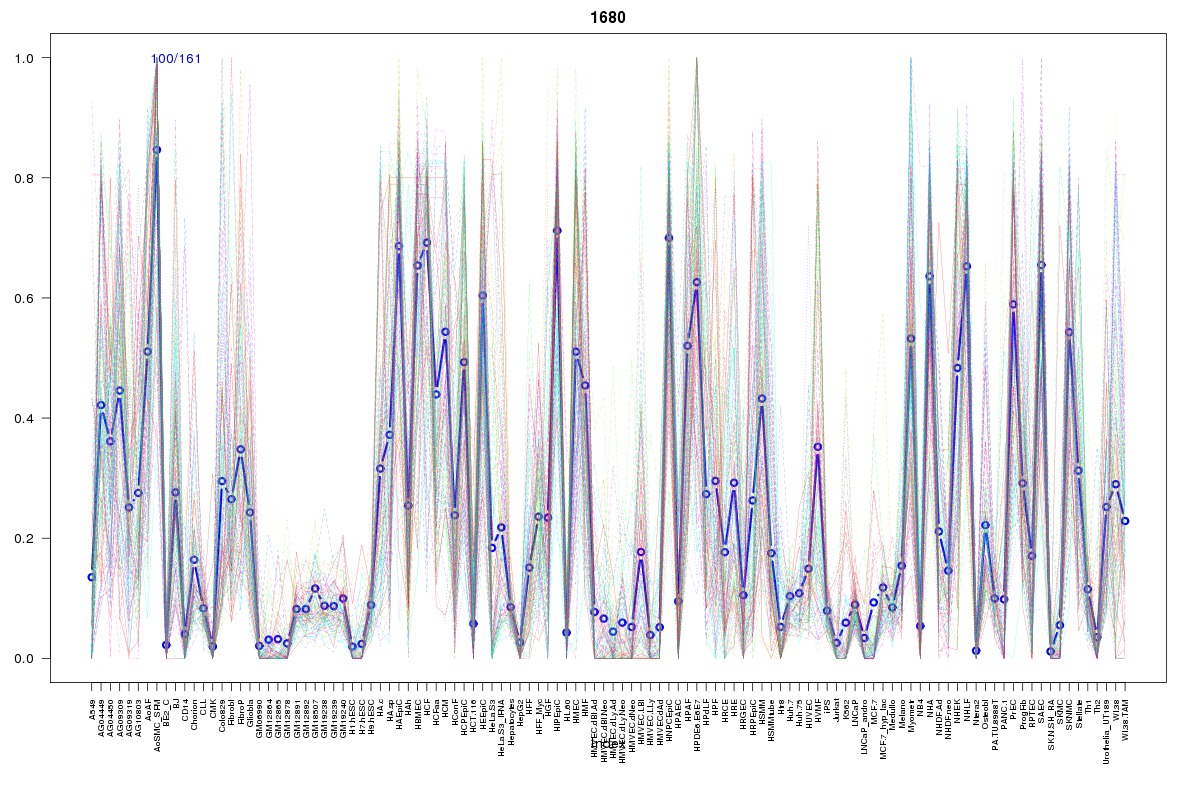 | 1680 | 1 |
 | 615 | 1 |
 | 568 | 1 |
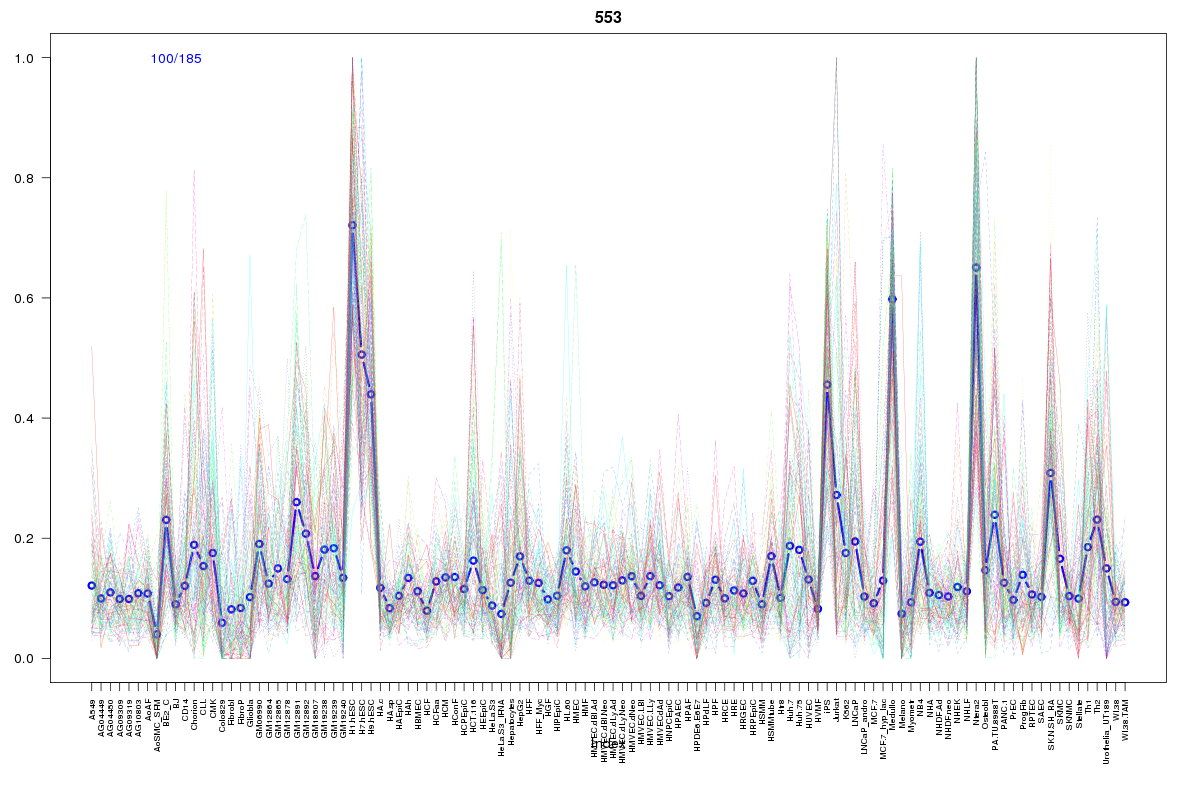 | 553 | 1 |
Resources
BED file downloads
Connects to 12 DHS sitesTop 10 Correlated DHS Sites
p-values indiciate significant higher or lower correlation| Location | Cluster | P-value |
|---|---|---|
| chr12:58138660-58138810 | 148 | 0 |
| chr12:58187780-58187930 | 1680 | 0.001 |
| chr12:58051700-58051850 | 2310 | 0.018 |
| chr12:58136260-58136410 | 430 | 0.024 |
| chr12:58140560-58140710 | 10 | 0.024 |
| chr12:58165240-58165390 | 2155 | 0.023 |
| chr12:58175660-58175810 | 2110 | 0.015 |
| chr12:58210160-58210310 | 615 | 0.014 |
| chr12:58236440-58236590 | 553 | 0.008 |
| chr12:58175180-58175330 | 430 | 0.007 |
| chr12:58140380-58140530 | 2114 | 0.002 |
External Databases
UCSCEnsembl (ENSG00000135452)