Gene: SLC26A10
chr12: 58013309-58019923Expression Profile
(log scale)
Graphical Connections
Distribution of linked clusters:
You may find it interesting if many of the connected DHS sites belong to the same cluster.| Cluster Profile | Cluster ID | Number of DHS sites in this cluster |
|---|---|---|
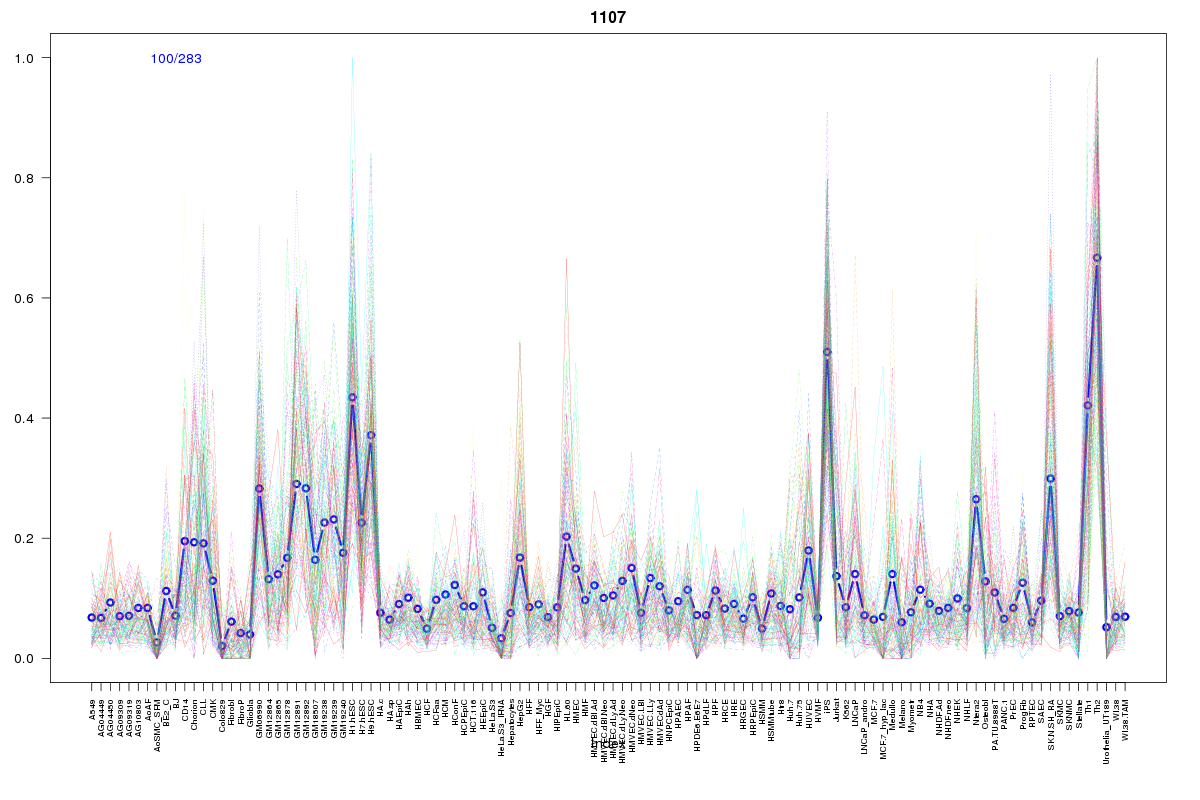 | 1107 | 2 |
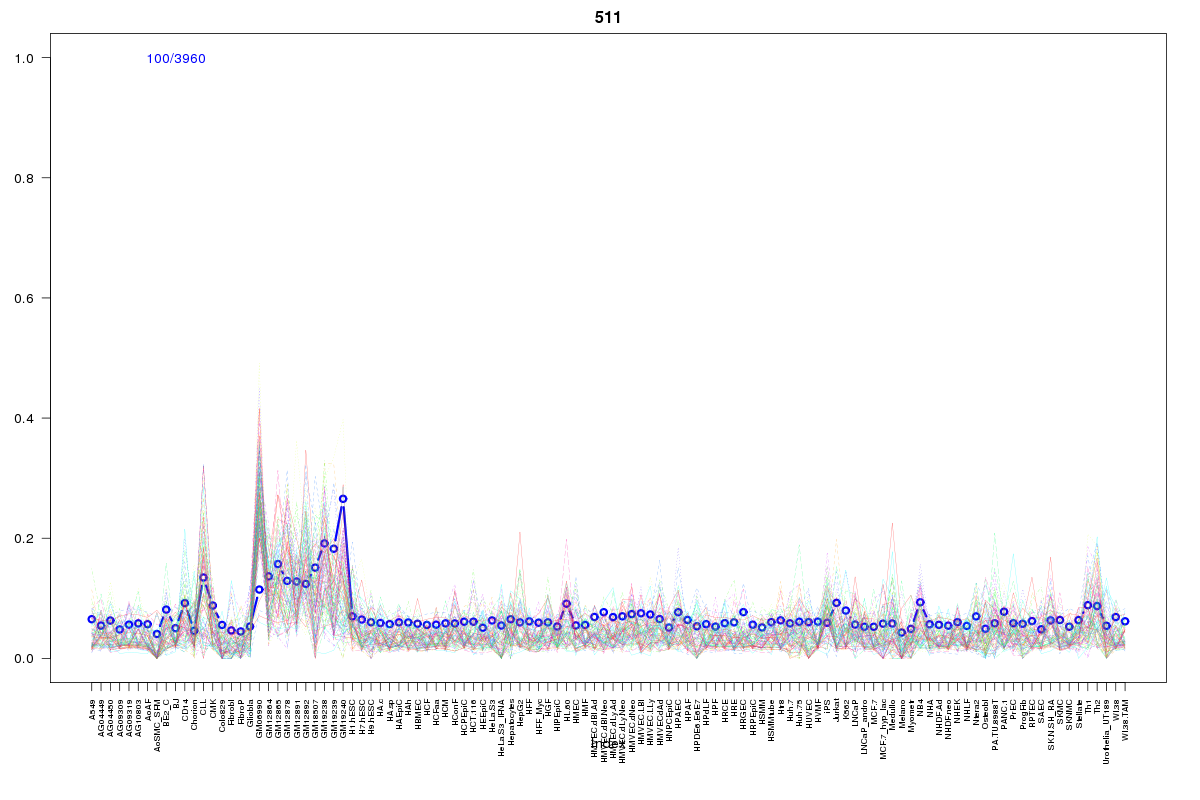 | 511 | 2 |
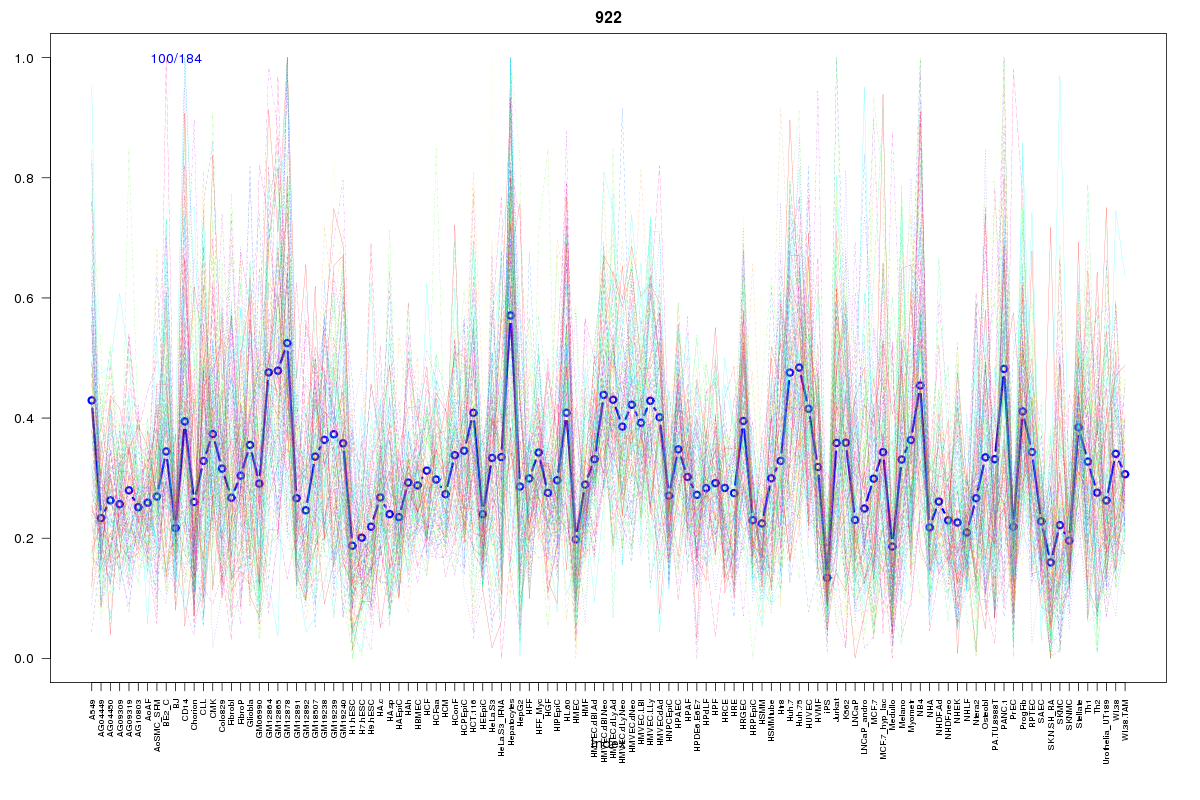 | 922 | 1 |
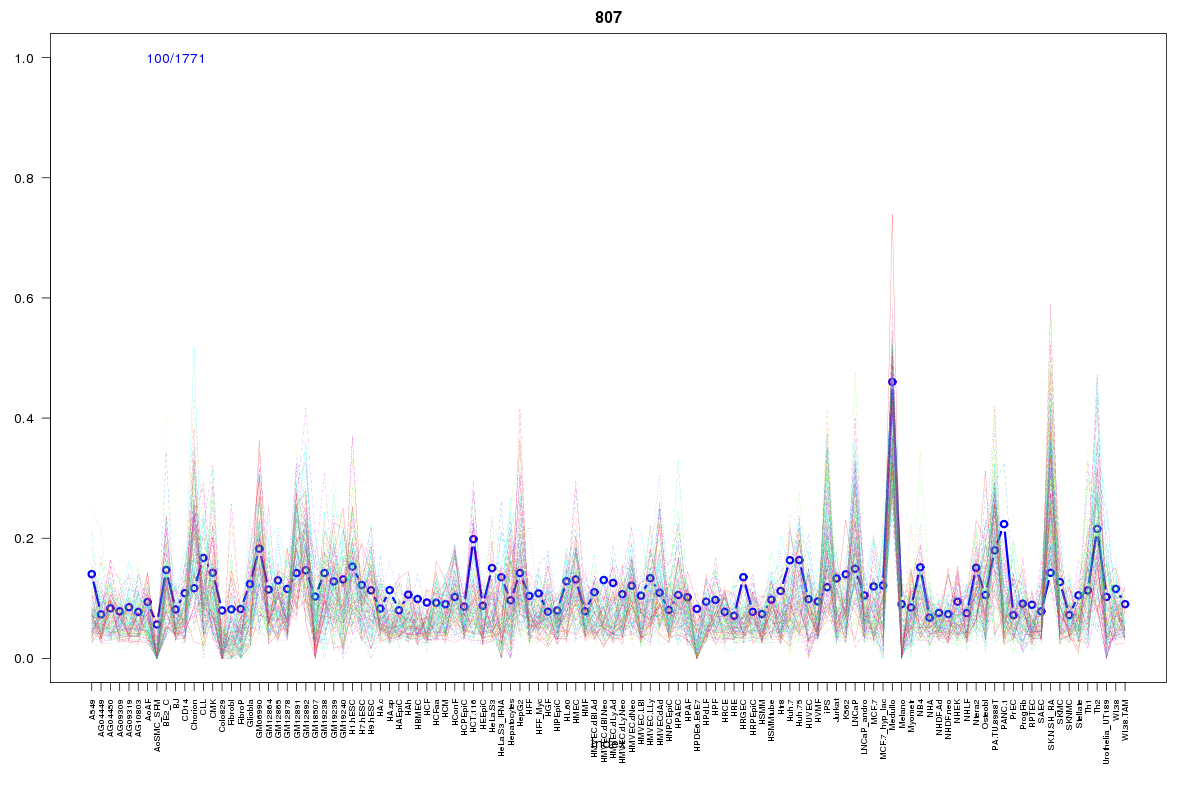 | 807 | 1 |
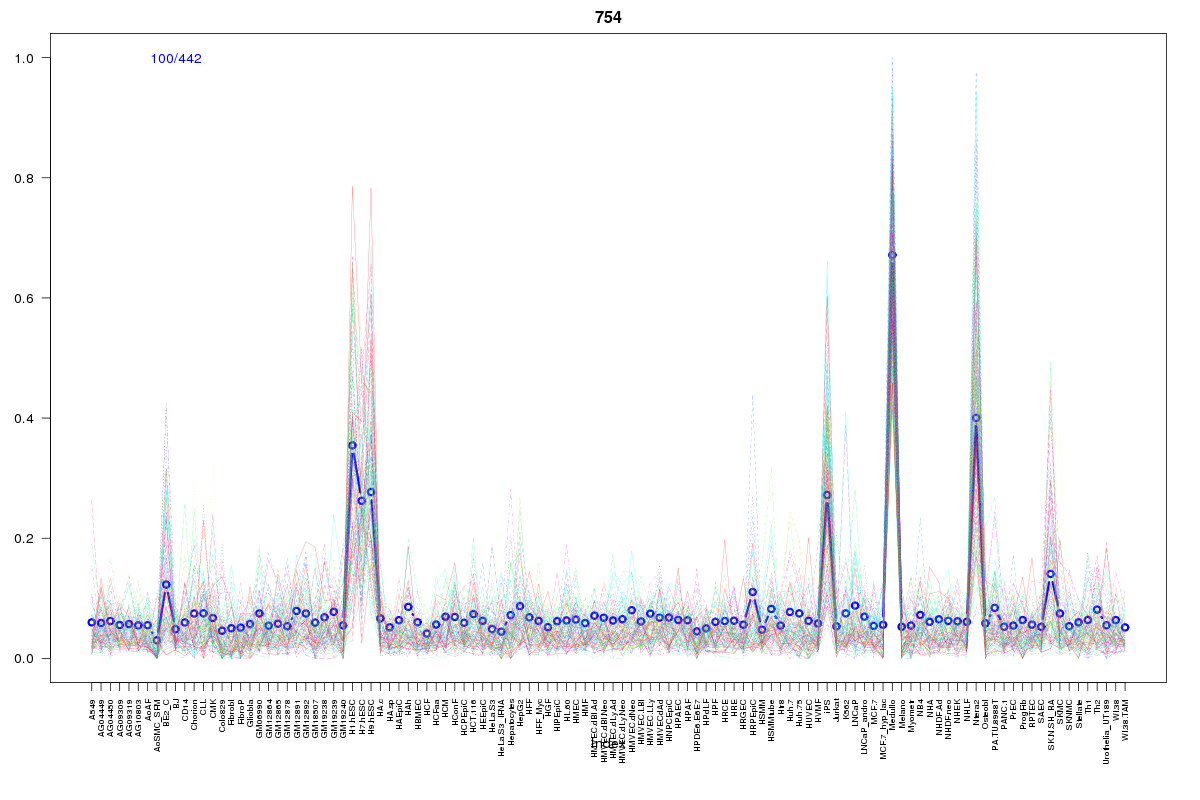 | 754 | 1 |
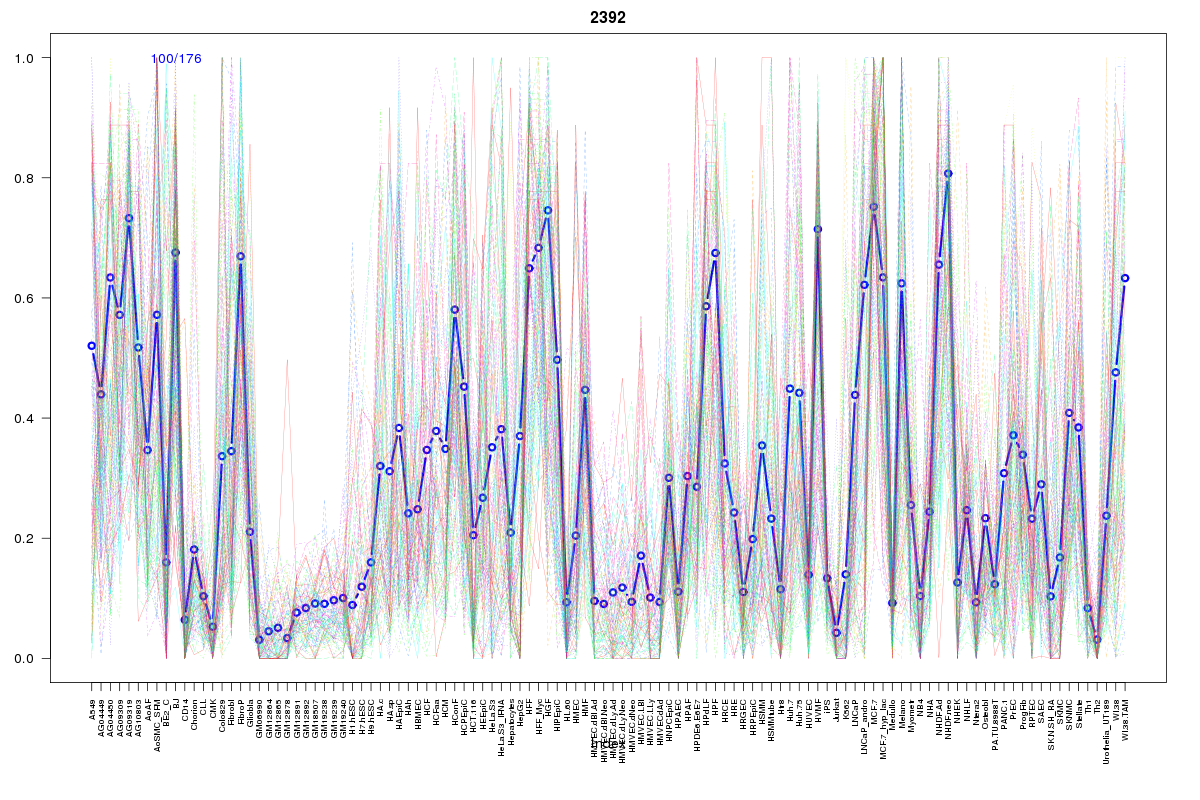 | 2392 | 1 |
 | 2279 | 1 |
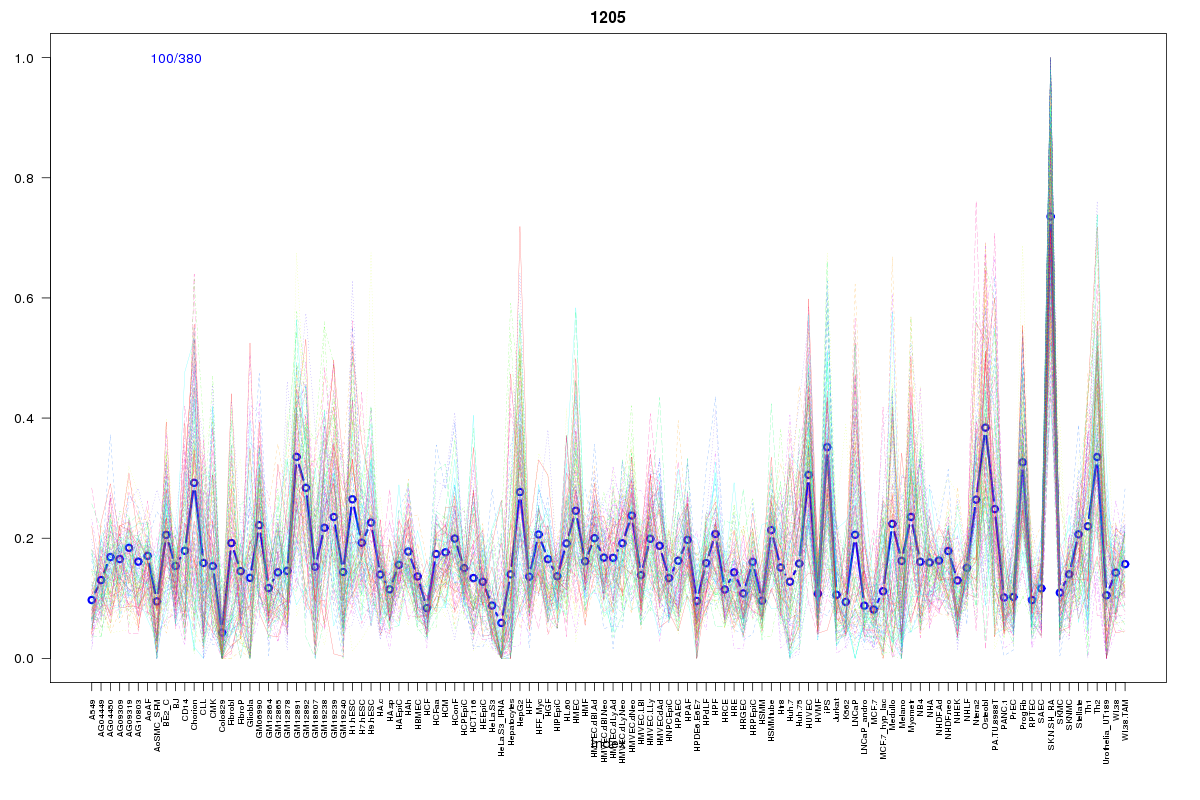 | 1205 | 1 |
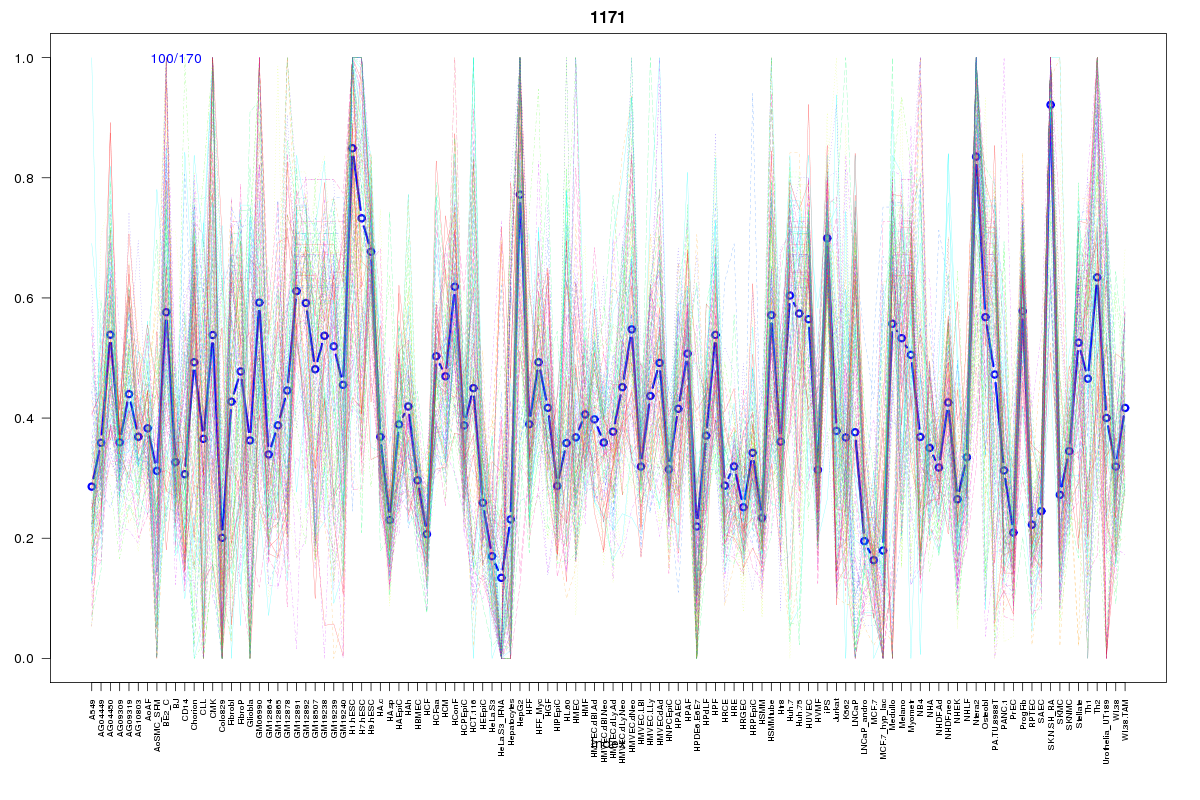 | 1171 | 1 |
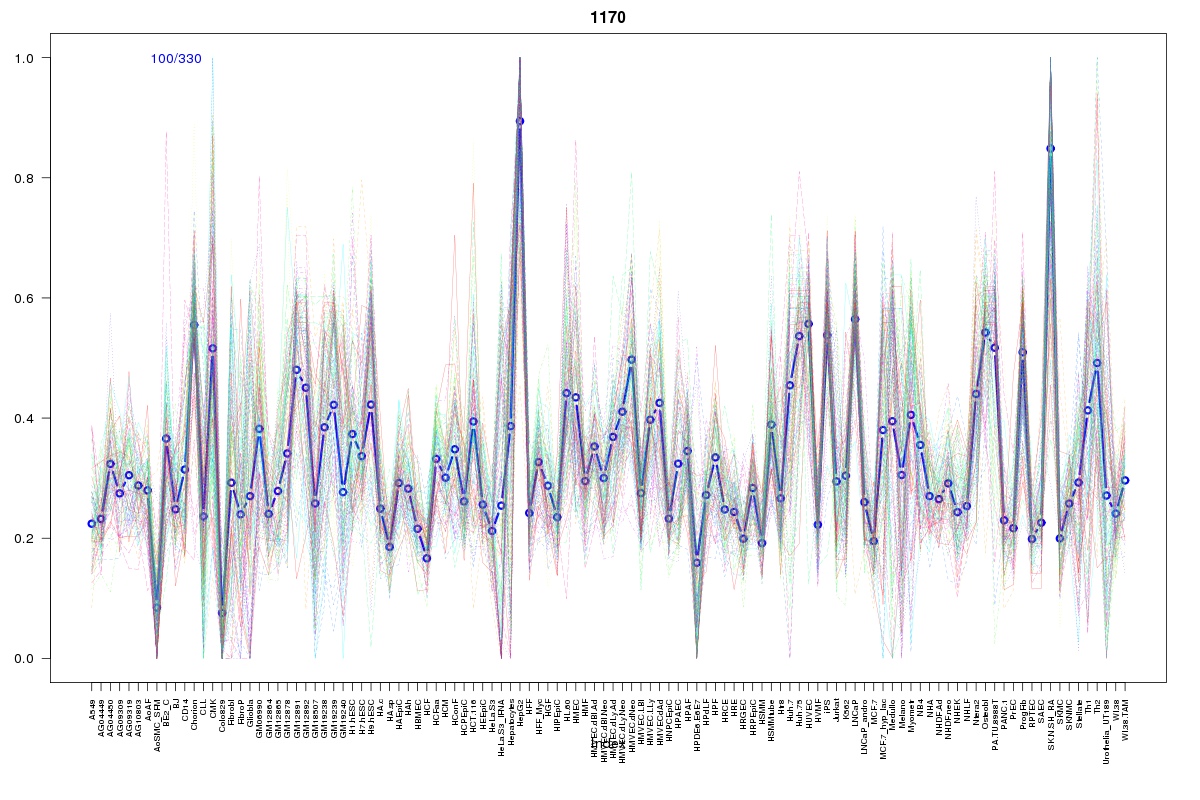 | 1170 | 1 |
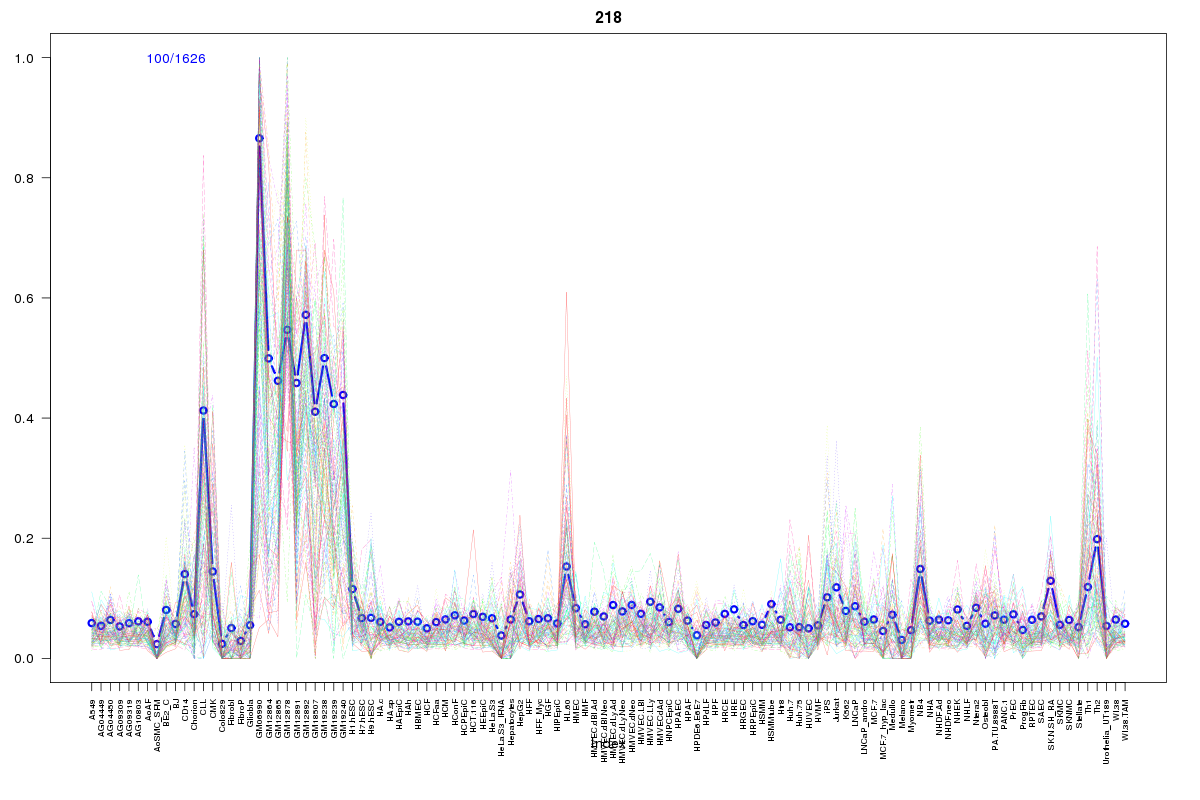 | 218 | 1 |
 | 2122 | 1 |
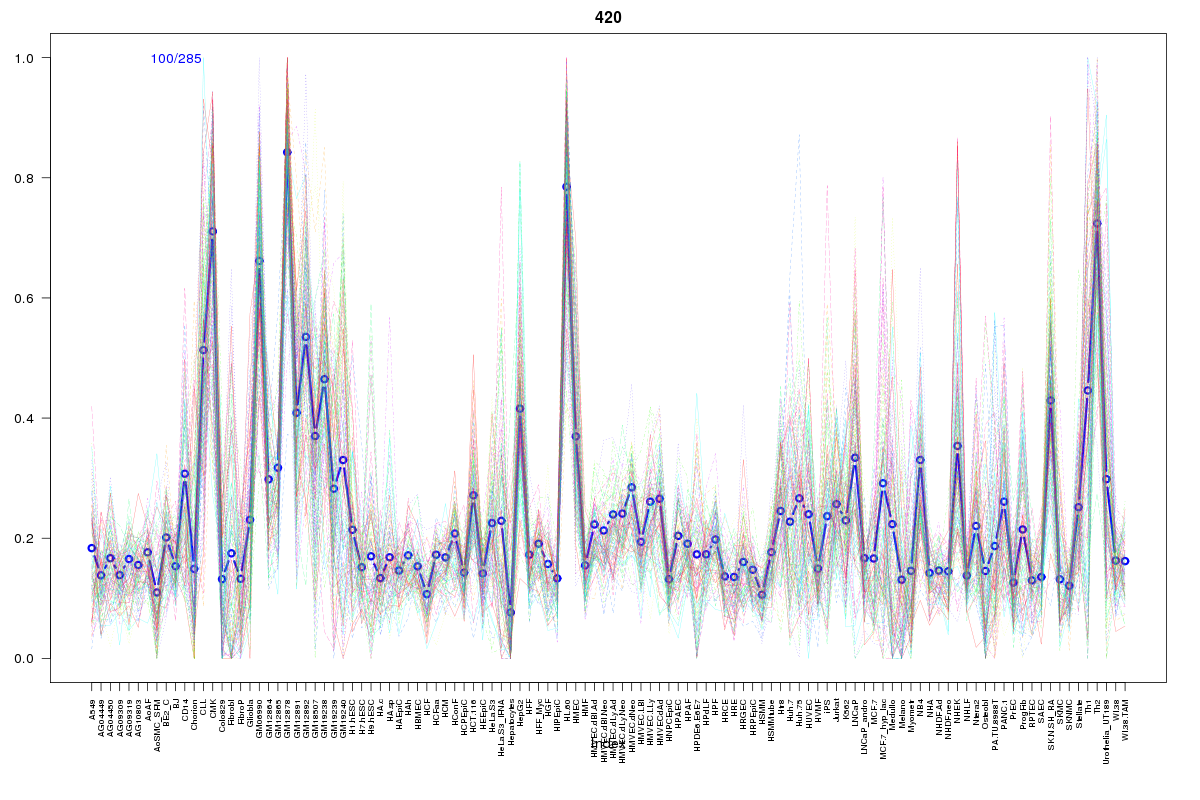 | 420 | 1 |
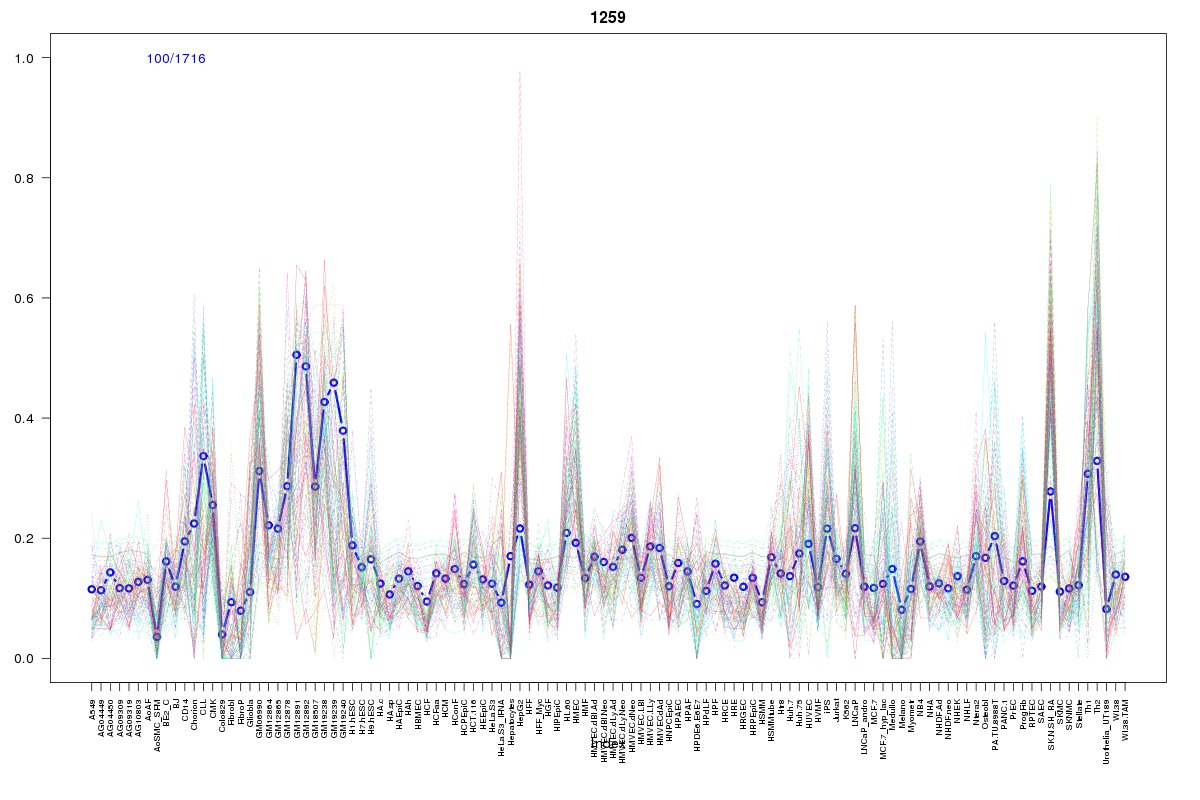 | 1259 | 1 |
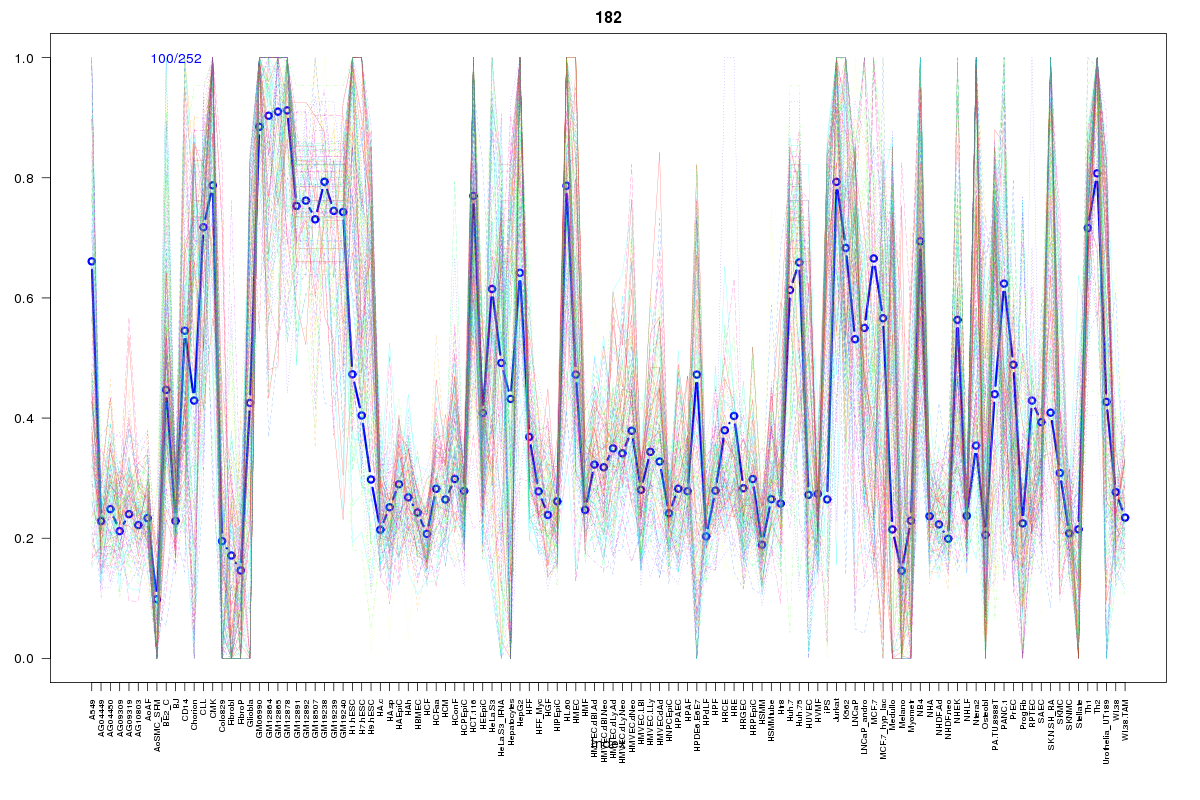 | 182 | 1 |
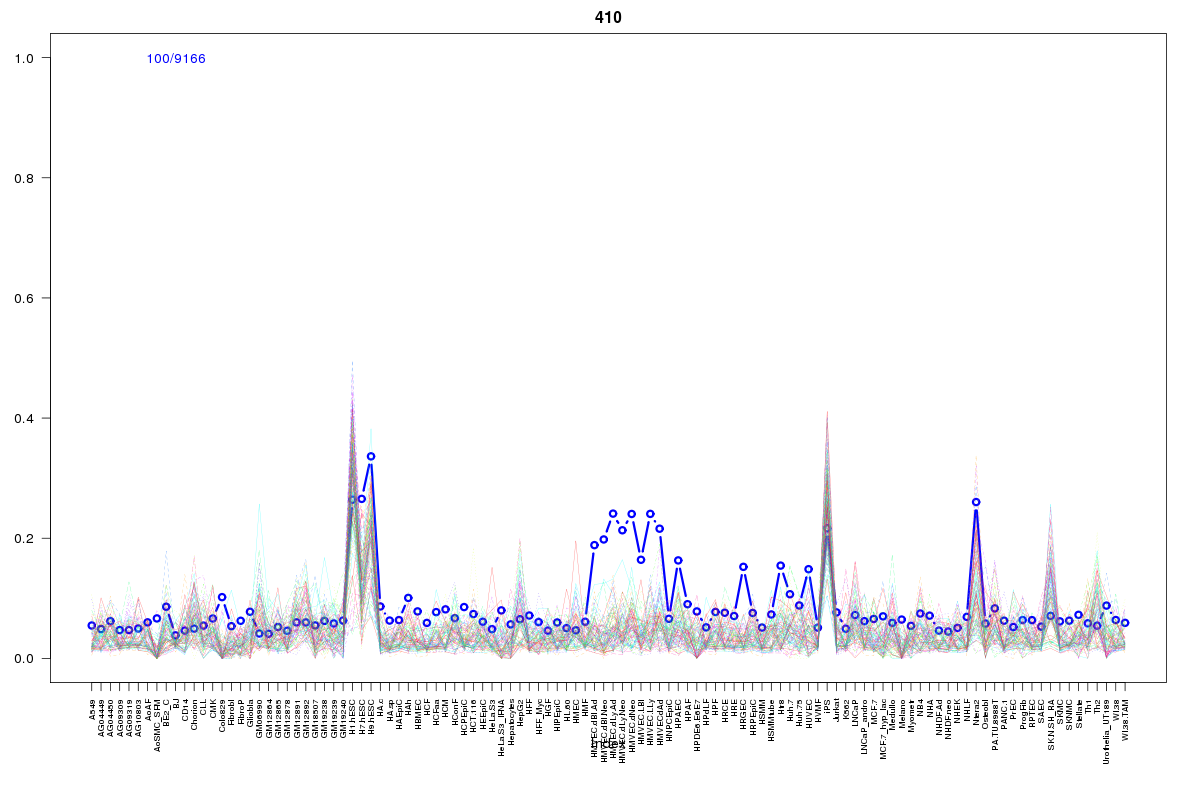 | 410 | 1 |
 | 978 | 1 |
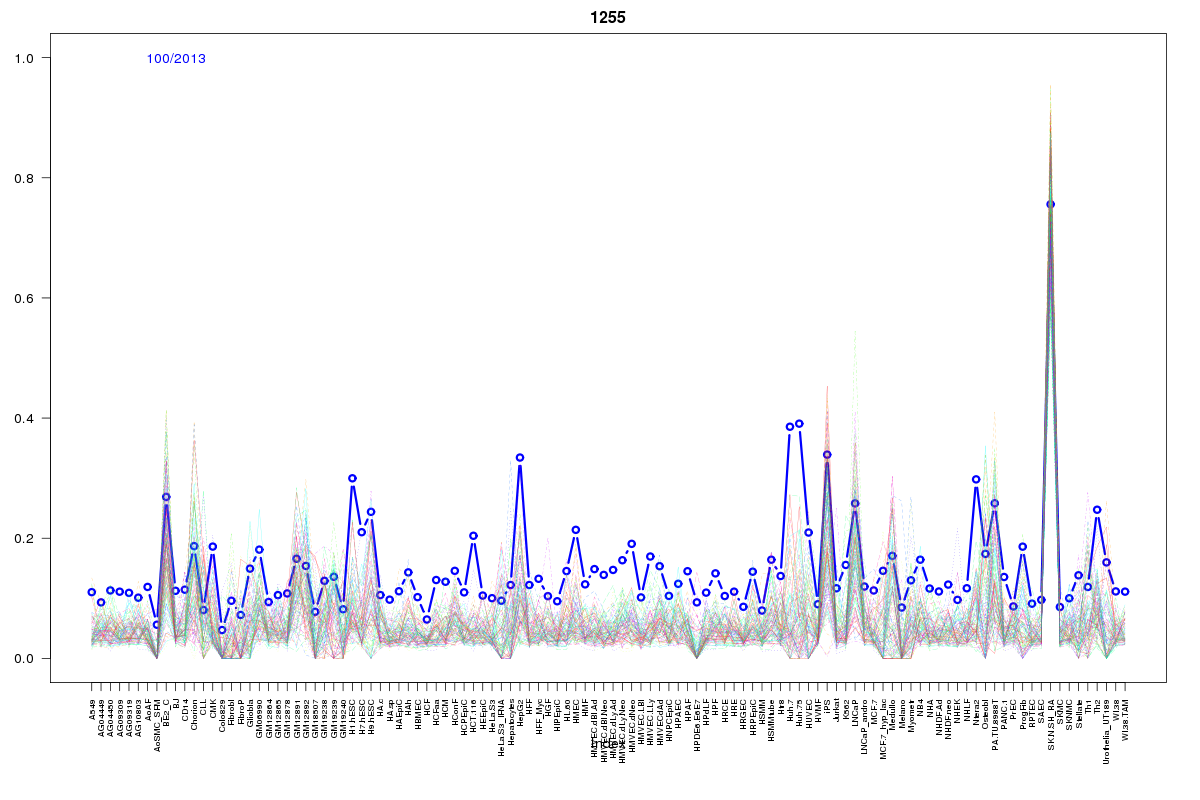 | 1255 | 1 |
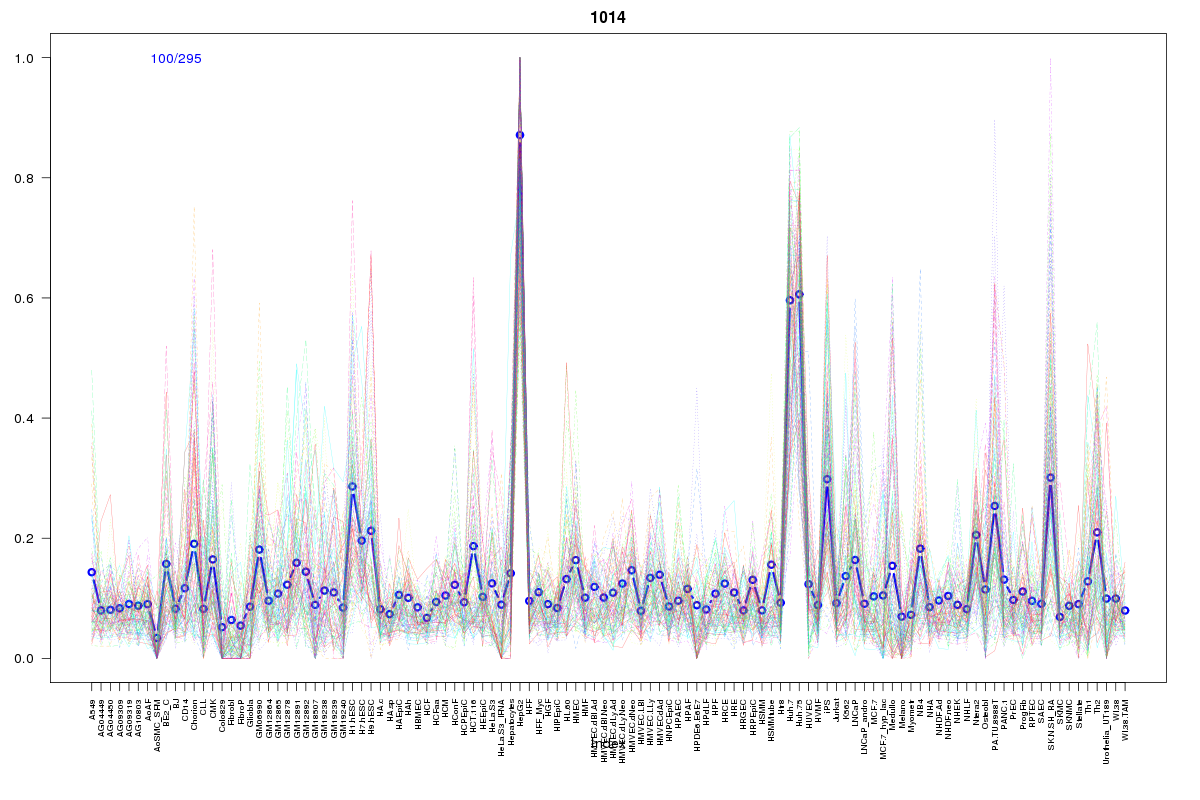 | 1014 | 1 |
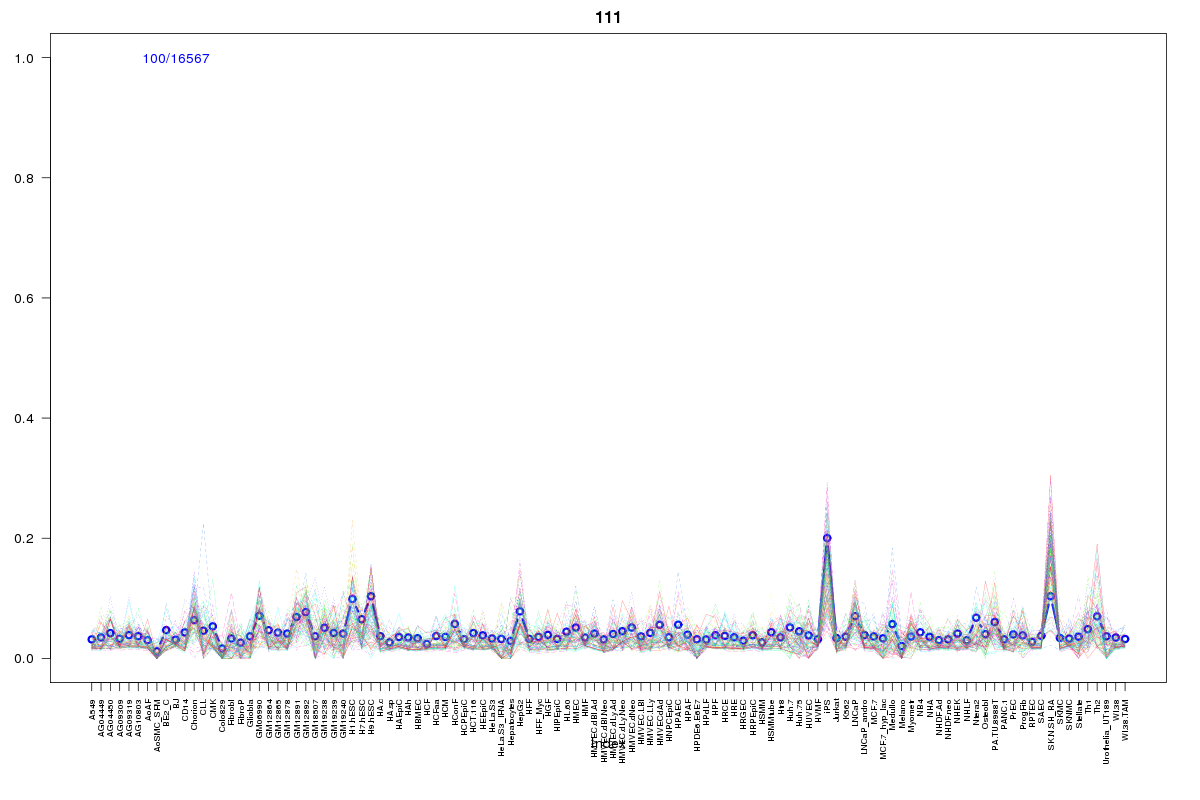 | 111 | 1 |
 | 469 | 1 |
 | 569 | 1 |
 | 629 | 1 |
Resources
BED file downloads
Connects to 25 DHS sitesTop 10 Correlated DHS Sites
p-values indiciate significant higher or lower correlation| Location | Cluster | P-value |
|---|---|---|
| chr12:58119585-58119735 | 807 | 0.003 |
| chr12:58005360-58005510 | 1170 | 0.003 |
| chr12:57997680-57997830 | 2392 | 0.003 |
| chr12:58025800-58025950 | 1255 | 0.013 |
| chr12:58004825-58004975 | 1205 | 0.015 |
| chr12:58026280-58026430 | 1014 | 0.015 |
| chr12:58005100-58005250 | 1171 | 0.015 |
| chr12:57919545-57919695 | 111 | 0.022 |
| chr12:57944300-57944450 | 754 | 0.023 |
| chr12:58021585-58021735 | 410 | 0.023 |
| chr12:57938760-57938910 | 569 | 0.023 |
External Databases
UCSCEnsembl (ENSG00000135502)