Gene: TGFBRAP1
chr2: 105880870-105946491Expression Profile
(log scale)
Graphical Connections
Distribution of linked clusters:
You may find it interesting if many of the connected DHS sites belong to the same cluster.| Cluster Profile | Cluster ID | Number of DHS sites in this cluster |
|---|---|---|
 | 979 | 2 |
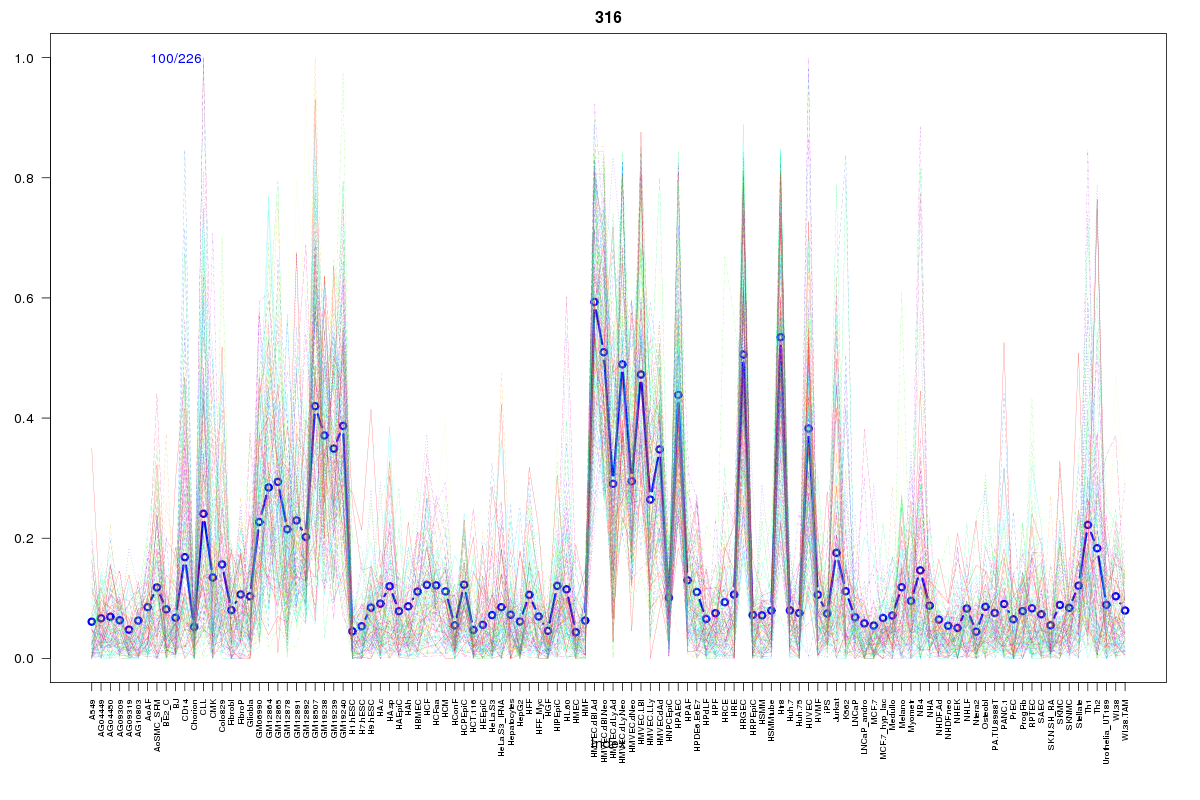 | 316 | 2 |
 | 1975 | 2 |
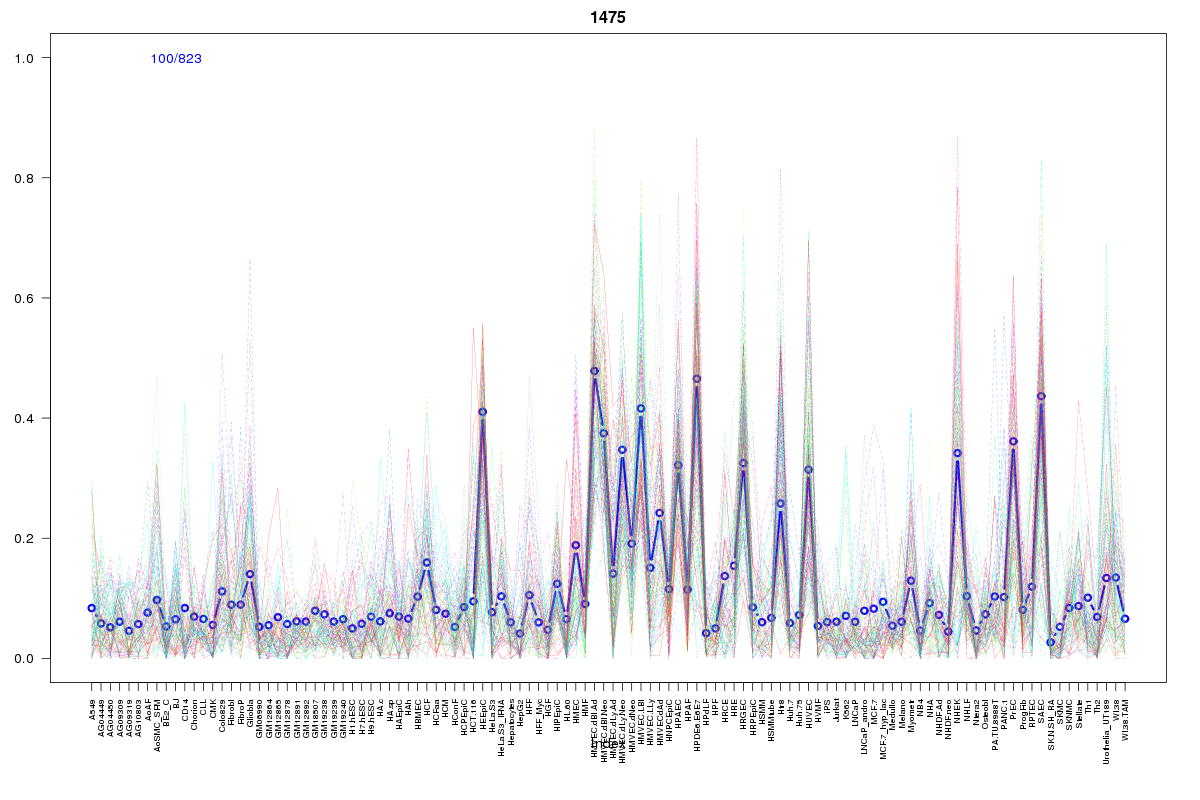 | 1475 | 1 |
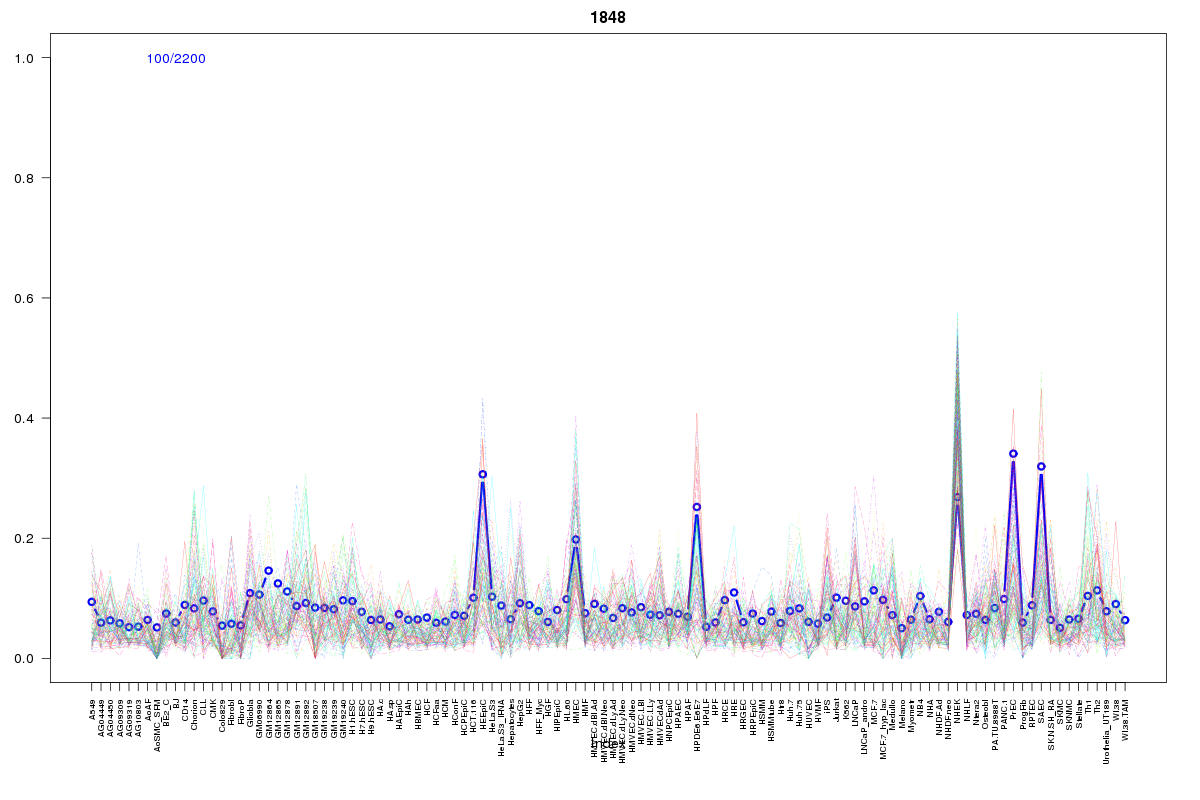 | 1848 | 1 |
 | 687 | 1 |
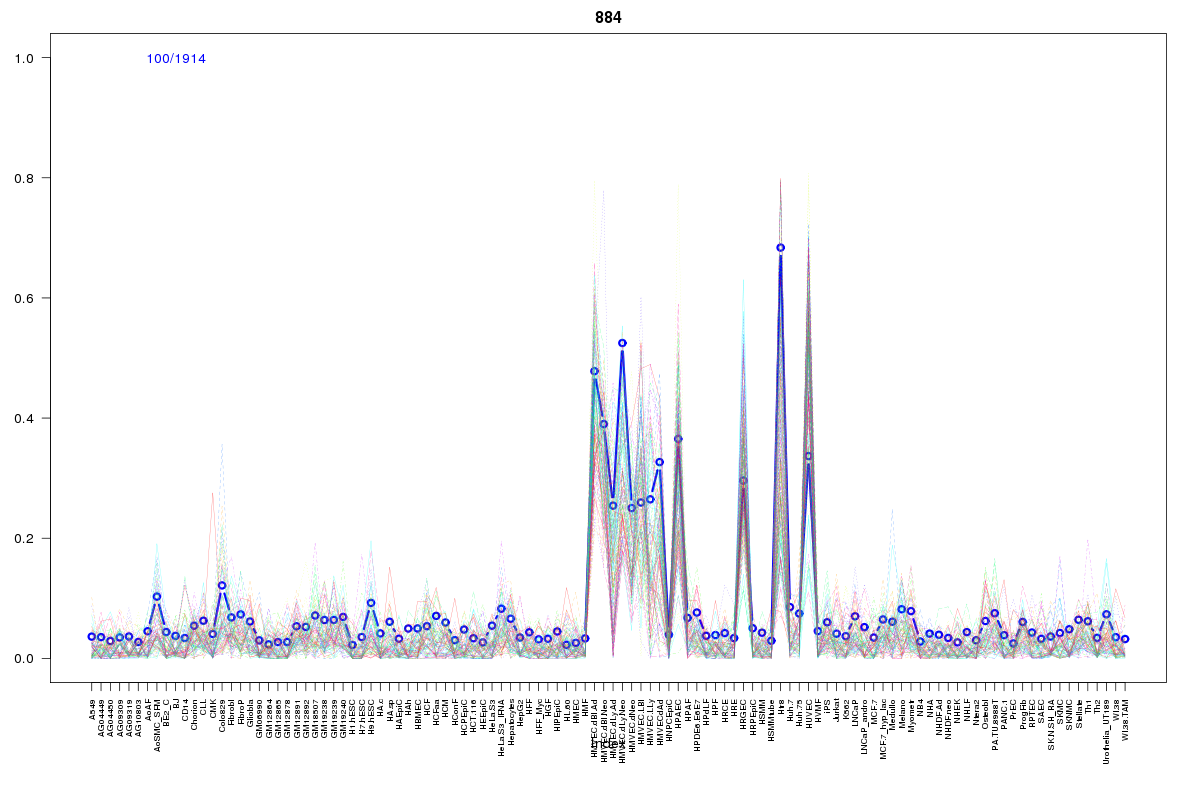 | 884 | 1 |
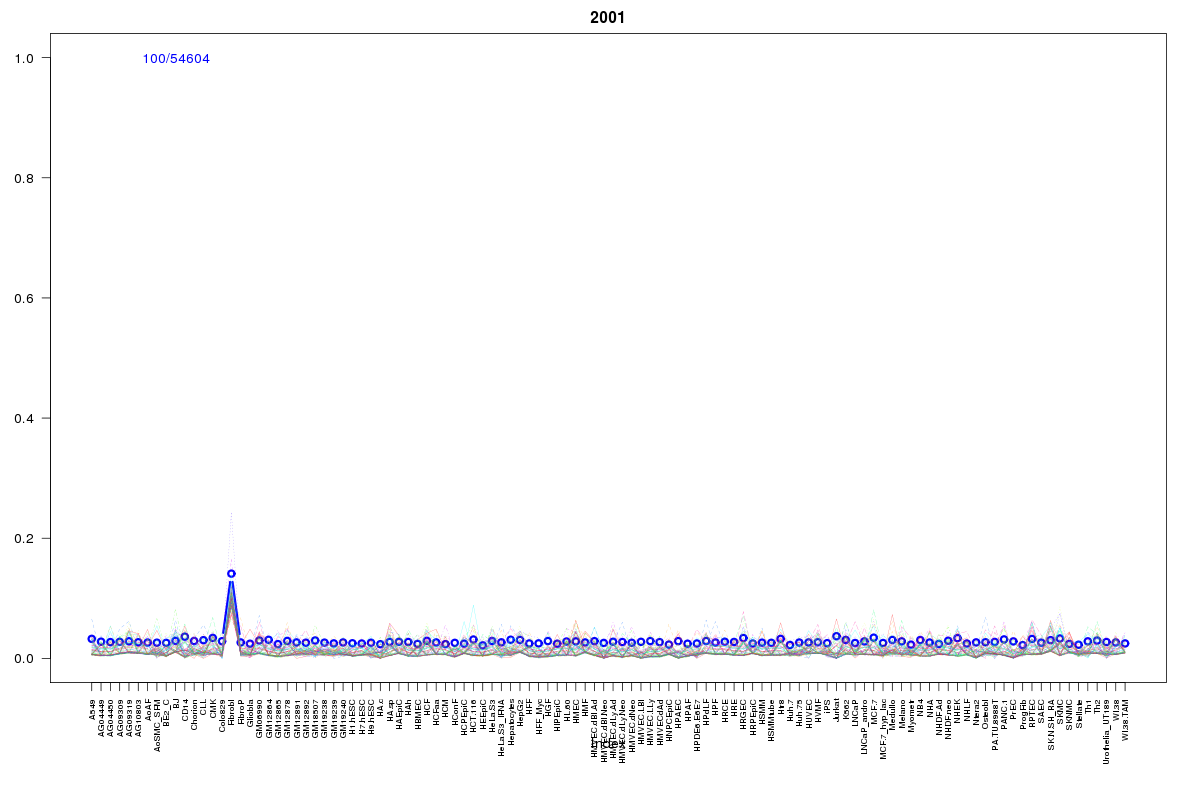 | 2001 | 1 |
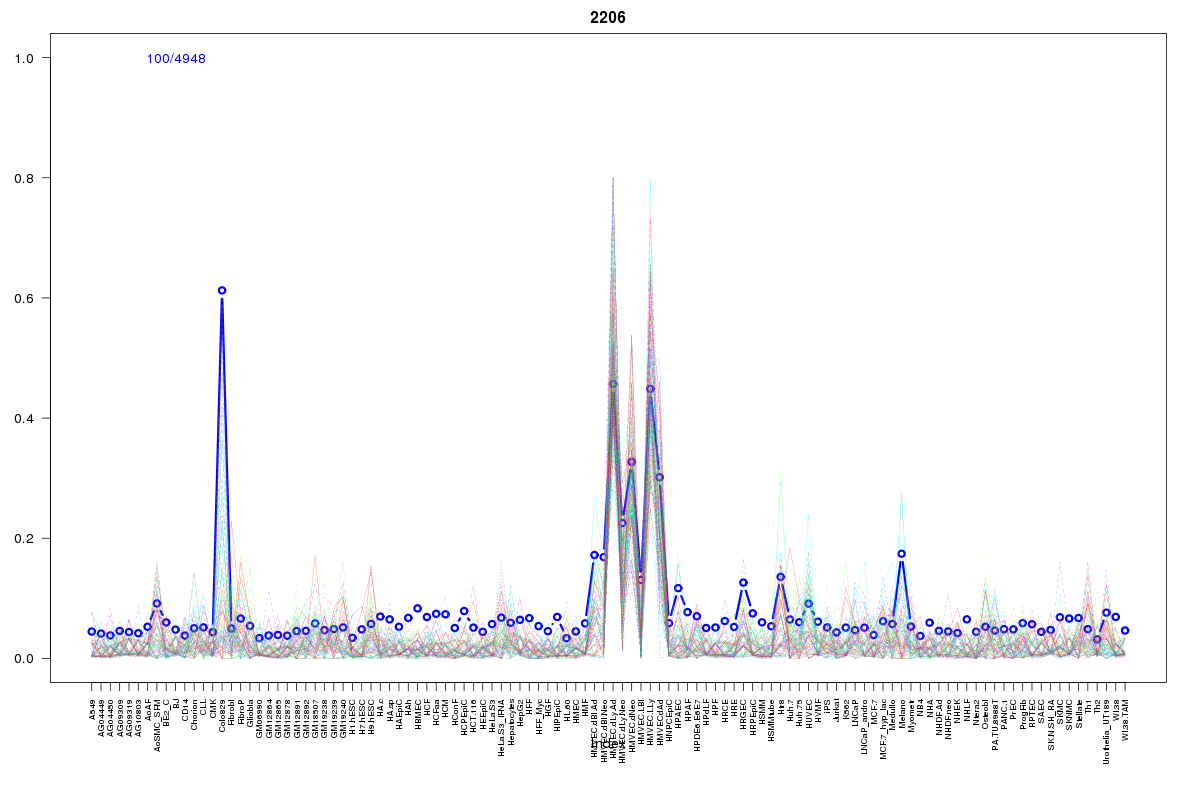 | 2206 | 1 |
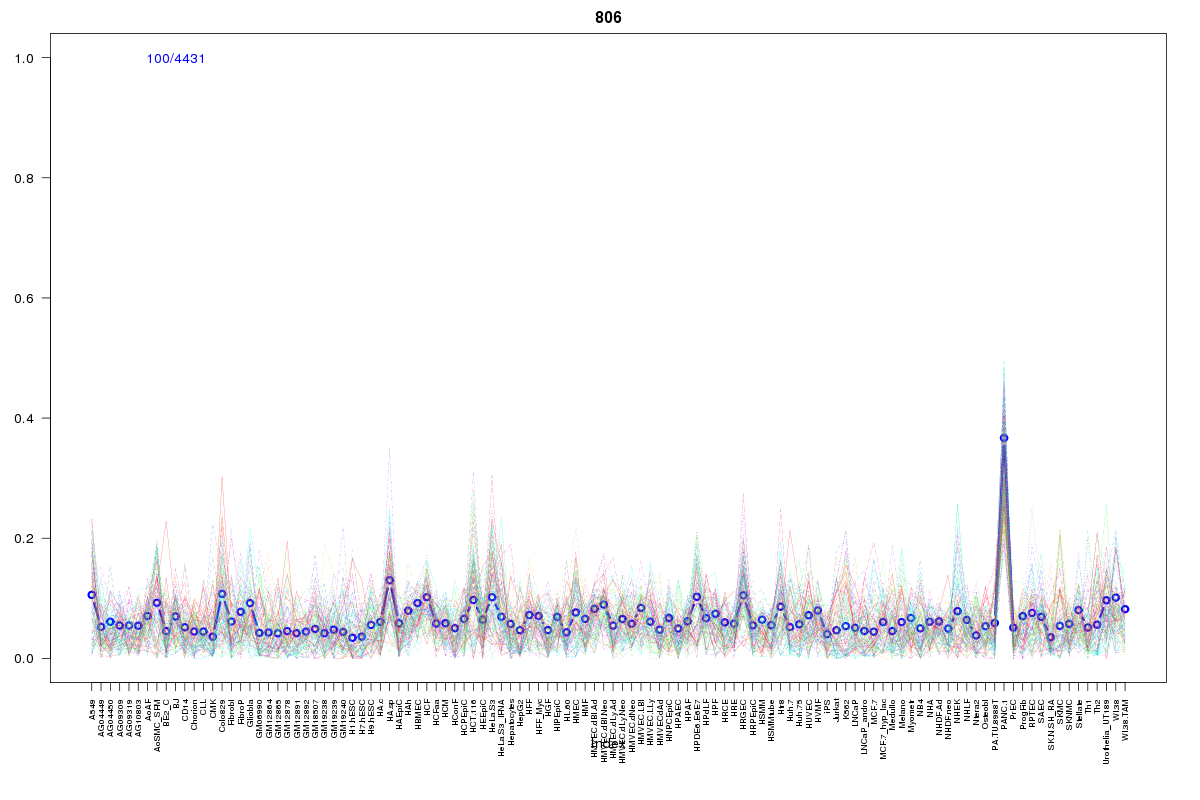 | 806 | 1 |
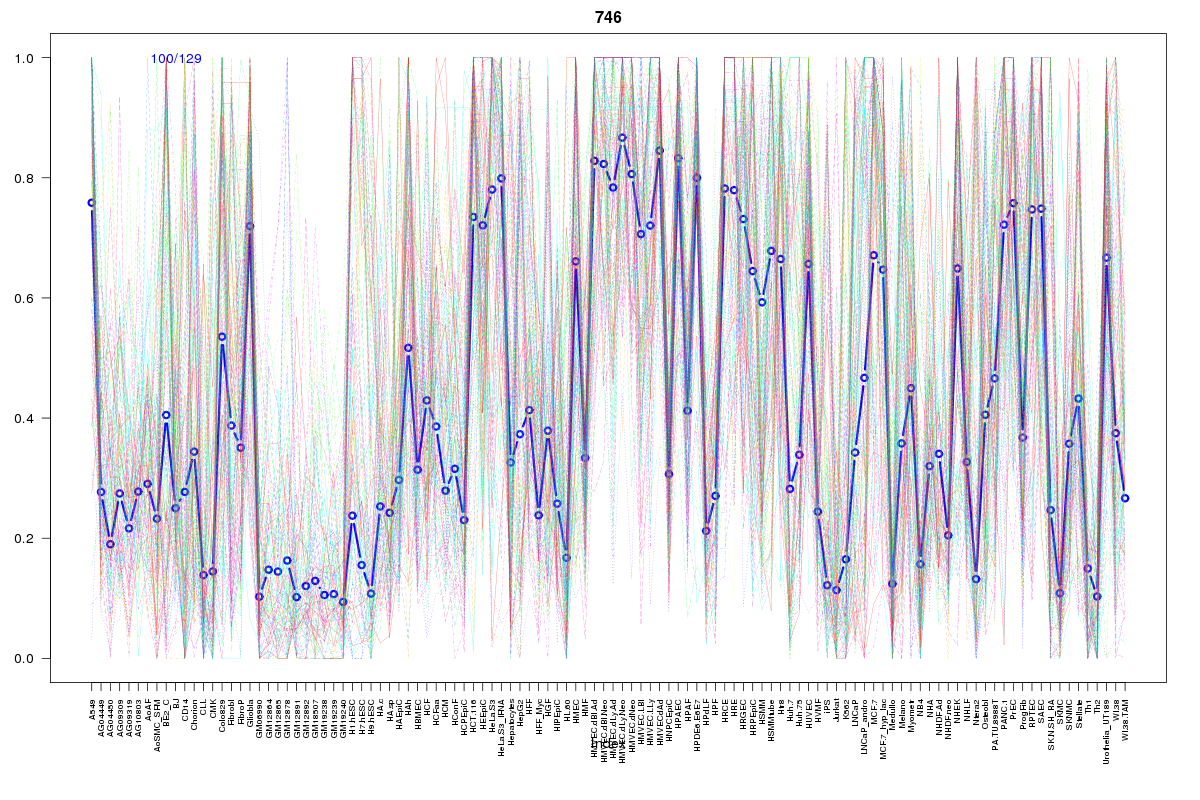 | 746 | 1 |
 | 935 | 1 |
 | 881 | 1 |
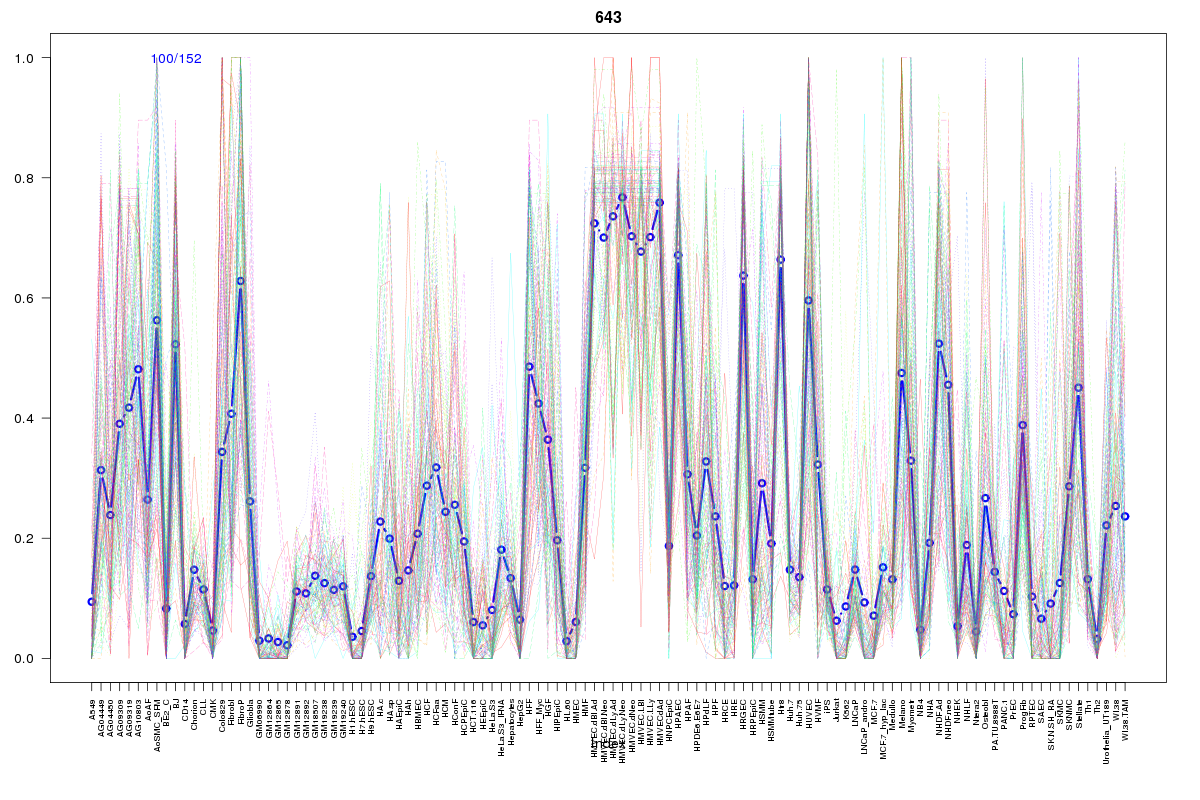 | 643 | 1 |
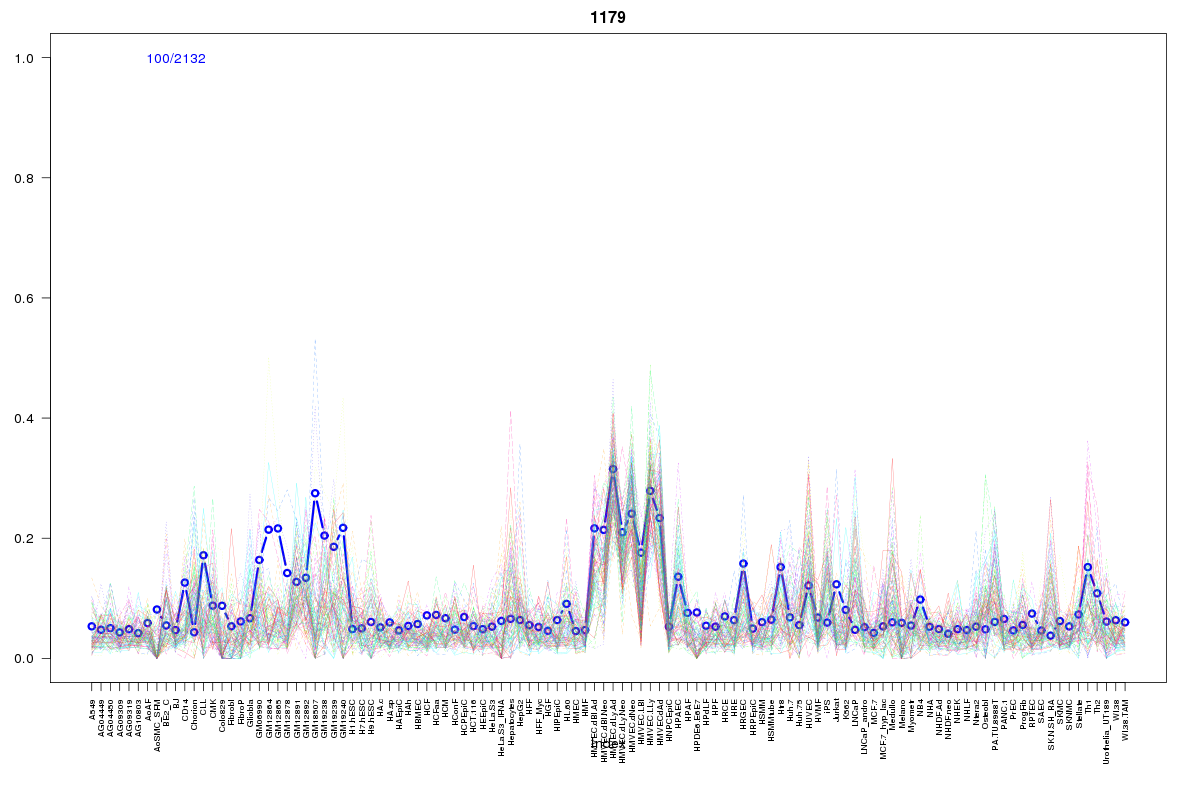 | 1179 | 1 |
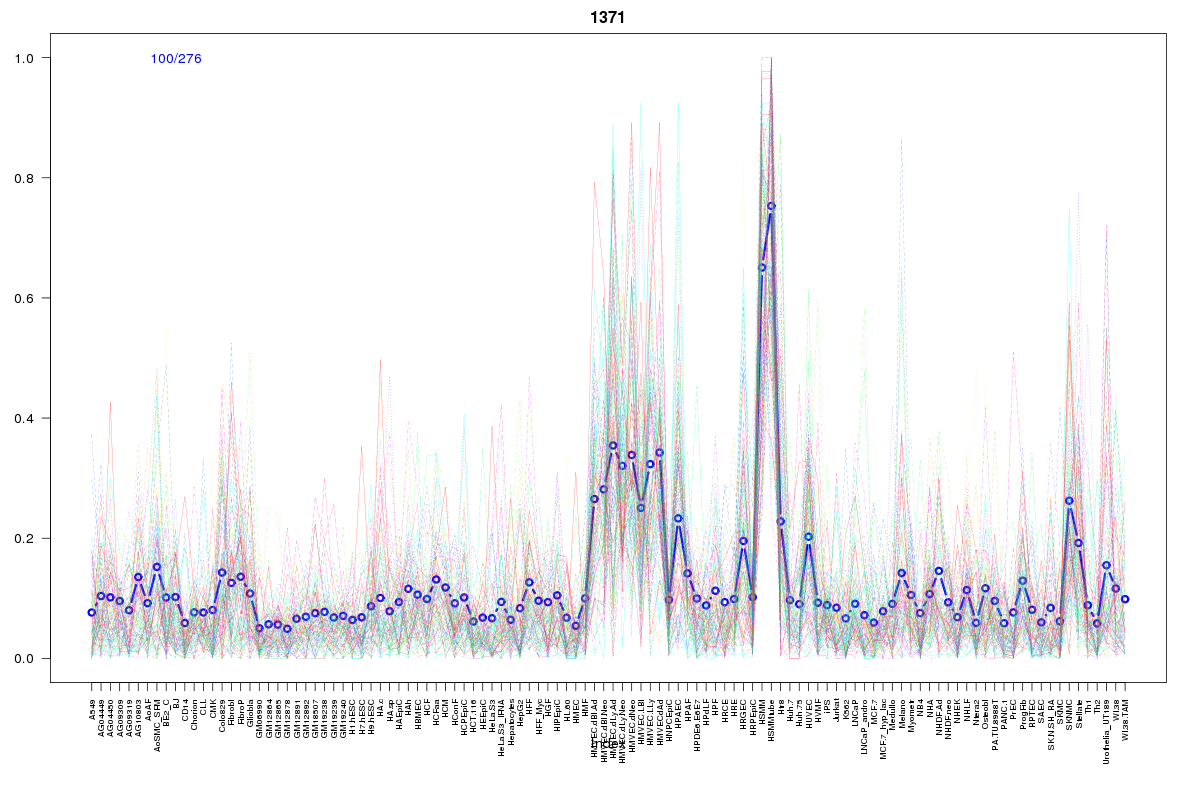 | 1371 | 1 |
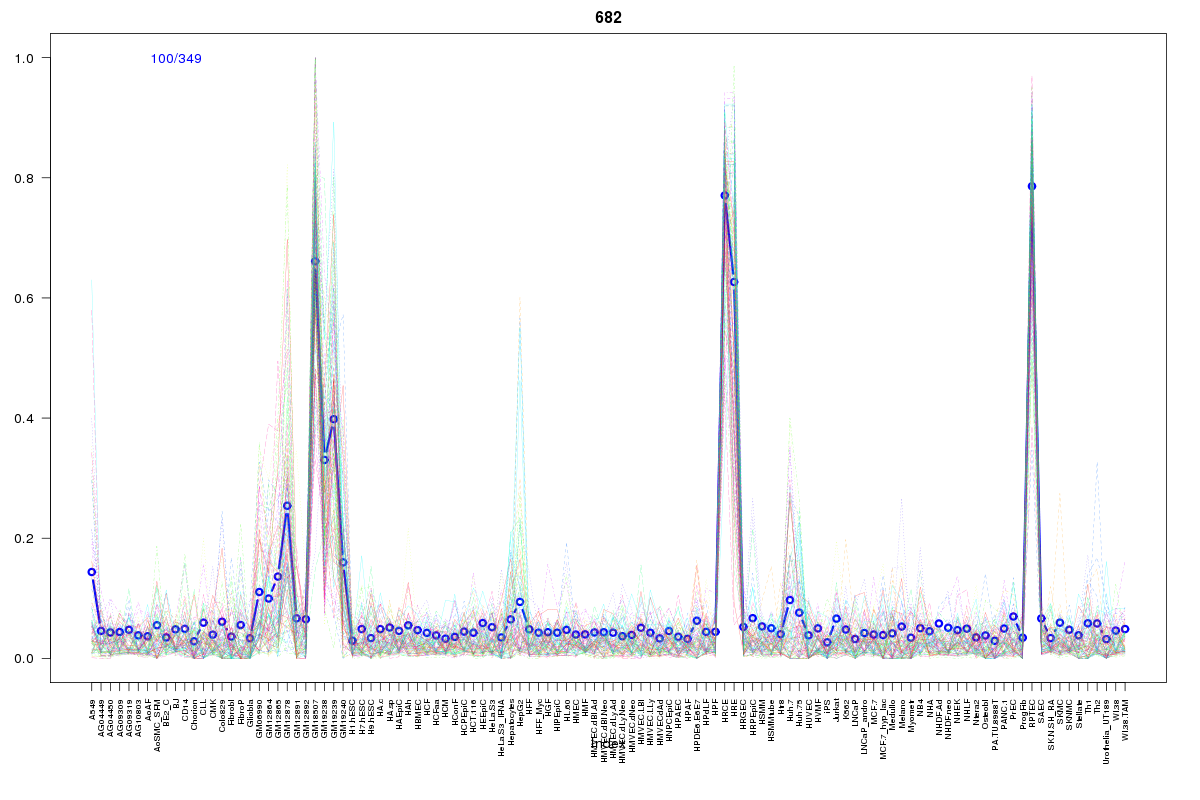 | 682 | 1 |
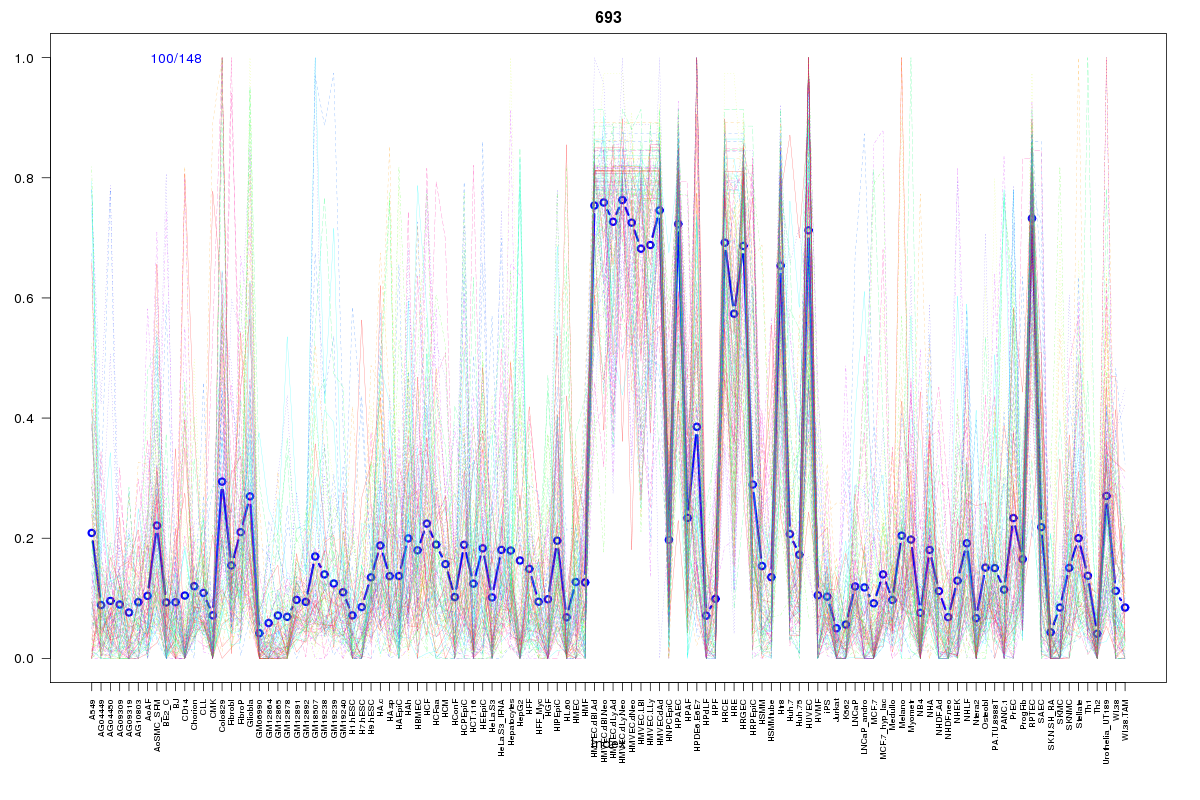 | 693 | 1 |
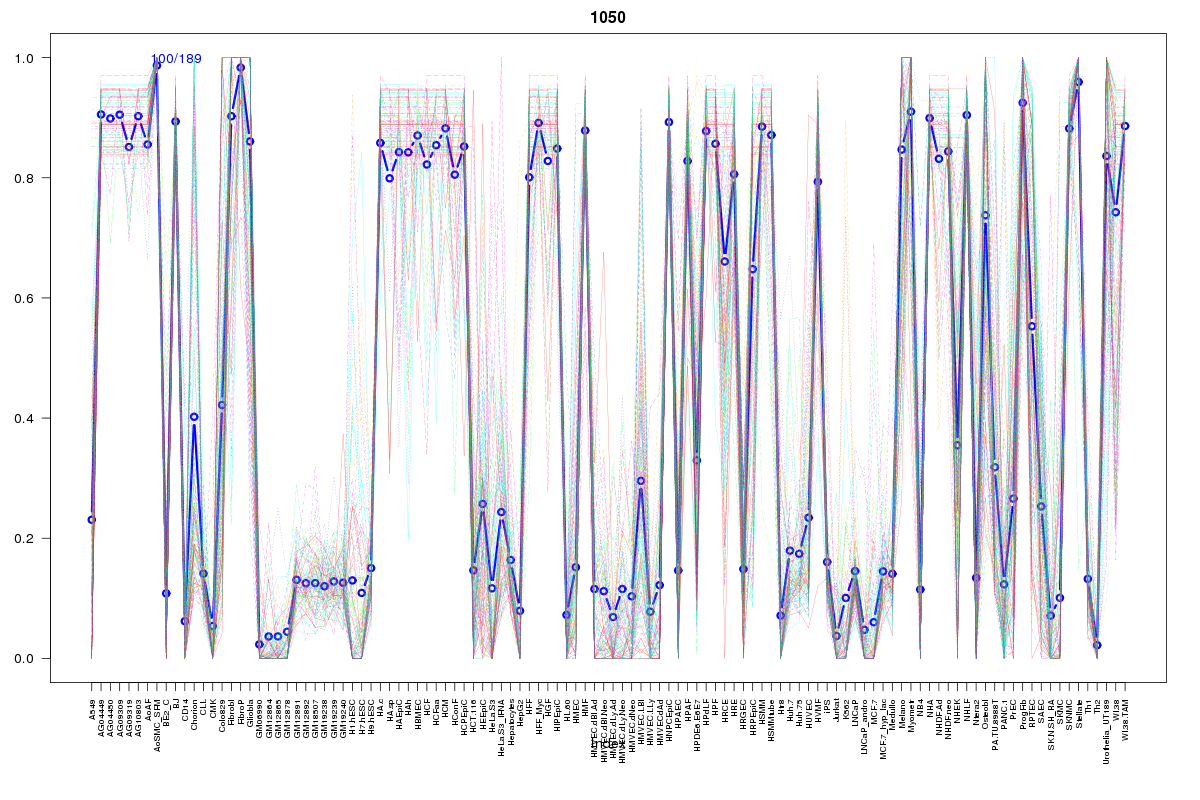 | 1050 | 1 |
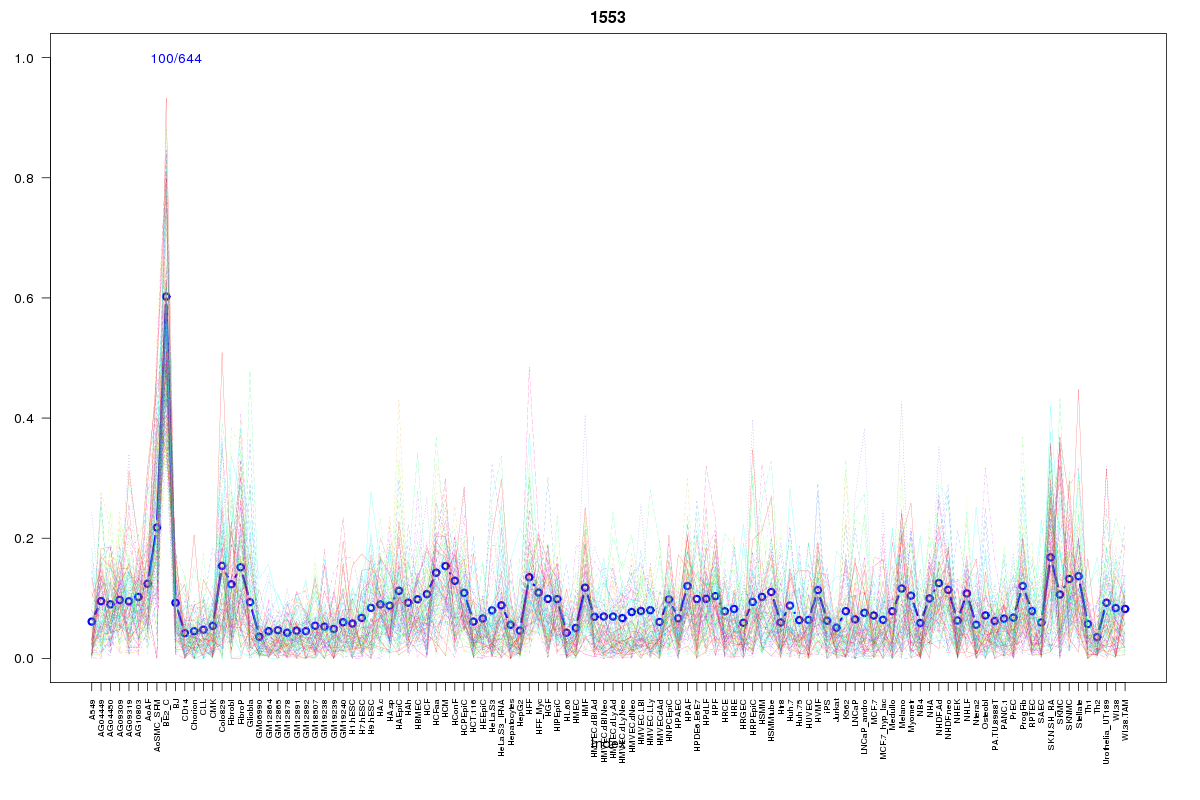 | 1553 | 1 |
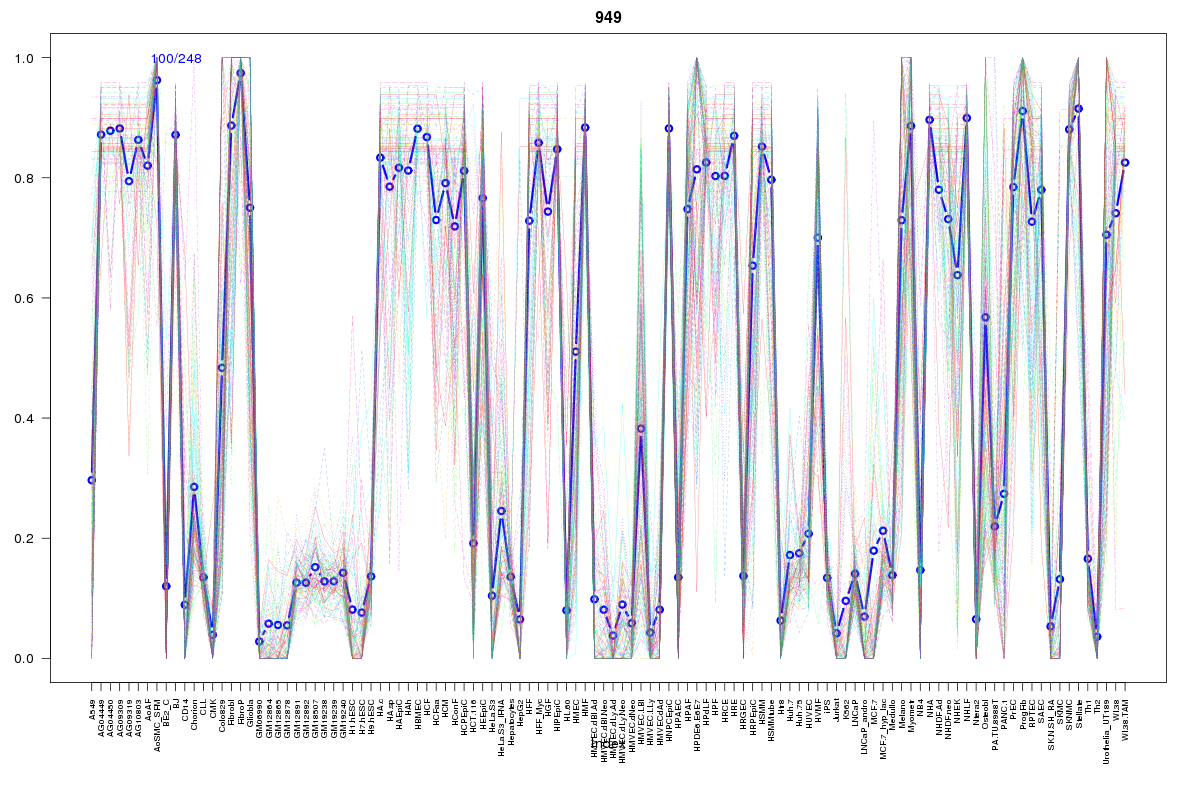 | 949 | 1 |
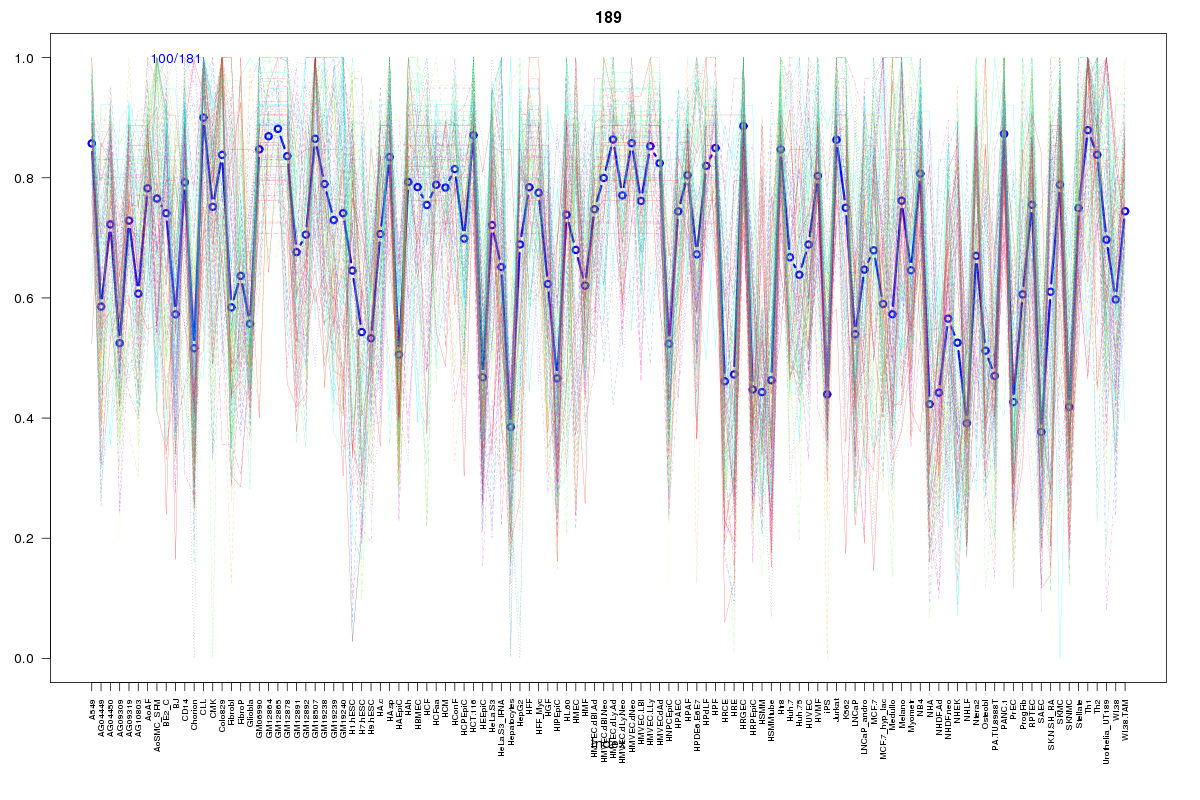 | 189 | 1 |
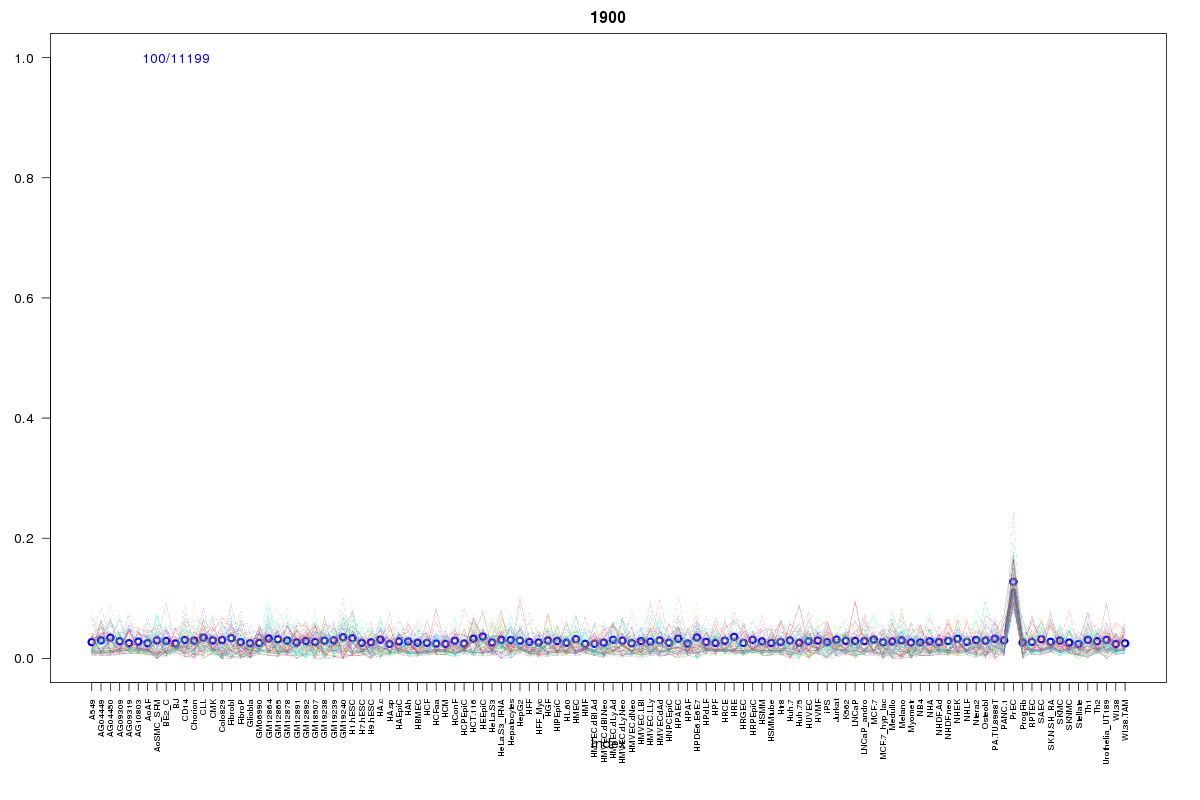 | 1900 | 1 |
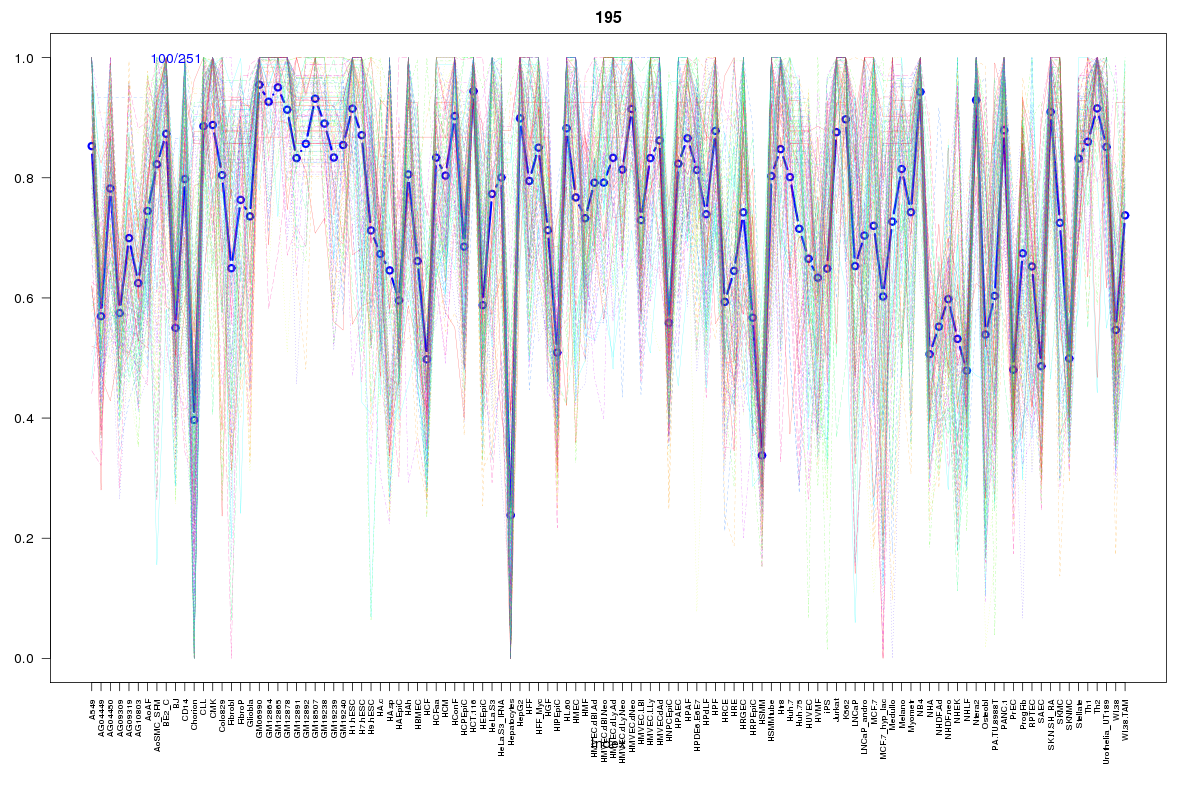 | 195 | 1 |
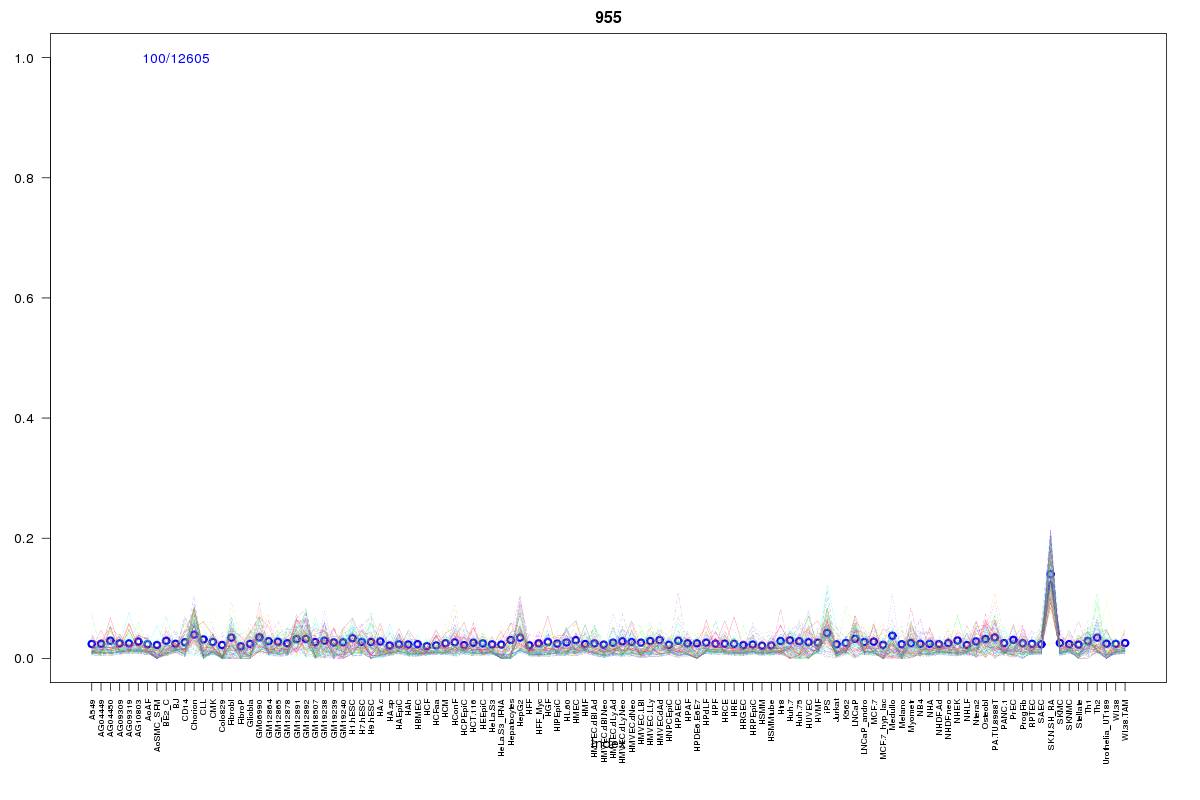 | 955 | 1 |
 | 1404 | 1 |
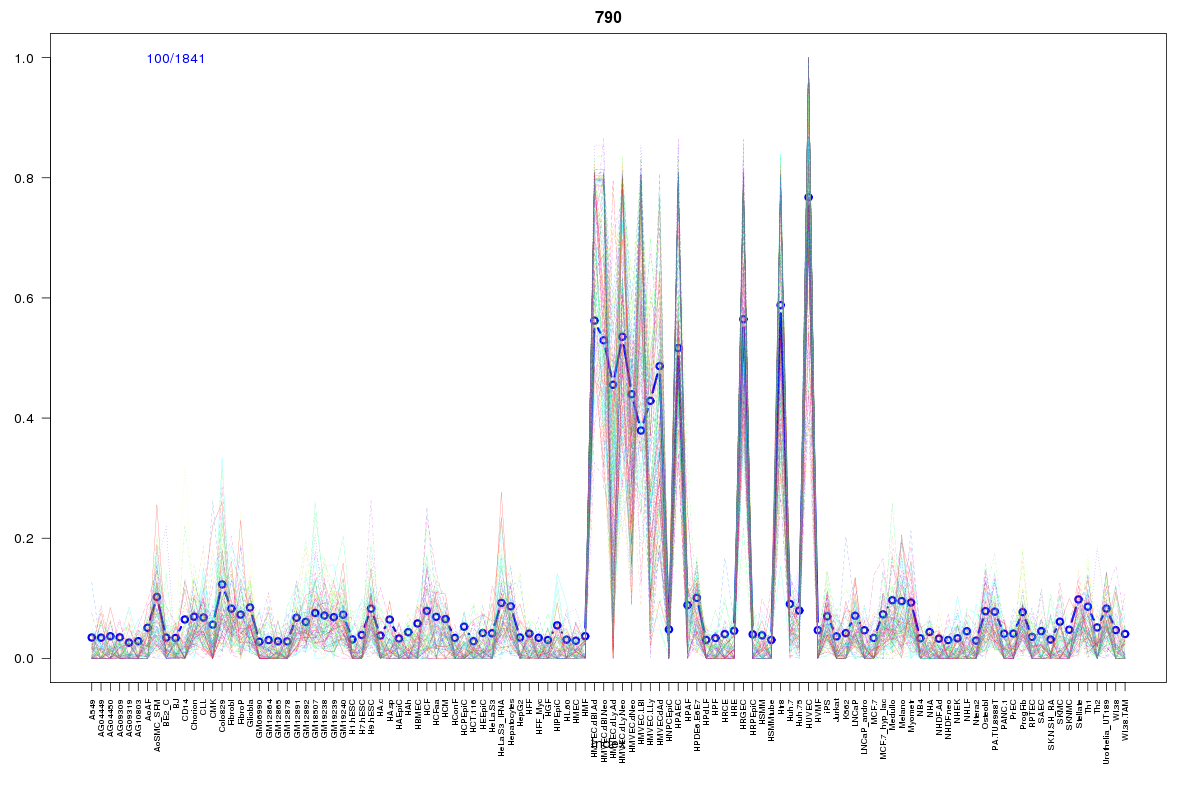 | 790 | 1 |
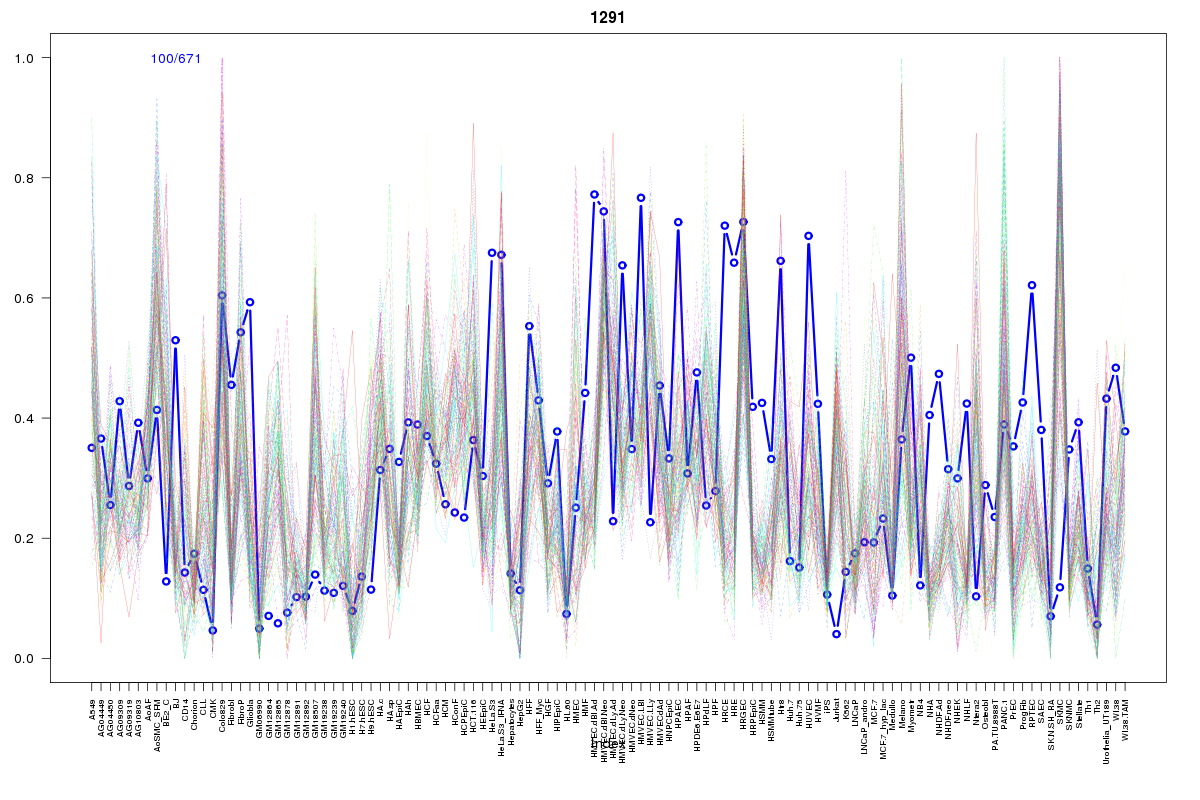 | 1291 | 1 |
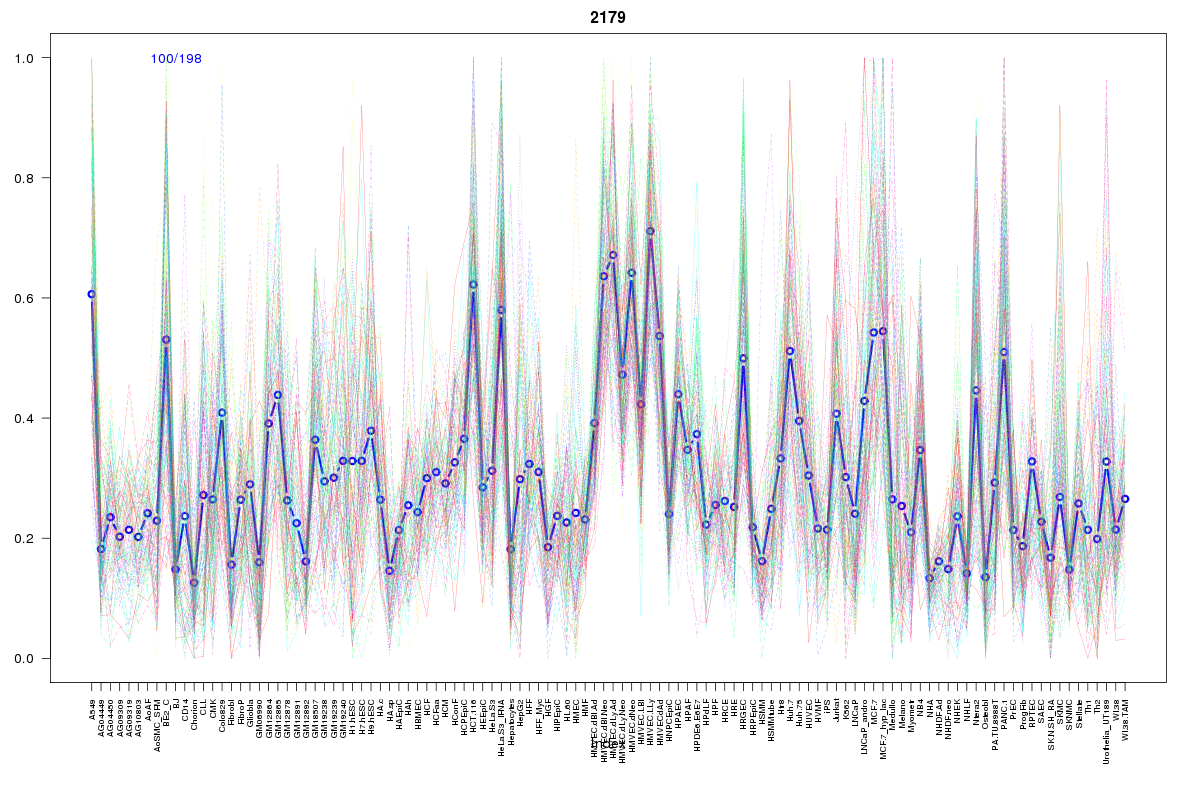 | 2179 | 1 |
 | 2114 | 1 |
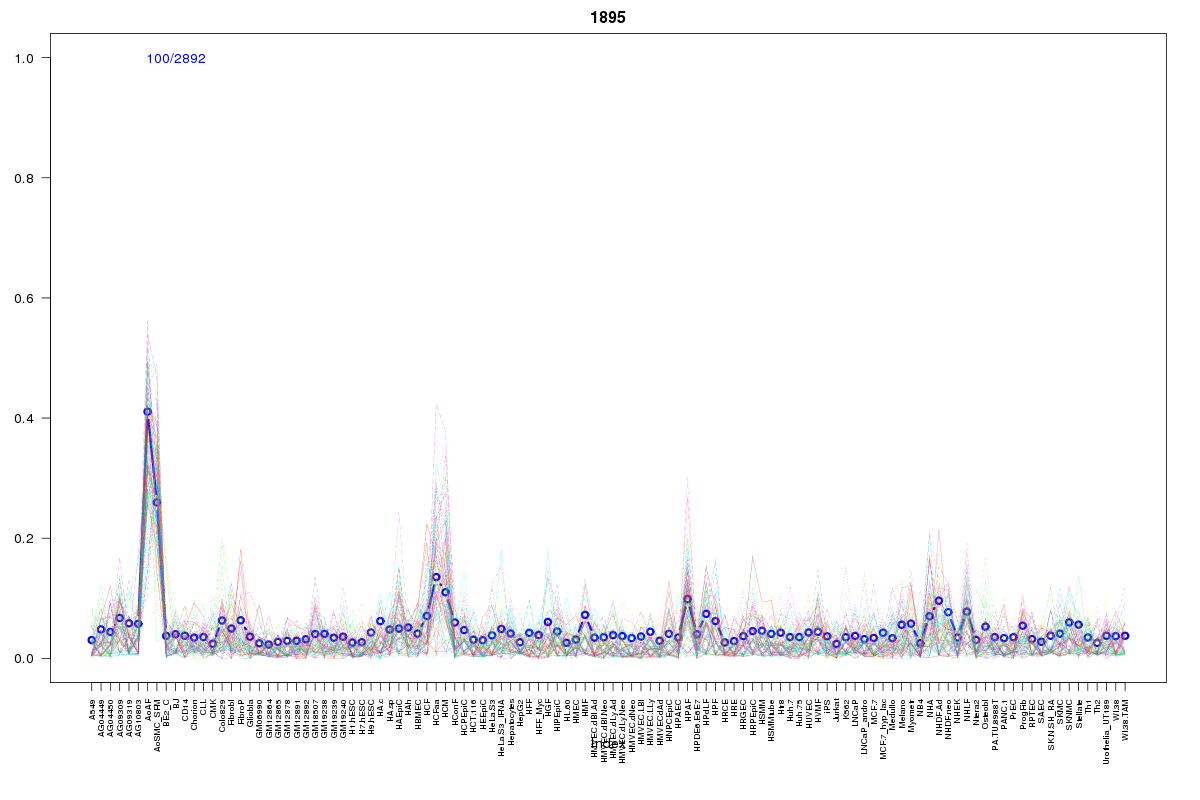 | 1895 | 1 |
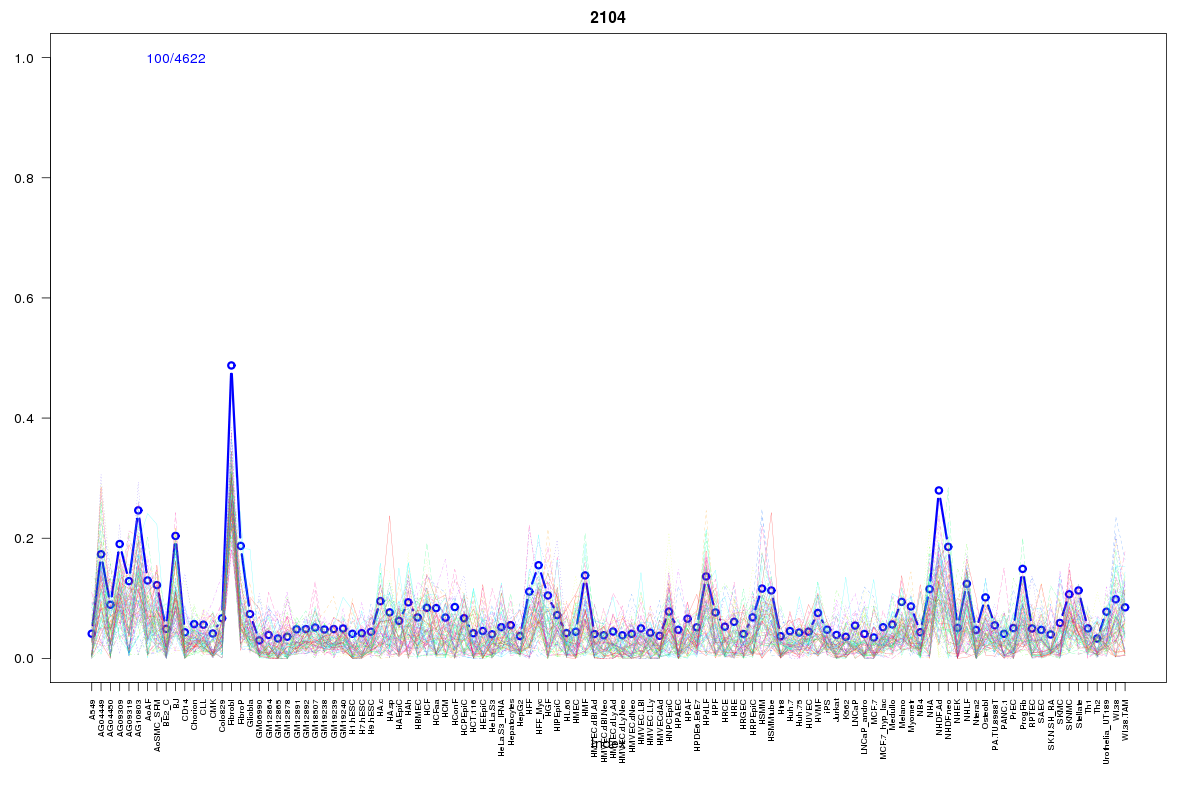 | 2104 | 1 |
Resources
BED file downloads
Connects to 35 DHS sitesTop 10 Correlated DHS Sites
p-values indiciate significant higher or lower correlation| Location | Cluster | P-value |
|---|---|---|
| chr2:105944820-105944970 | 693 | 0.001 |
| chr2:105854120-105854270 | 1179 | 0.001 |
| chr2:105945220-105945370 | 316 | 0.003 |
| chr2:105939565-105939715 | 687 | 0.003 |
| chr2:105939720-105939870 | 2206 | 0.003 |
| chr2:105945060-105945210 | 316 | 0.003 |
| chr2:105944660-105944810 | 1371 | 0.003 |
| chr2:106003780-106003930 | 1975 | 0.004 |
| chr2:105941920-105942070 | 935 | 0.005 |
| chr2:105945400-105945550 | 1975 | 0.005 |
| chr2:105904320-105904470 | 2179 | 0.005 |
External Databases
UCSCEnsembl (ENSG00000135966)