Gene: KCTD3
chr1: 215740734-215795149Expression Profile
(log scale)
Graphical Connections
Distribution of linked clusters:
You may find it interesting if many of the connected DHS sites belong to the same cluster.| Cluster Profile | Cluster ID | Number of DHS sites in this cluster |
|---|---|---|
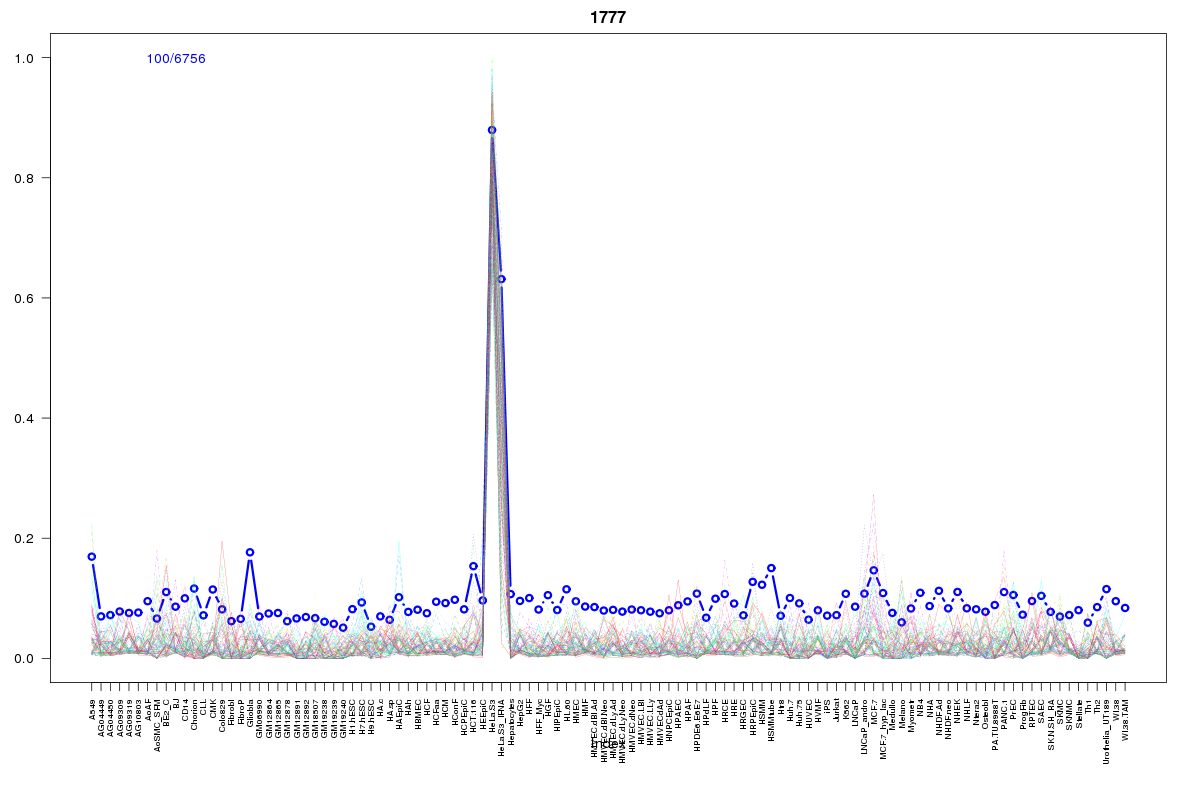 | 1777 | 2 |
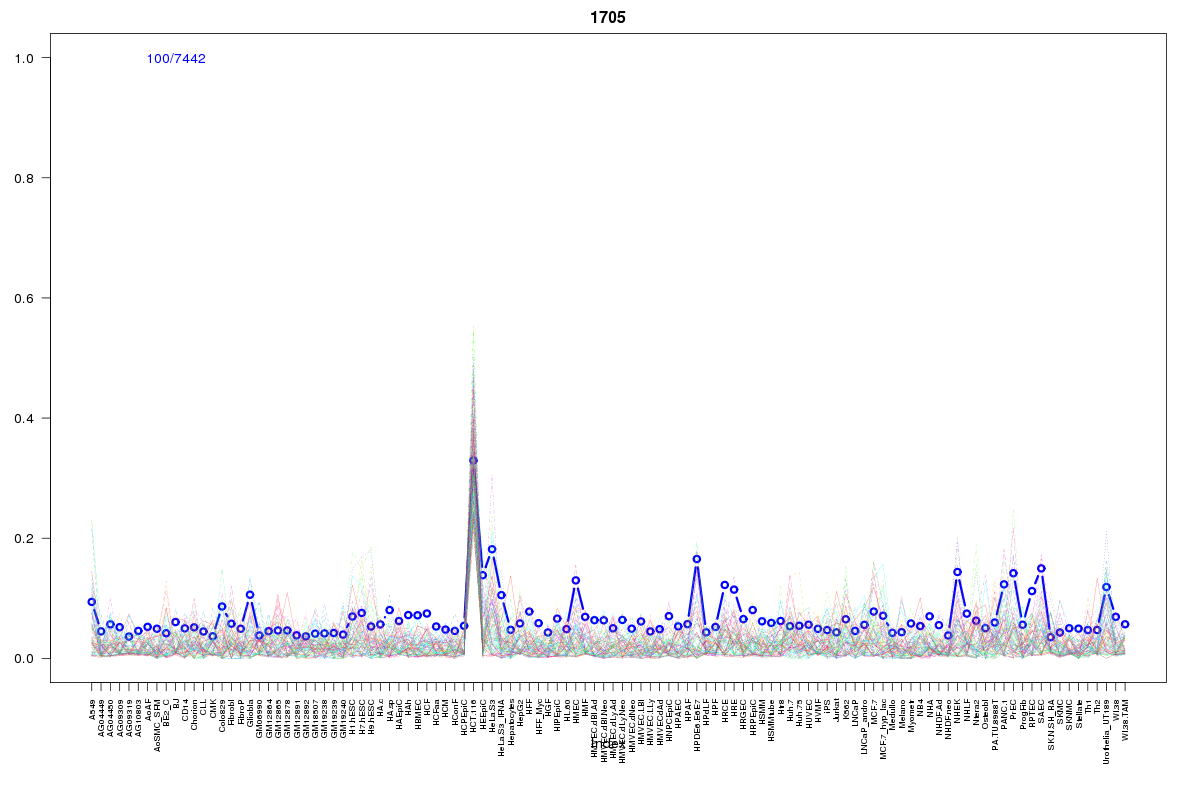 | 1705 | 2 |
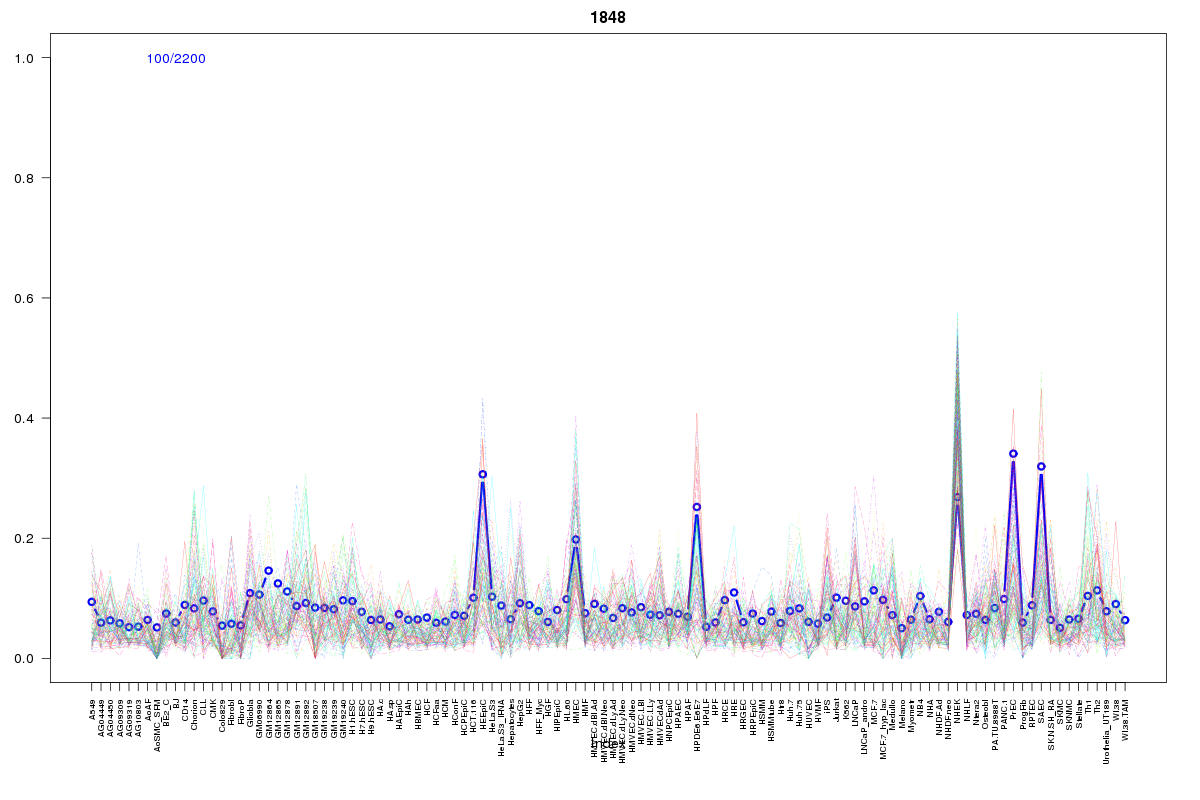 | 1848 | 1 |
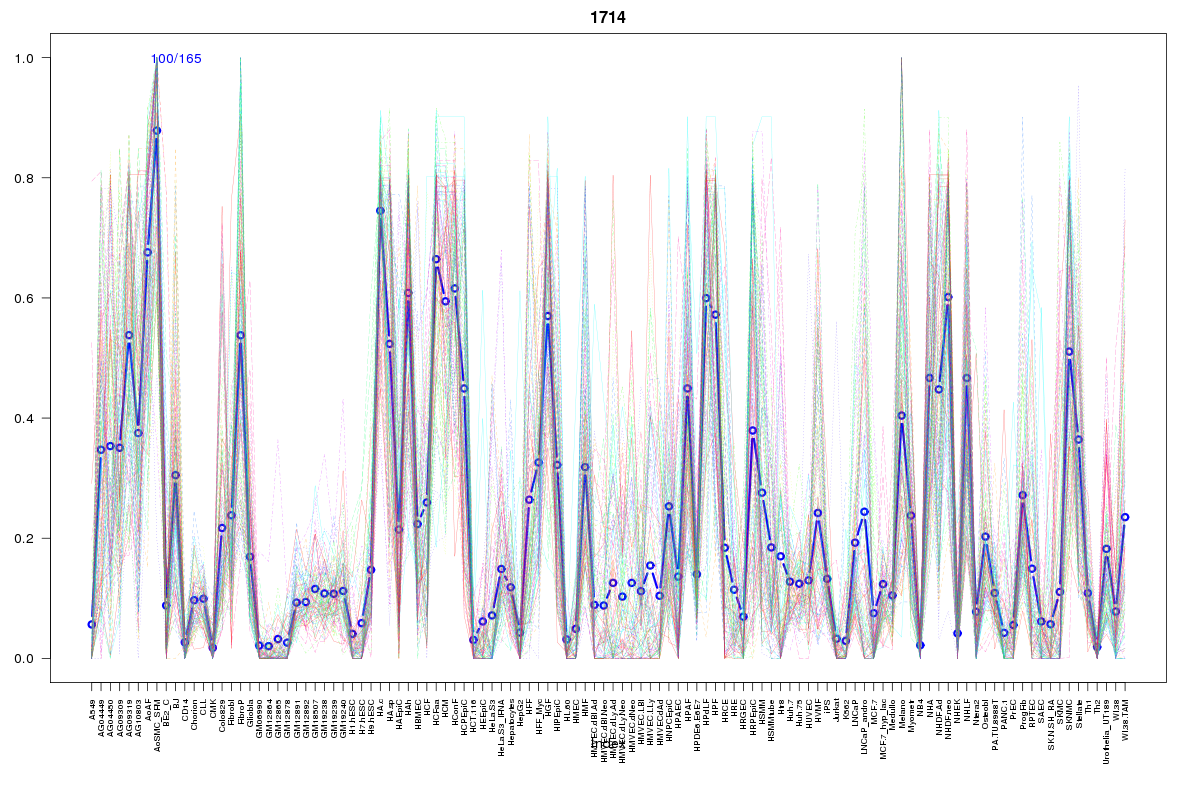 | 1714 | 1 |
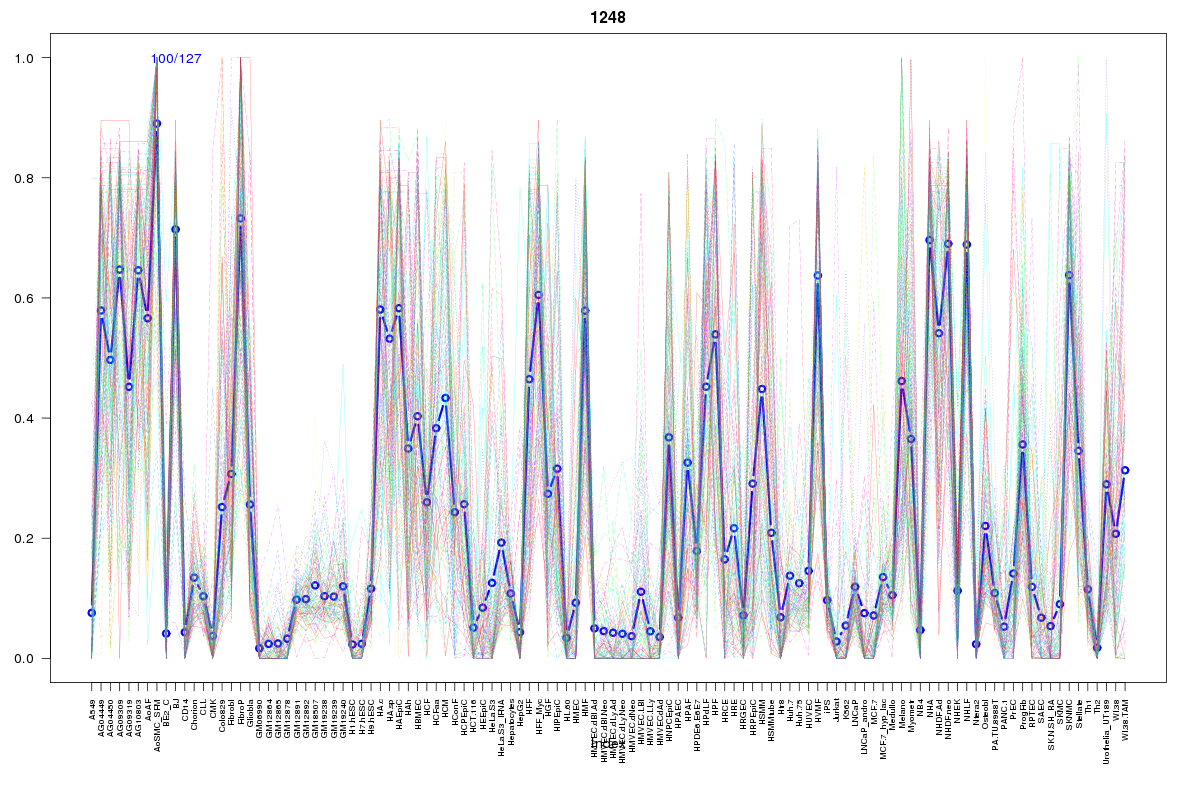 | 1248 | 1 |
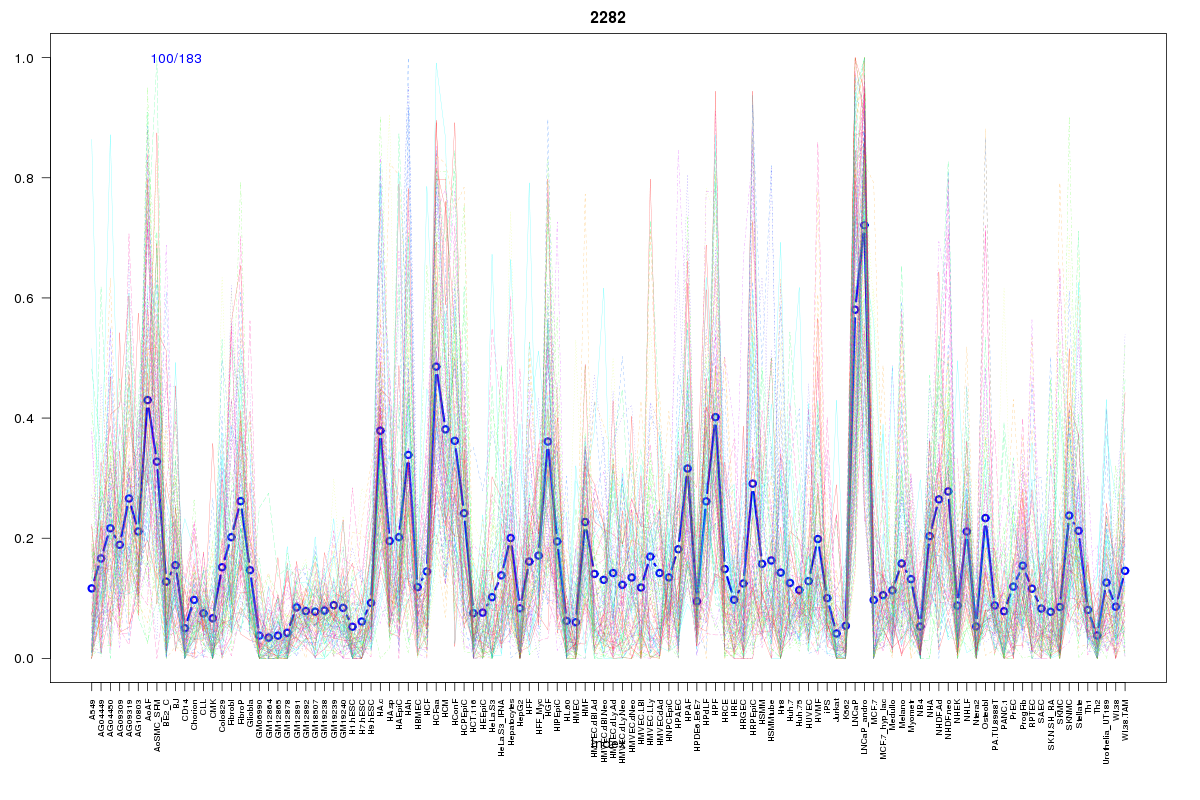 | 2282 | 1 |
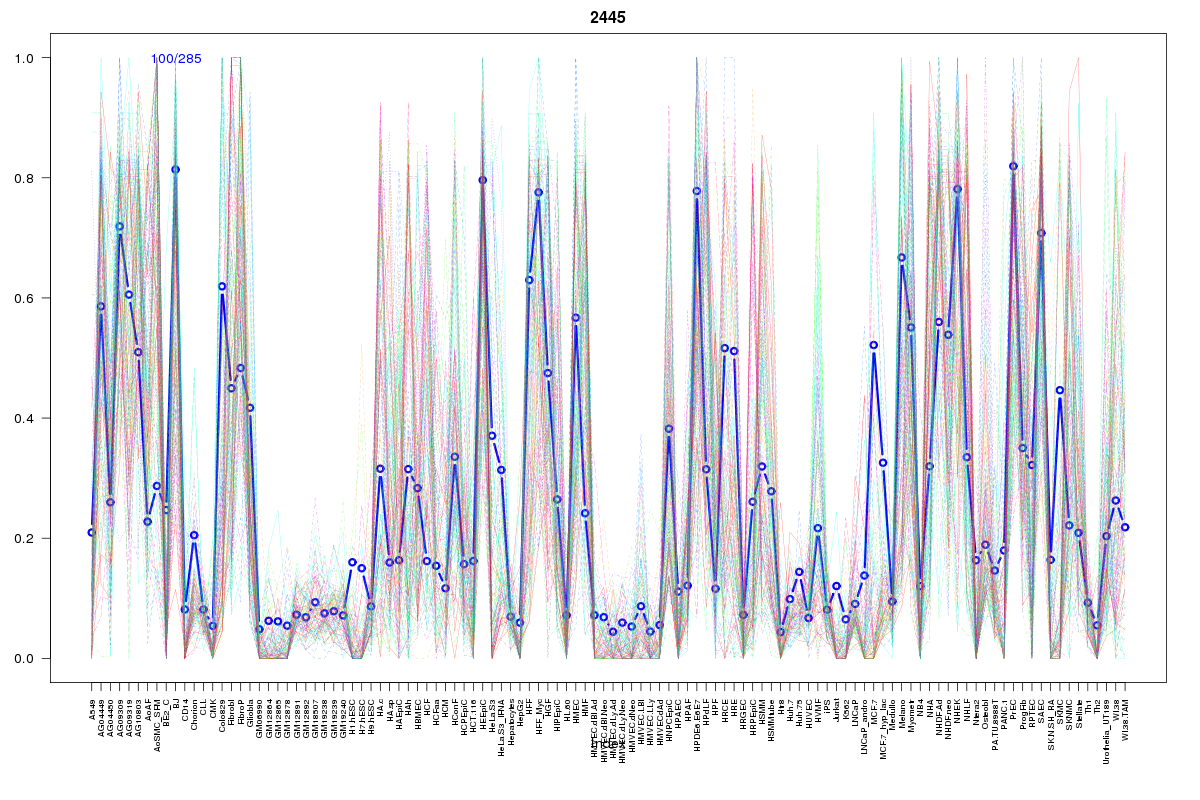 | 2445 | 1 |
 | 862 | 1 |
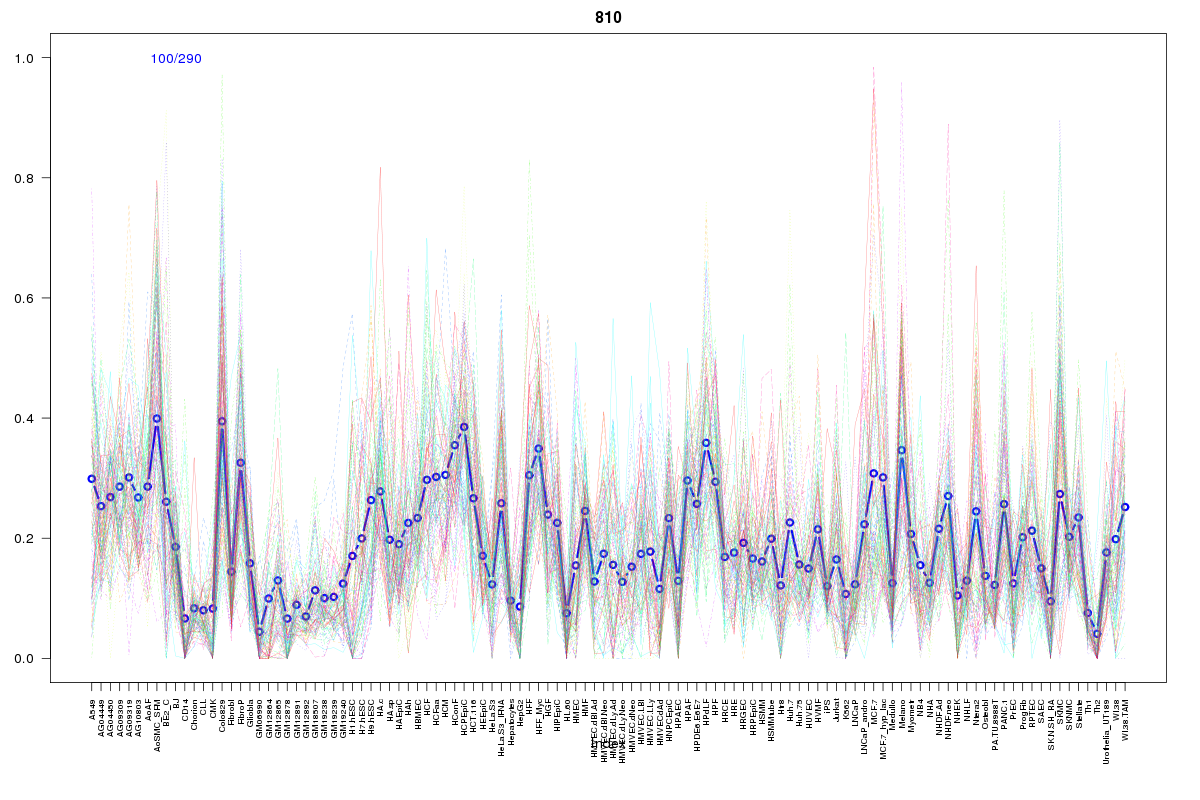 | 810 | 1 |
 | 2458 | 1 |
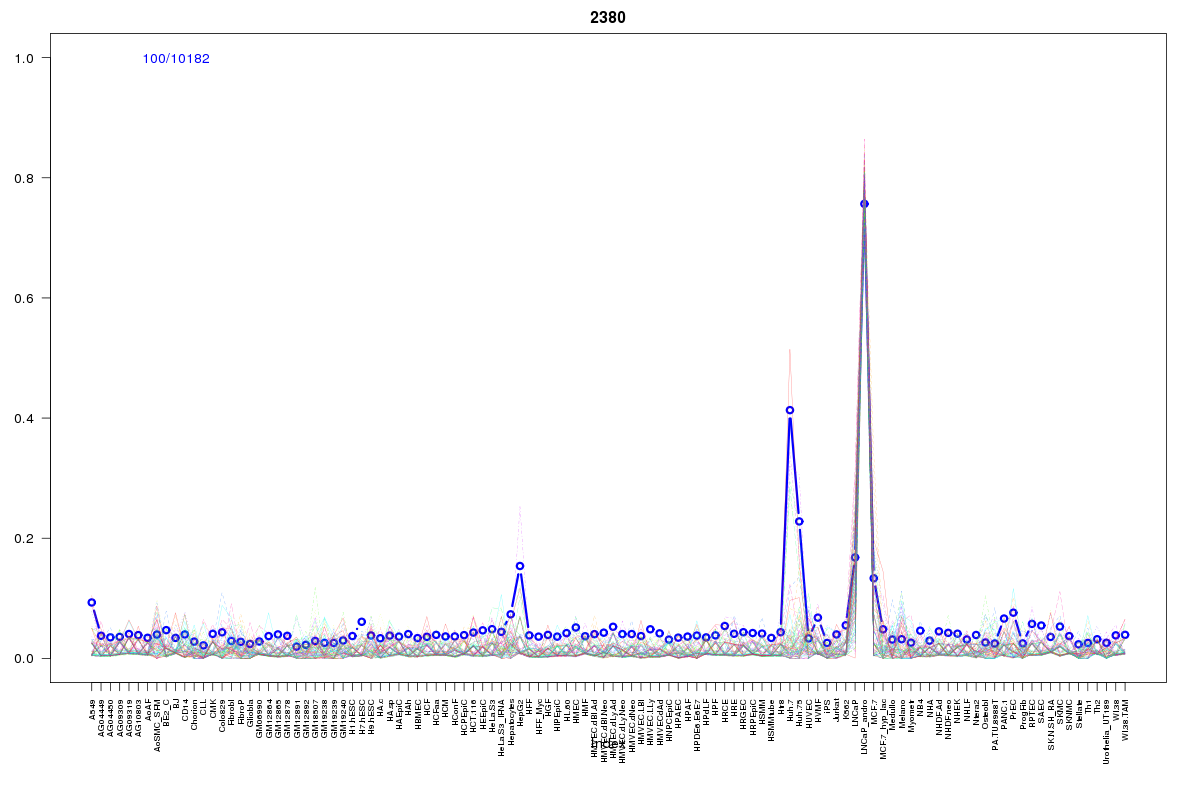 | 2380 | 1 |
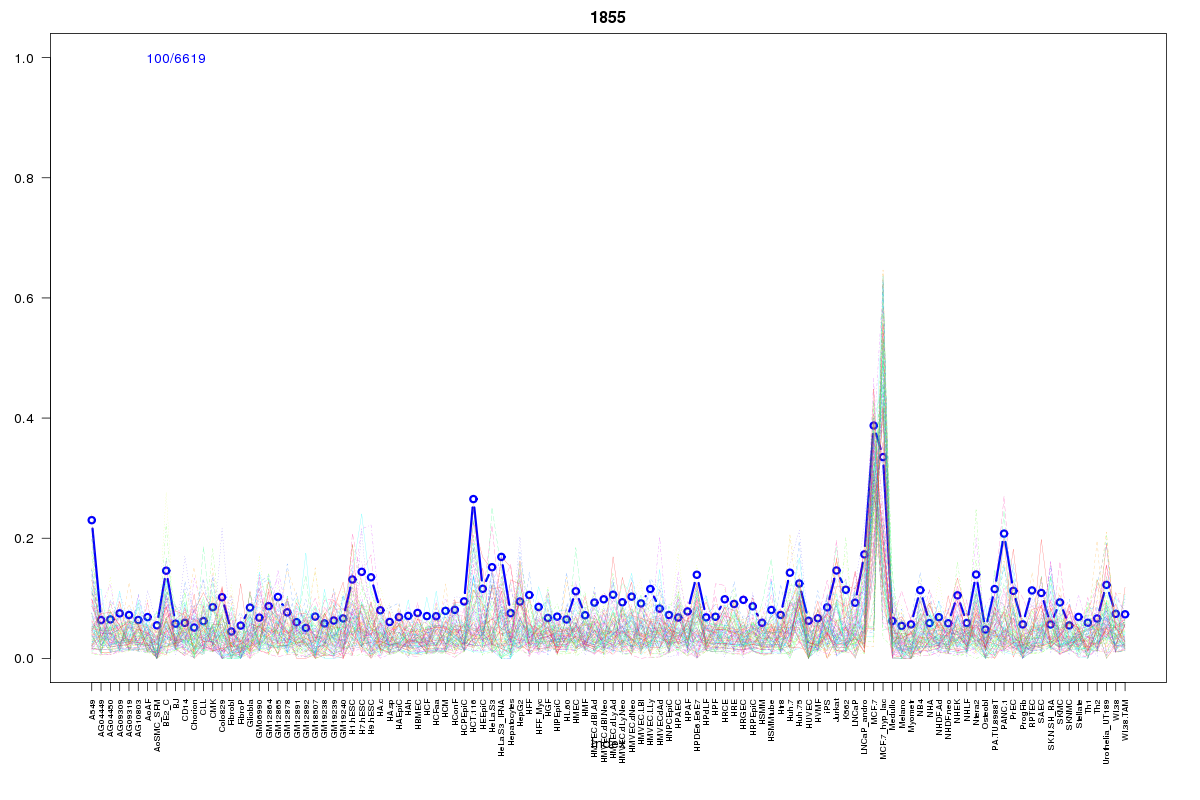 | 1855 | 1 |
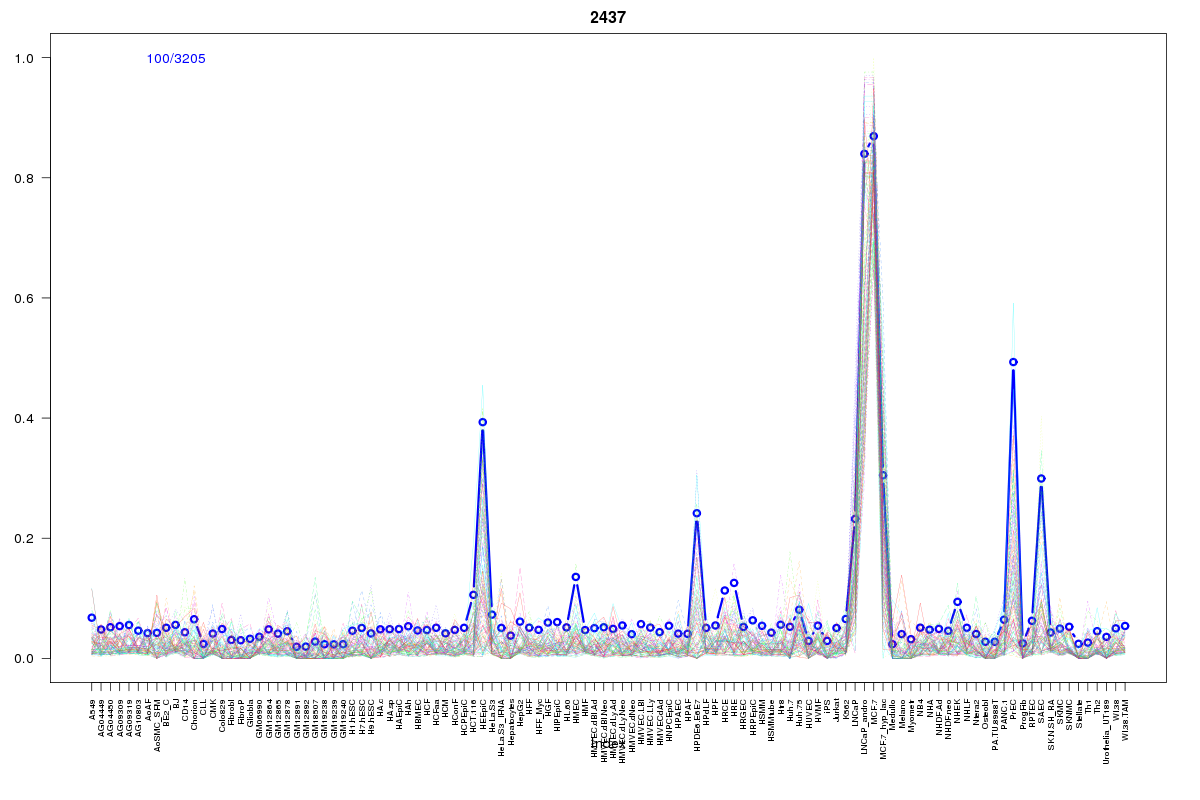 | 2437 | 1 |
 | 439 | 1 |
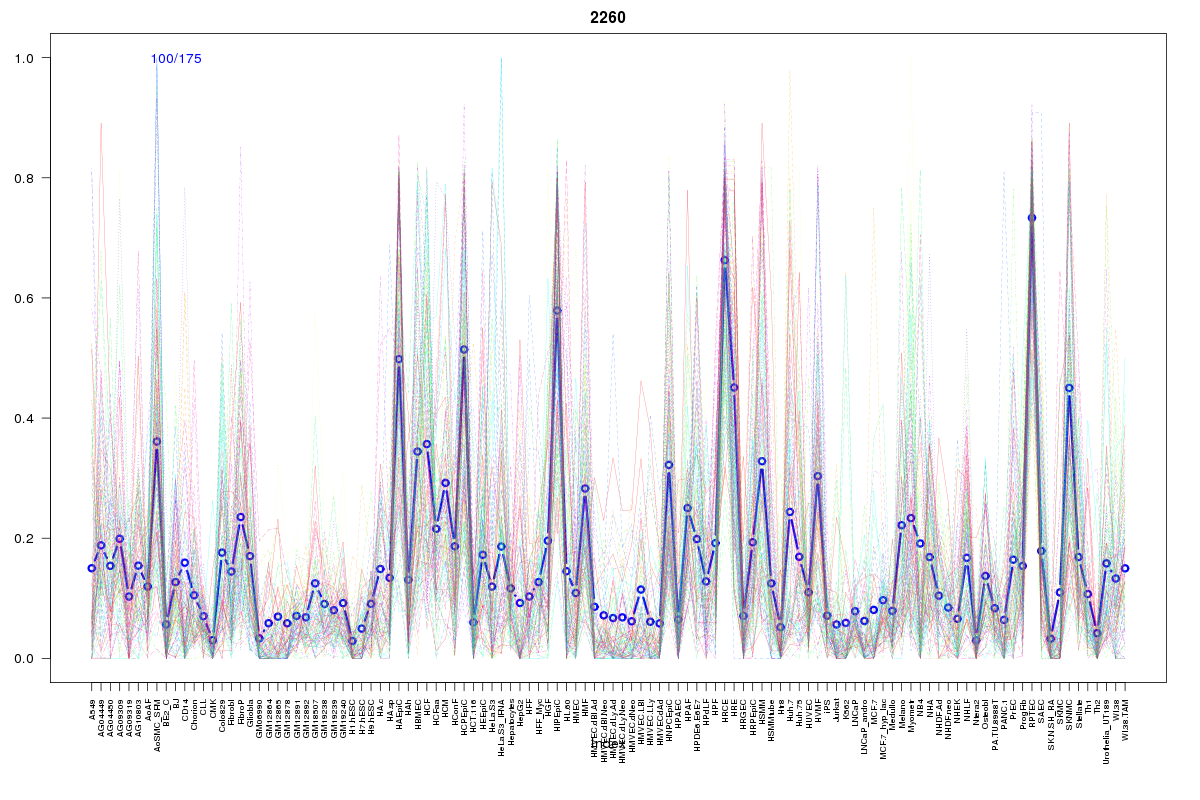 | 2260 | 1 |
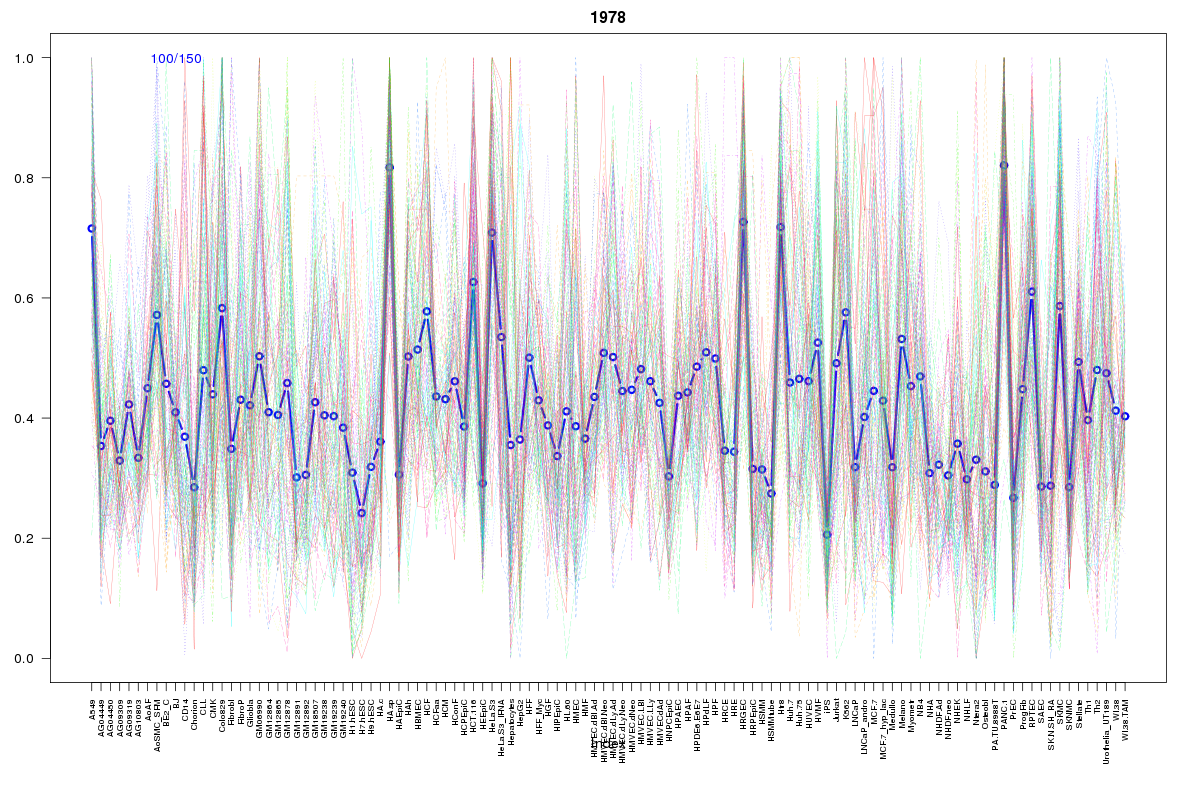 | 1978 | 1 |
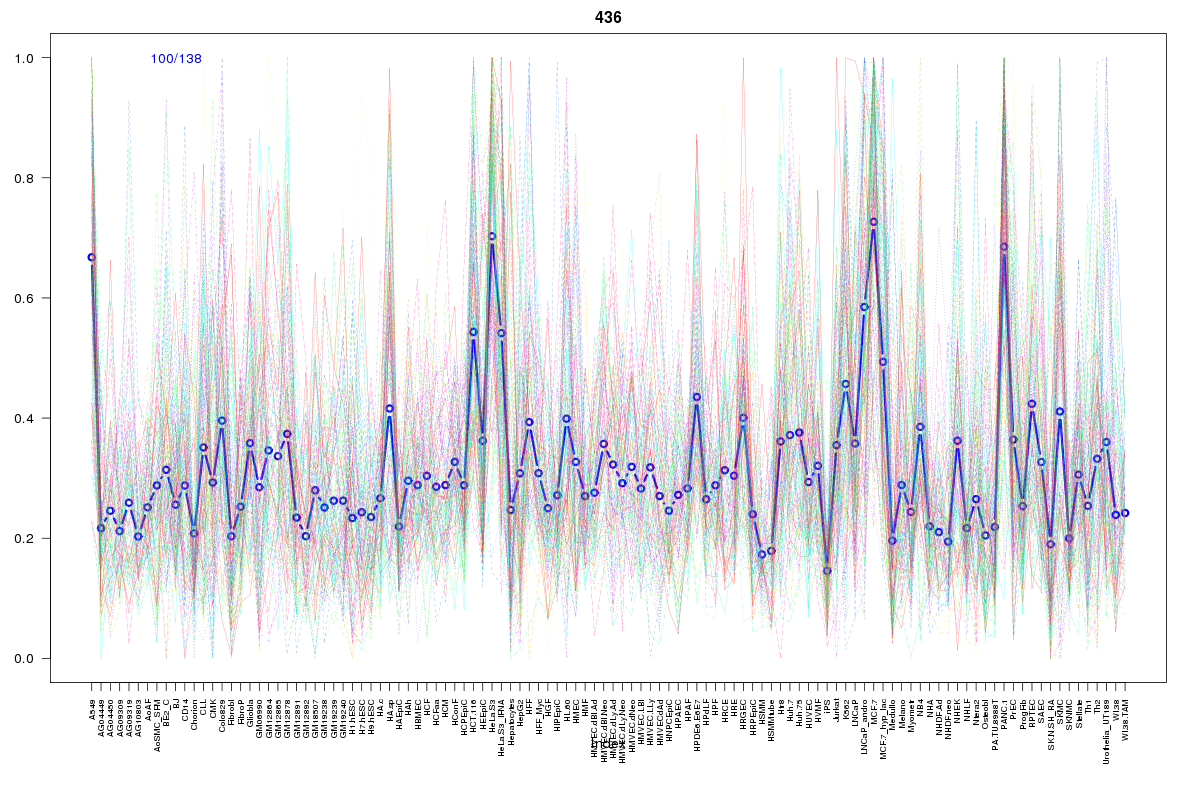 | 436 | 1 |
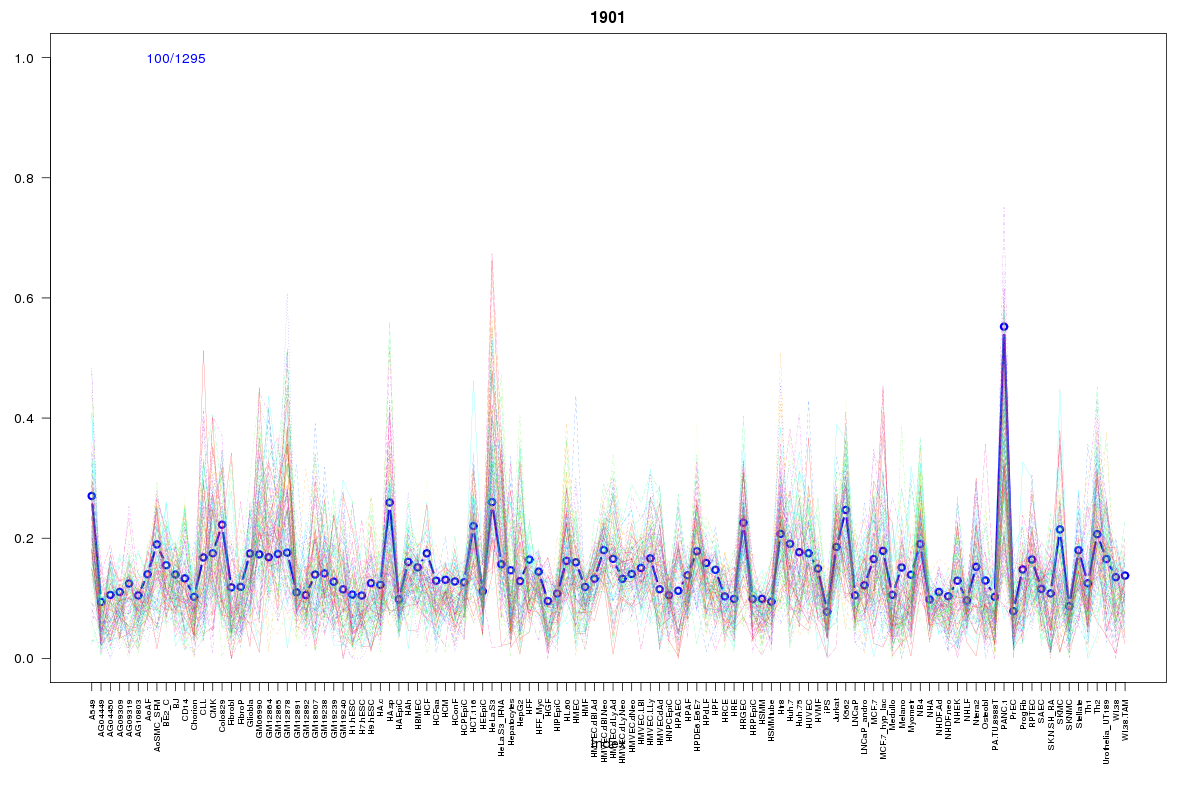 | 1901 | 1 |
 | 2017 | 1 |
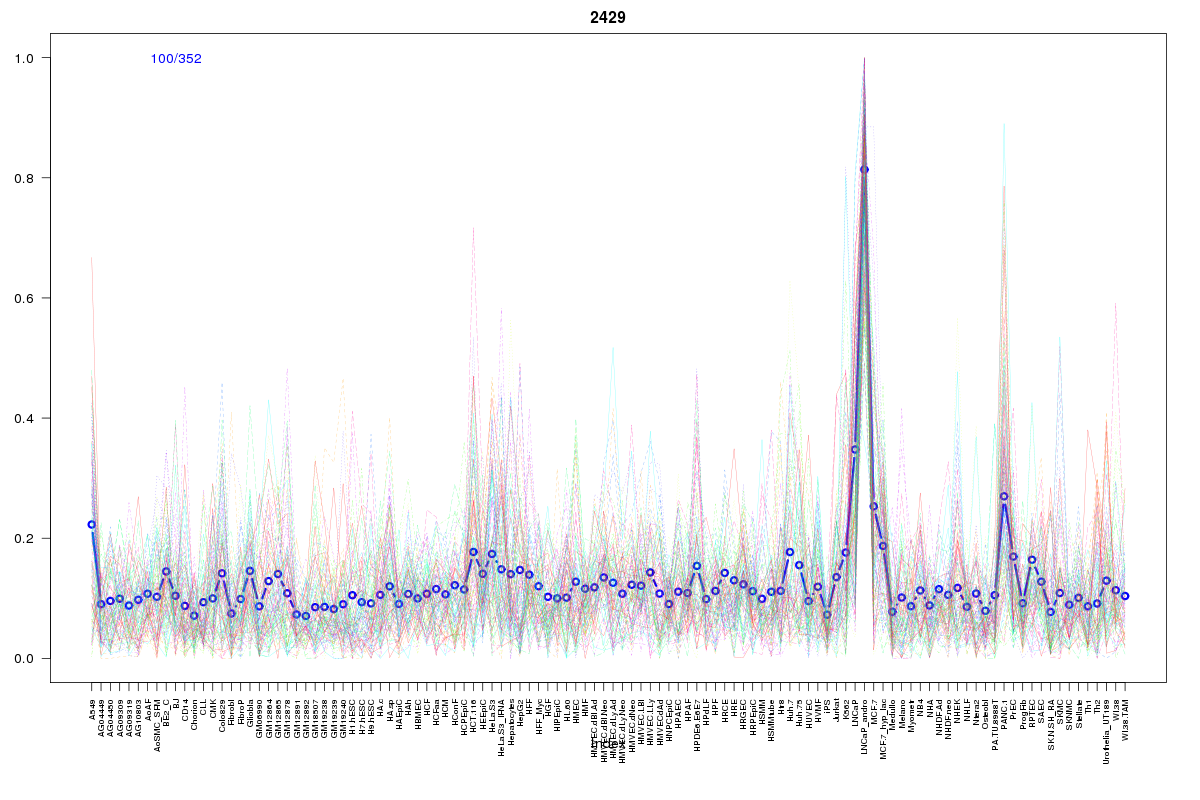 | 2429 | 1 |
 | 2195 | 1 |
Resources
BED file downloads
Connects to 23 DHS sitesTop 10 Correlated DHS Sites
p-values indiciate significant higher or lower correlation| Location | Cluster | P-value |
|---|---|---|
| chr1:215855700-215855850 | 1855 | 0 |
| chr1:215883800-215883950 | 439 | 0.002 |
| chr1:215743080-215743230 | 1777 | 0.002 |
| chr1:215741320-215741470 | 436 | 0.002 |
| chr1:215742780-215742930 | 1777 | 0.003 |
| chr1:215741620-215741770 | 1901 | 0.003 |
| chr1:215838620-215838770 | 2458 | 0.005 |
| chr1:215743840-215743990 | 2429 | 0.005 |
| chr1:215740365-215740515 | 1978 | 0.005 |
| chr1:215713280-215713430 | 2380 | 0.006 |
| chr1:215649620-215649770 | 2445 | 0.006 |
External Databases
UCSCEnsembl (ENSG00000136636)