Gene: TMOD1
chr9: 100263461-100364023Expression Profile
(log scale)
Graphical Connections
Distribution of linked clusters:
You may find it interesting if many of the connected DHS sites belong to the same cluster.| Cluster Profile | Cluster ID | Number of DHS sites in this cluster |
|---|---|---|
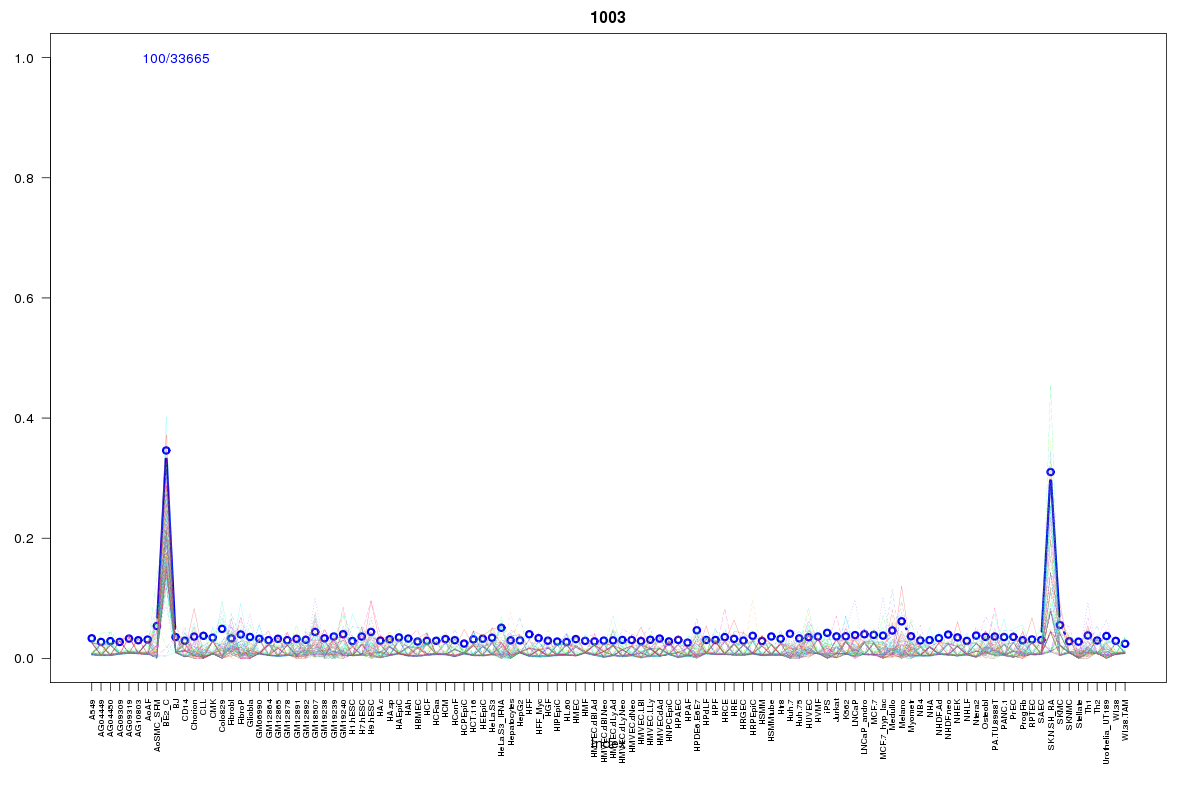 | 1003 | 6 |
 | 1401 | 4 |
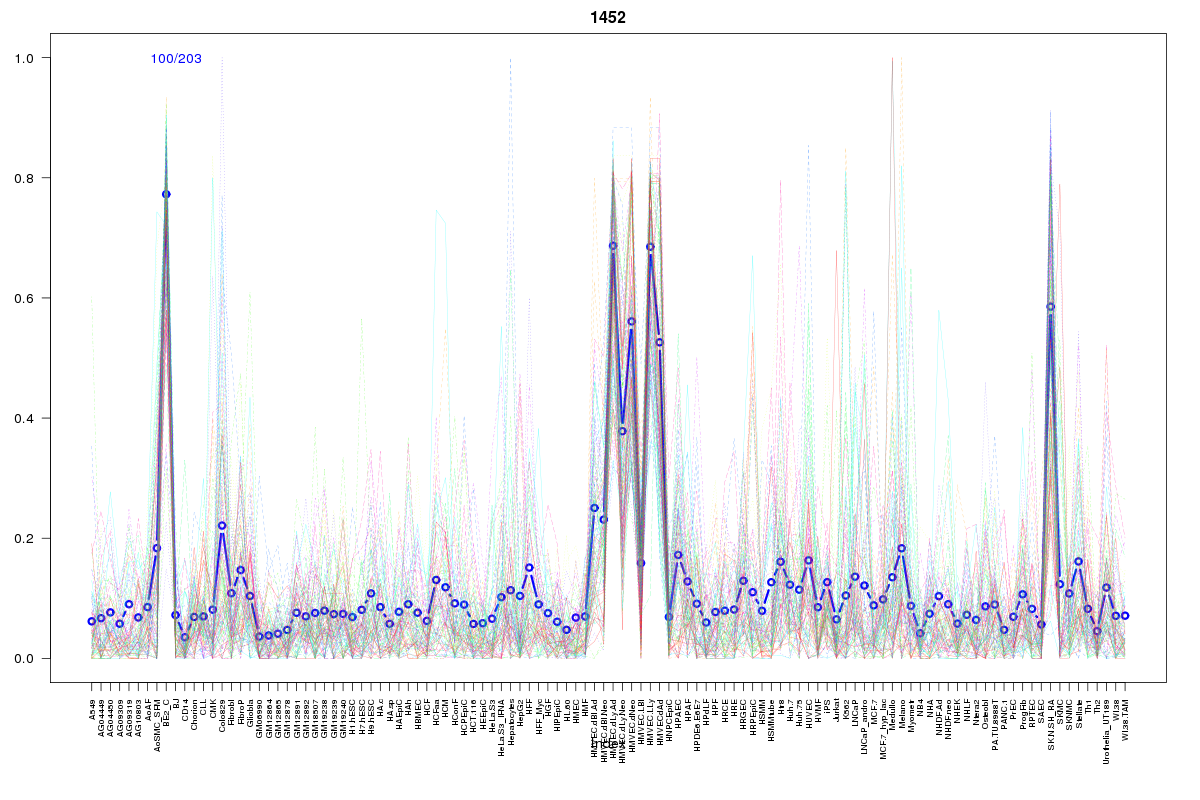 | 1452 | 3 |
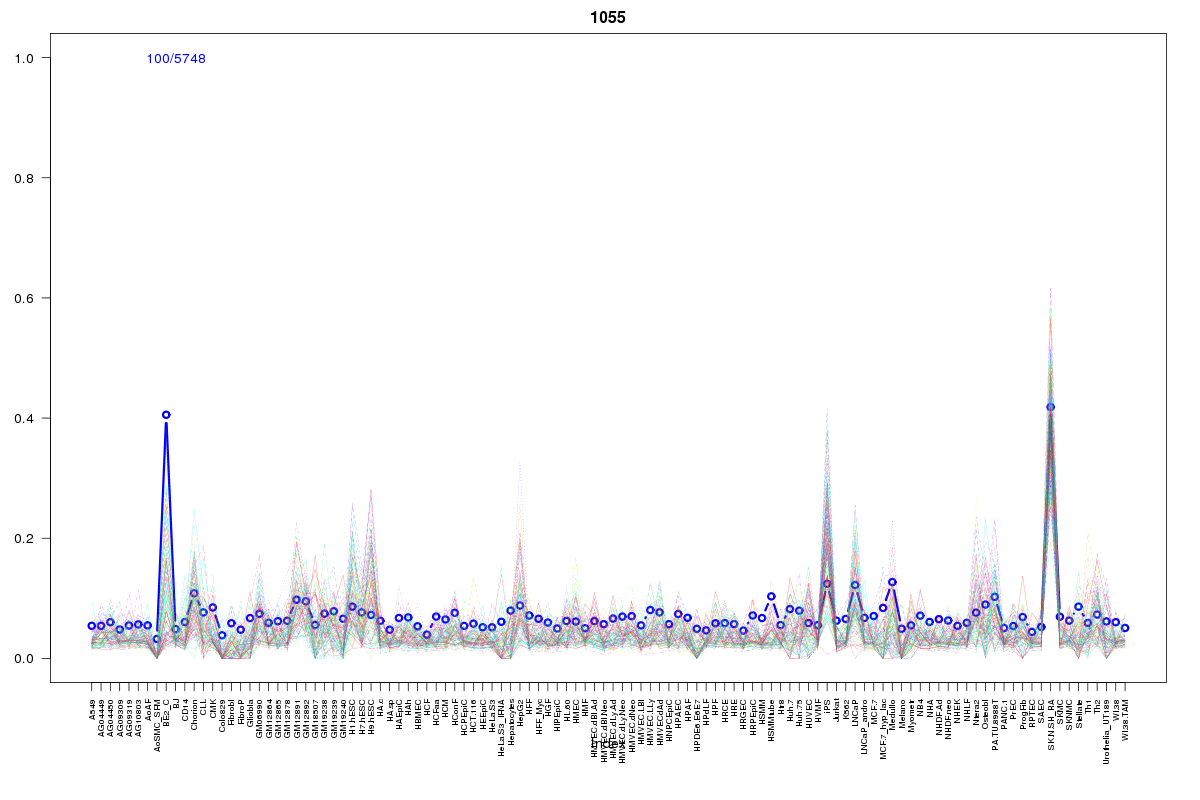 | 1055 | 2 |
 | 927 | 1 |
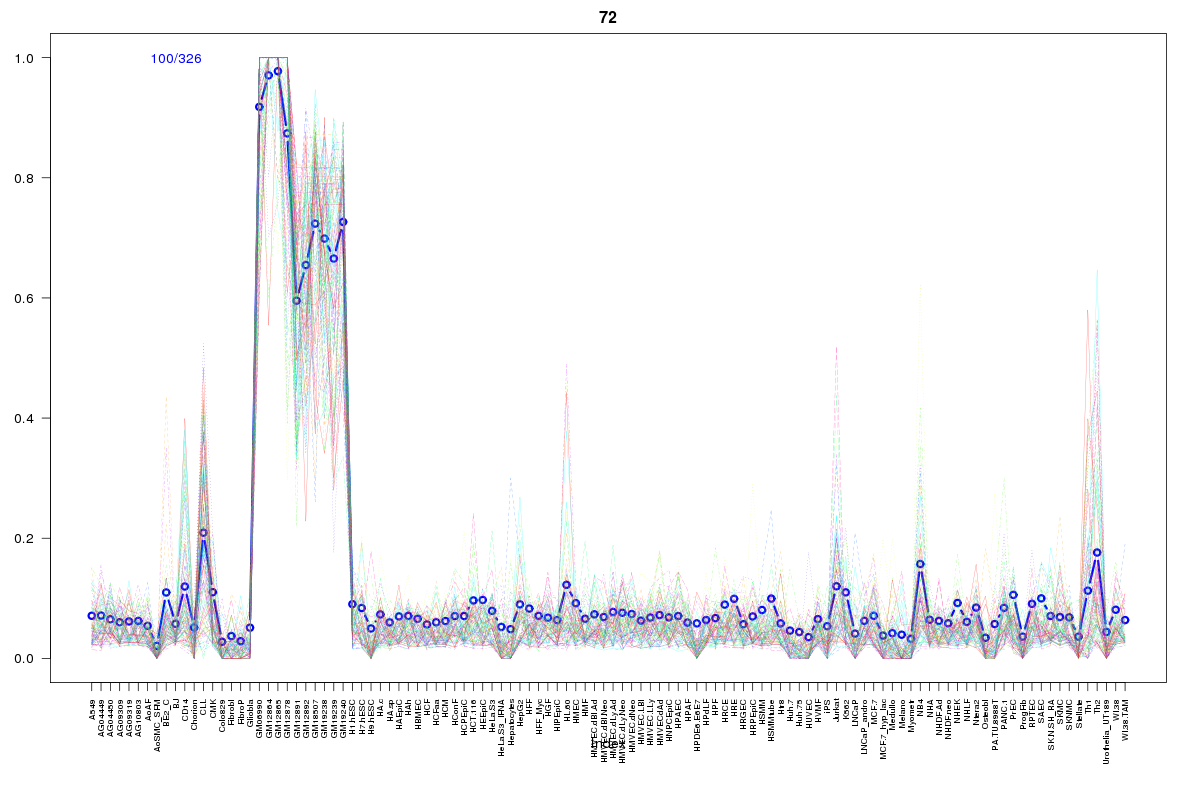 | 72 | 1 |
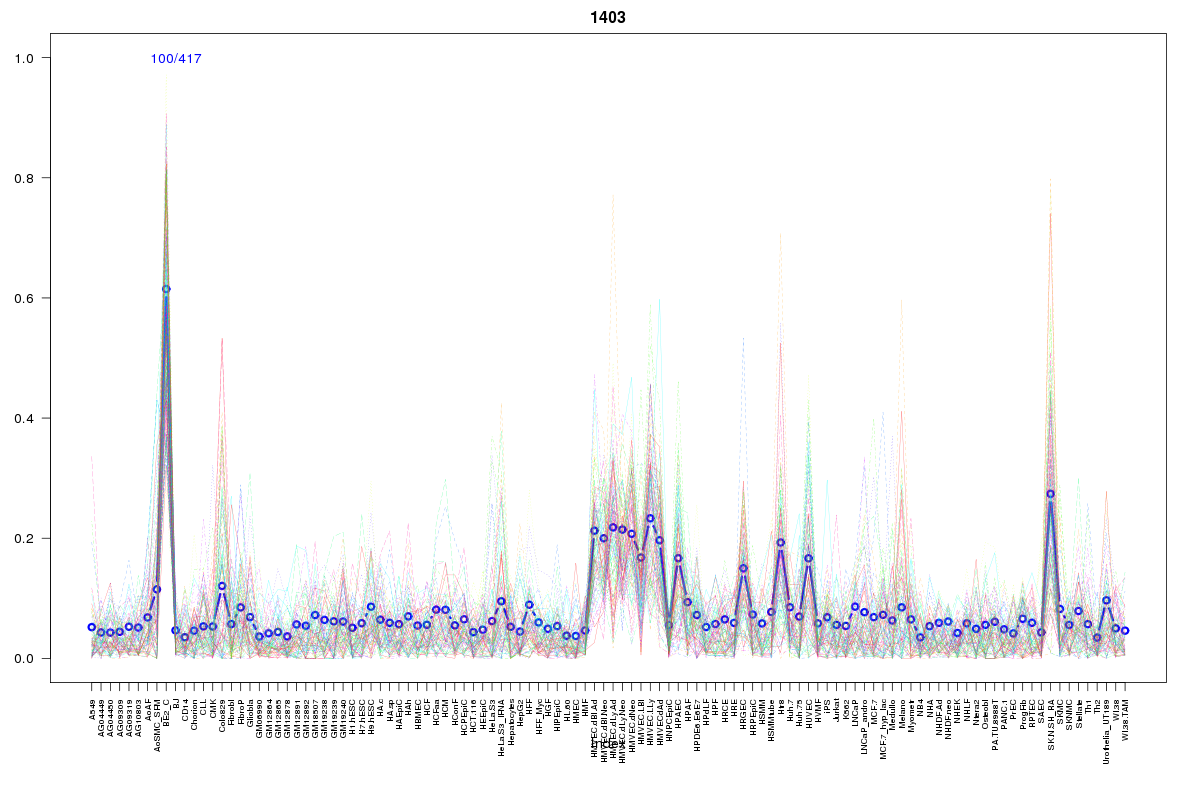 | 1403 | 1 |
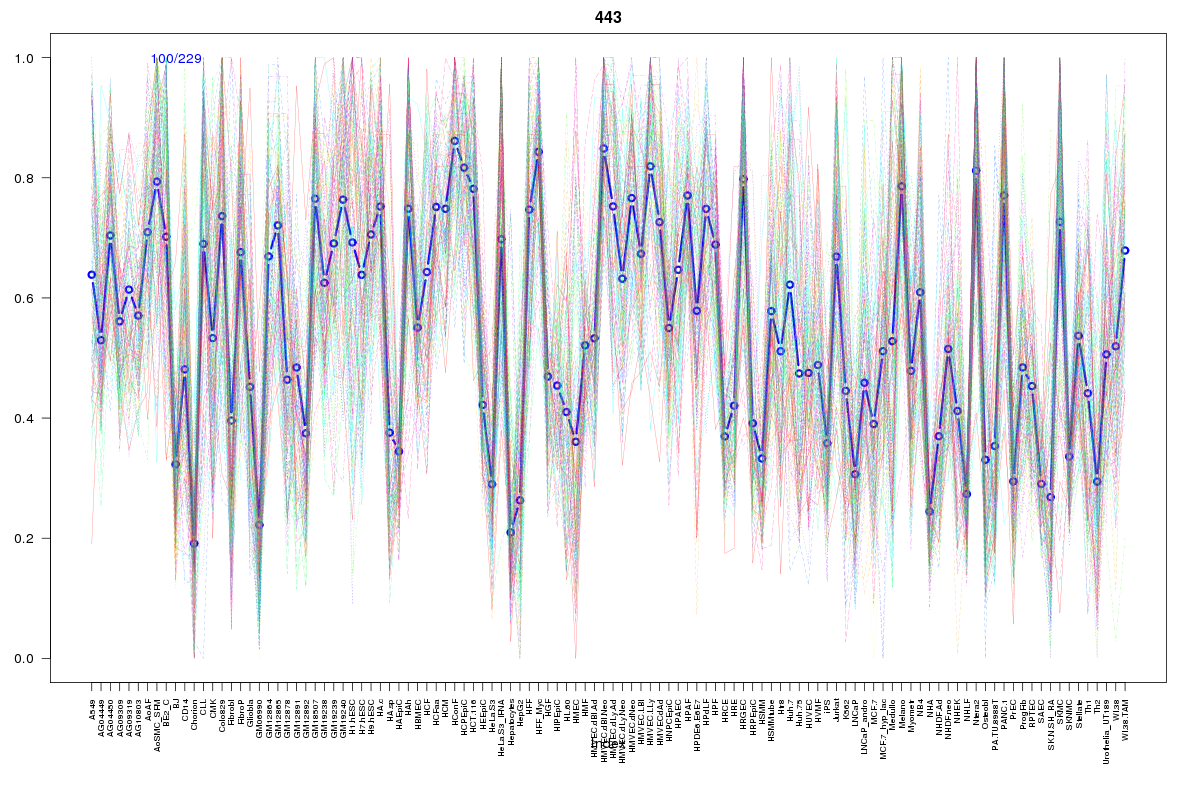 | 443 | 1 |
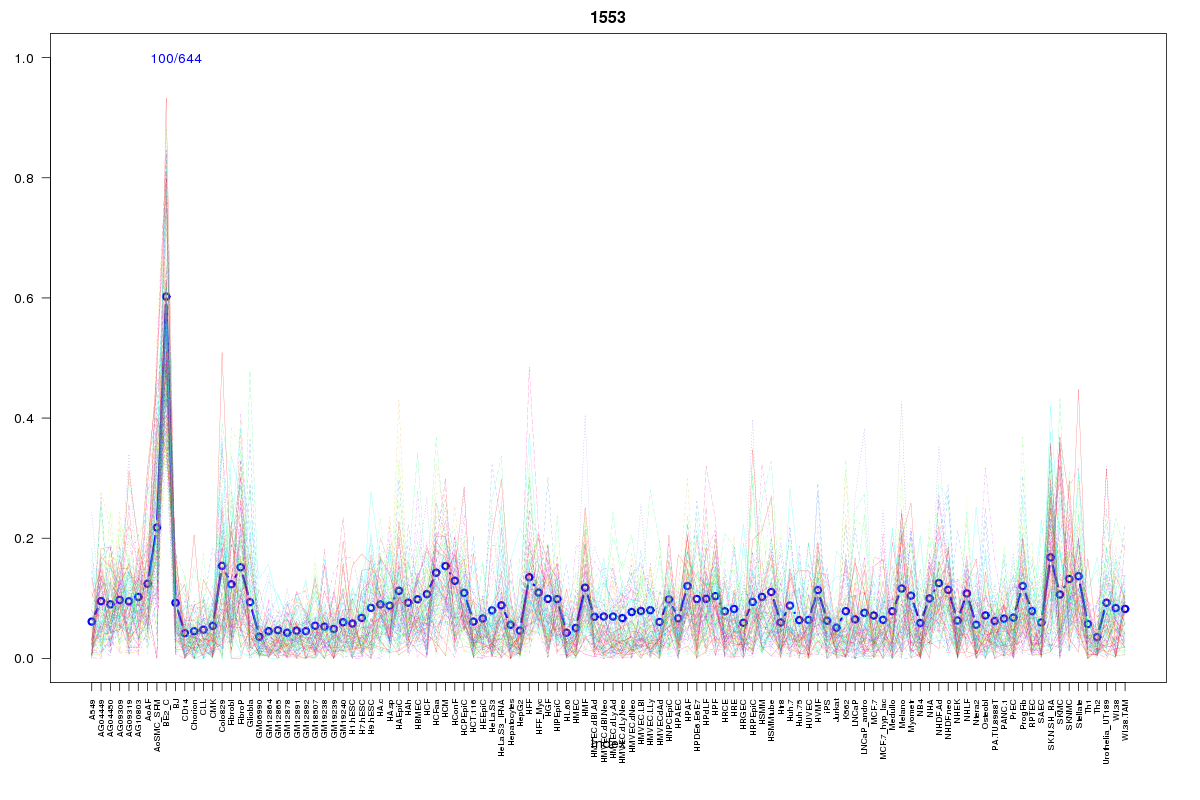 | 1553 | 1 |
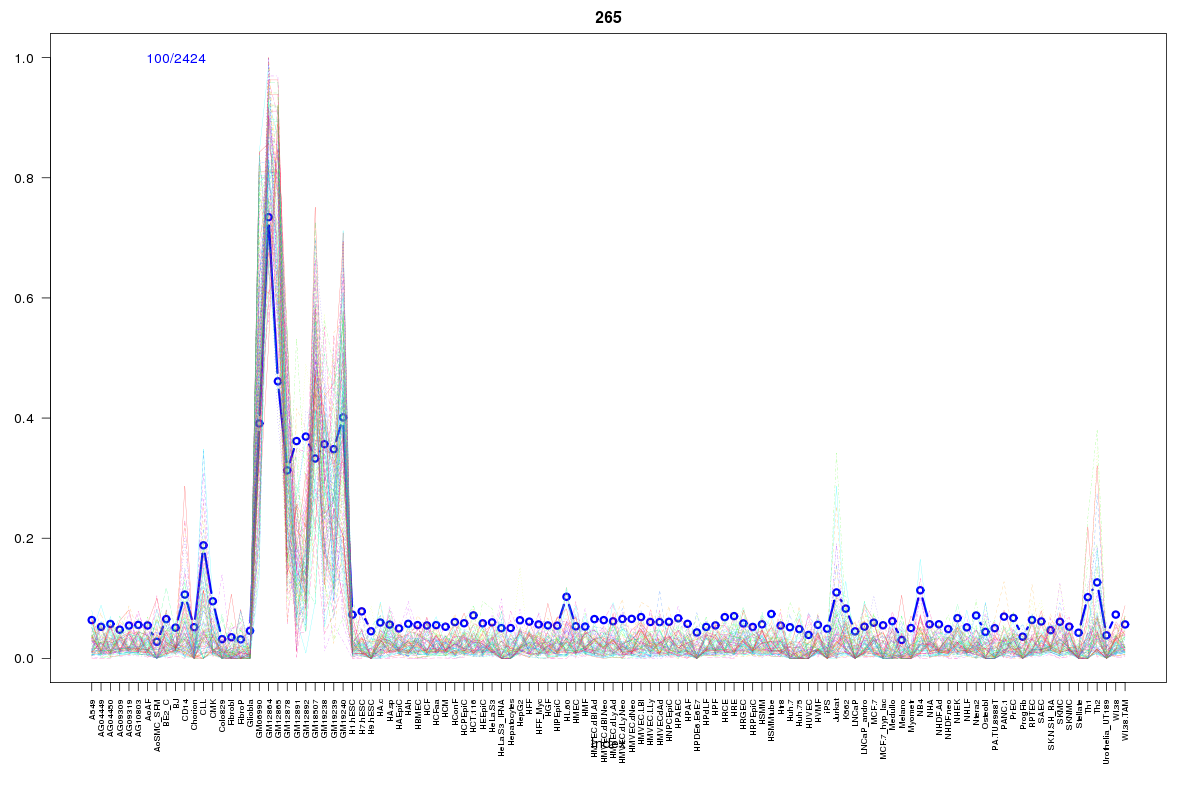 | 265 | 1 |
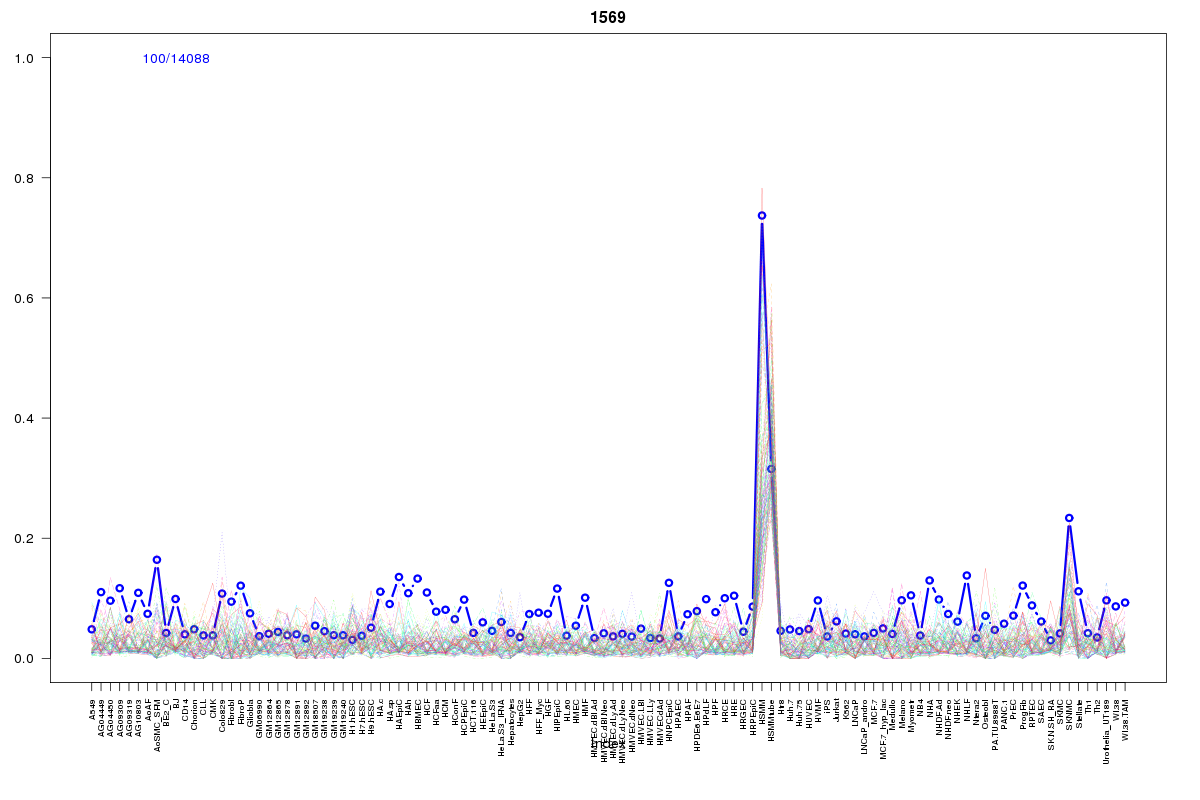 | 1569 | 1 |
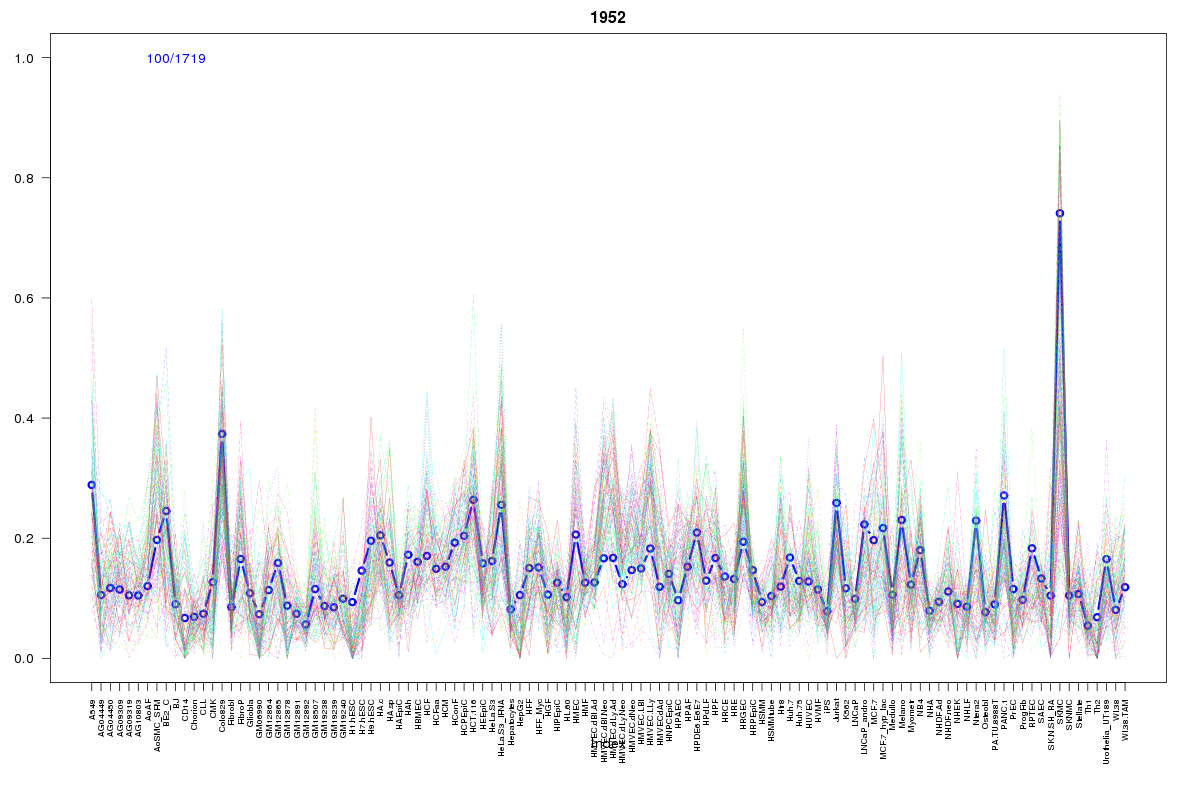 | 1952 | 1 |
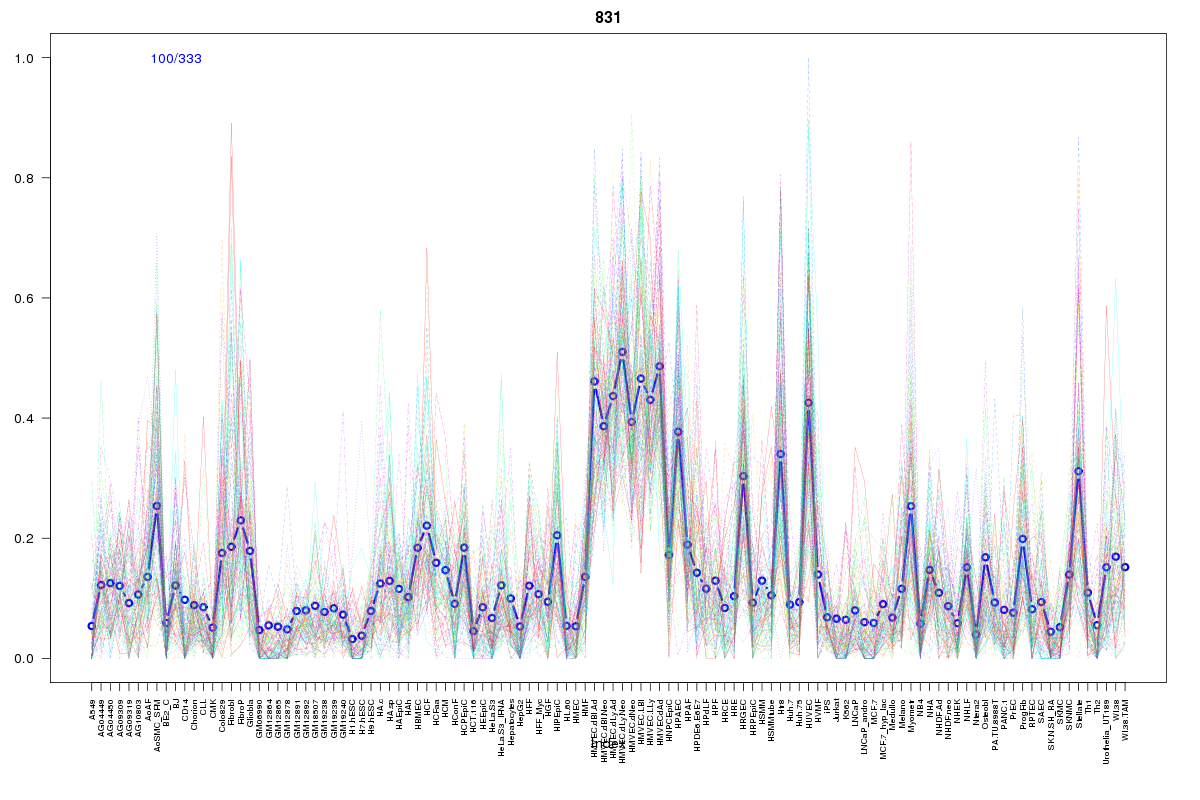 | 831 | 1 |
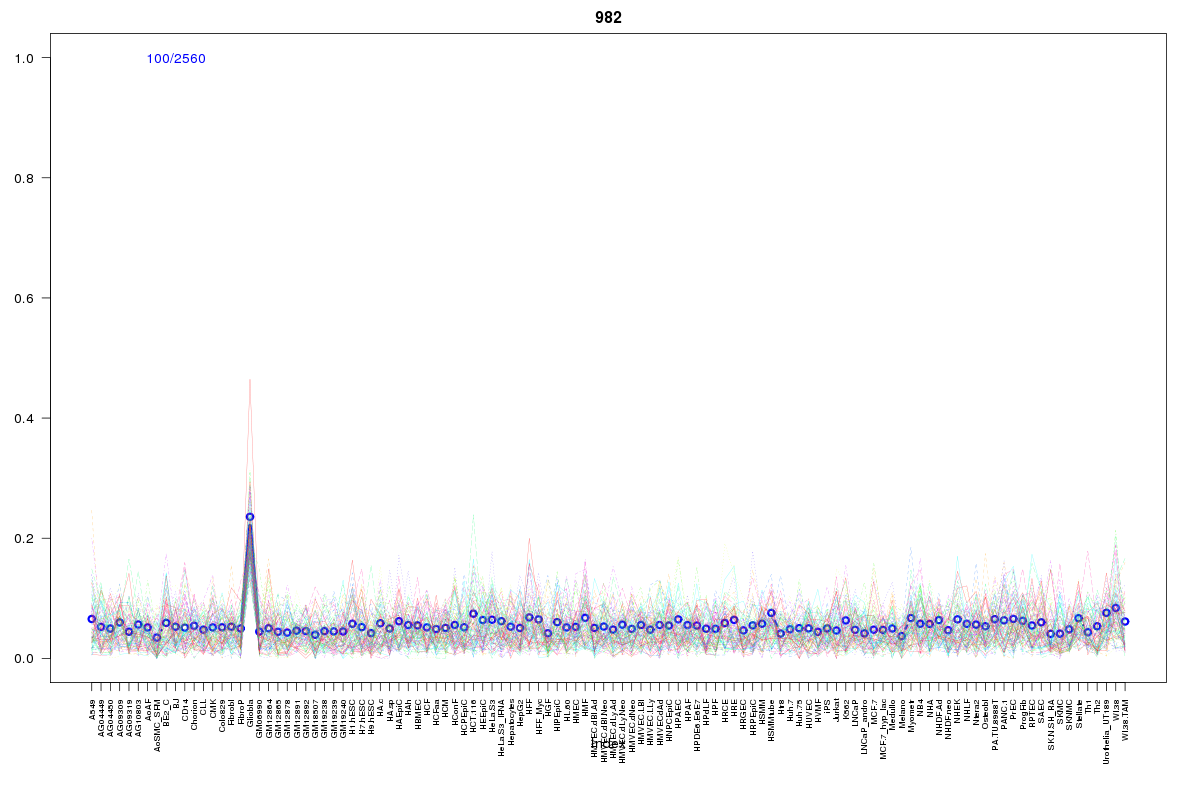 | 982 | 1 |
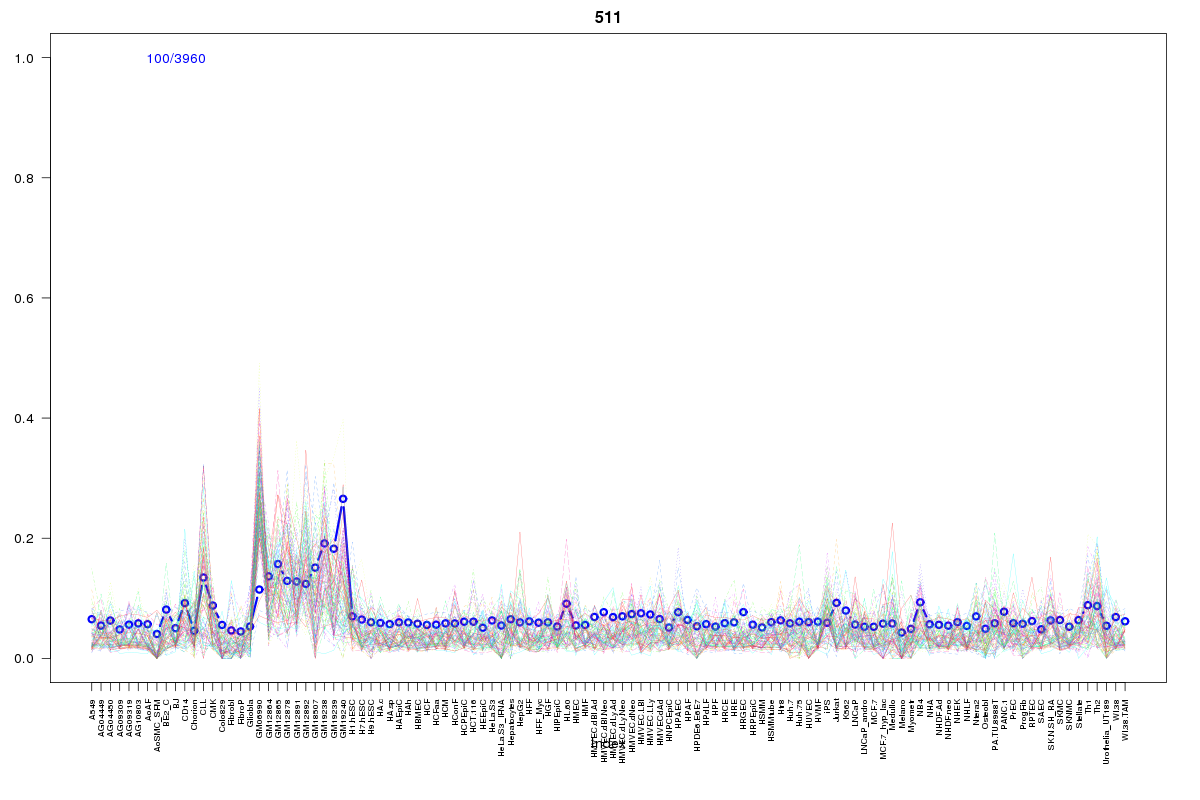 | 511 | 1 |
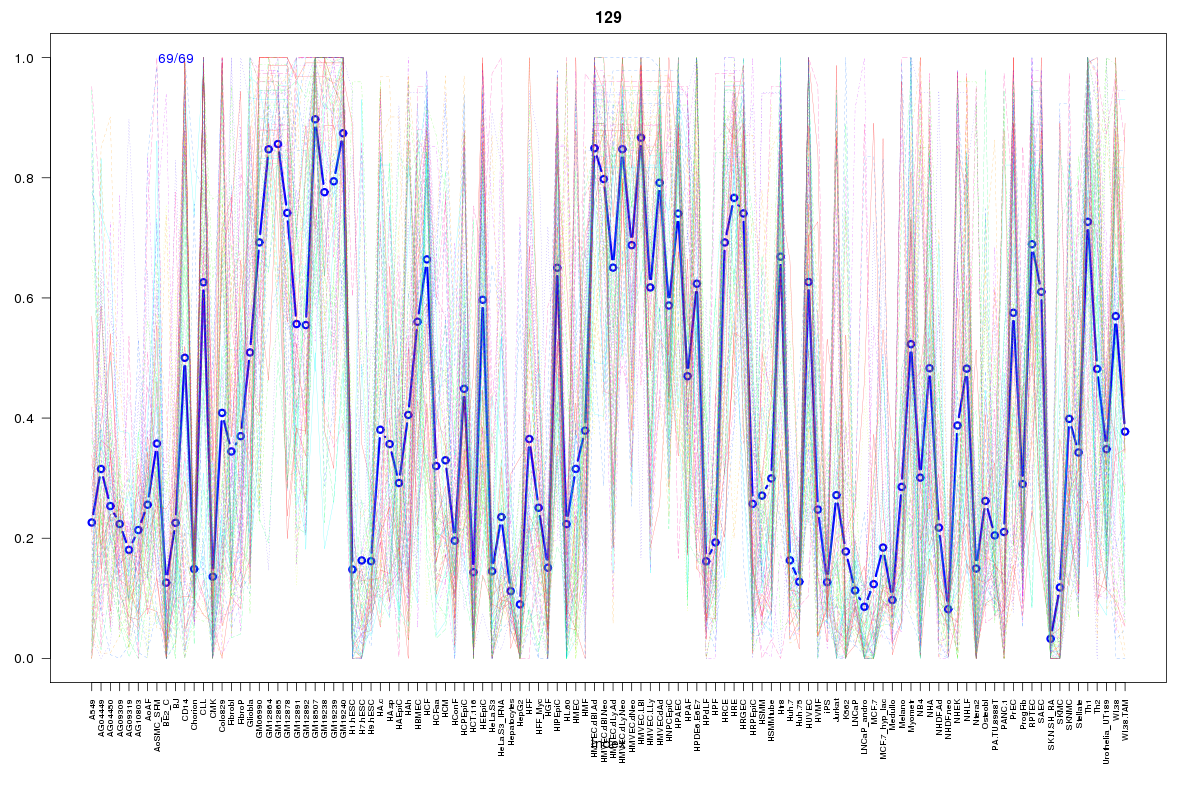 | 129 | 1 |
 | 518 | 1 |
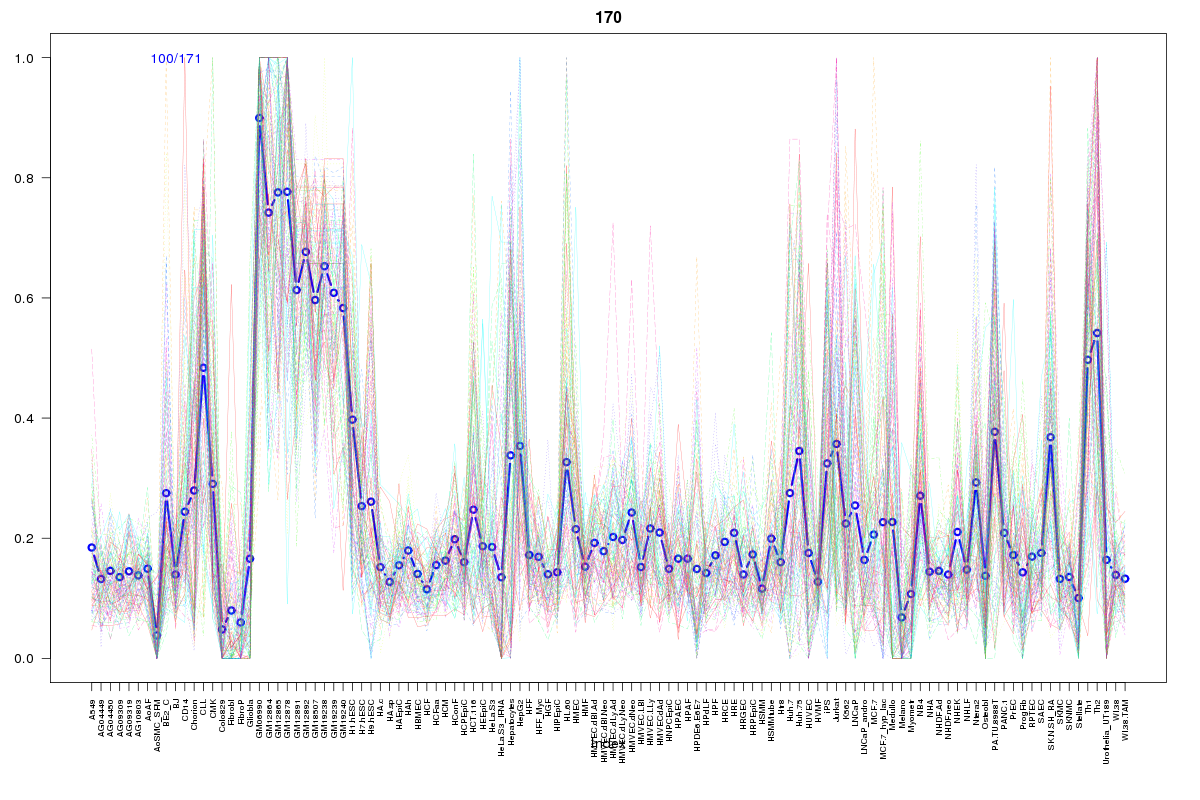 | 170 | 1 |
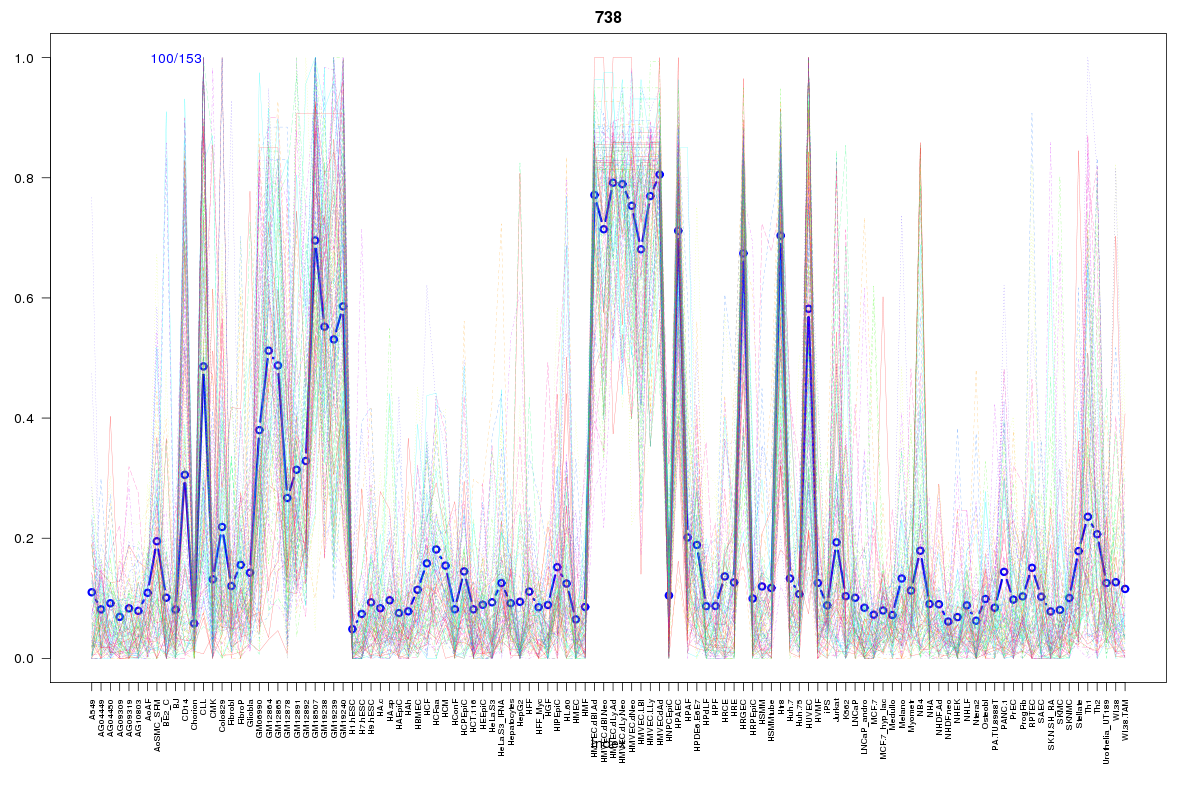 | 738 | 1 |
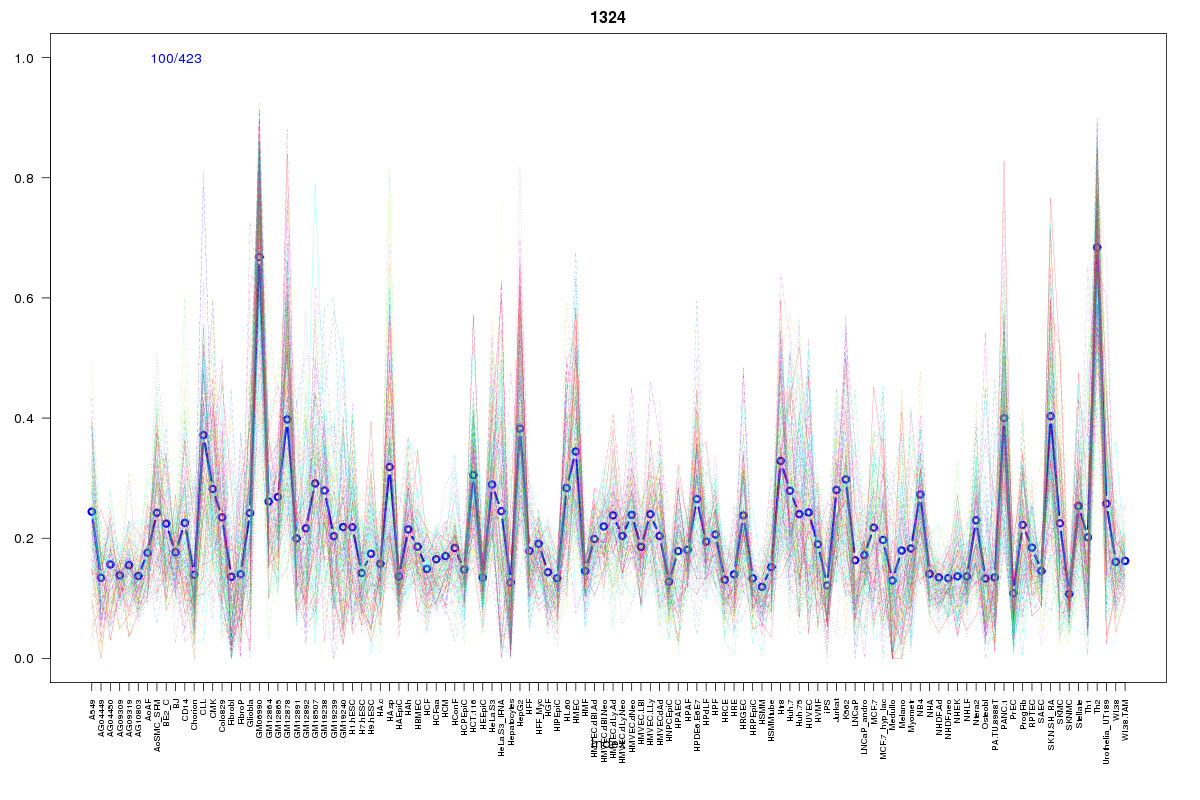 | 1324 | 1 |
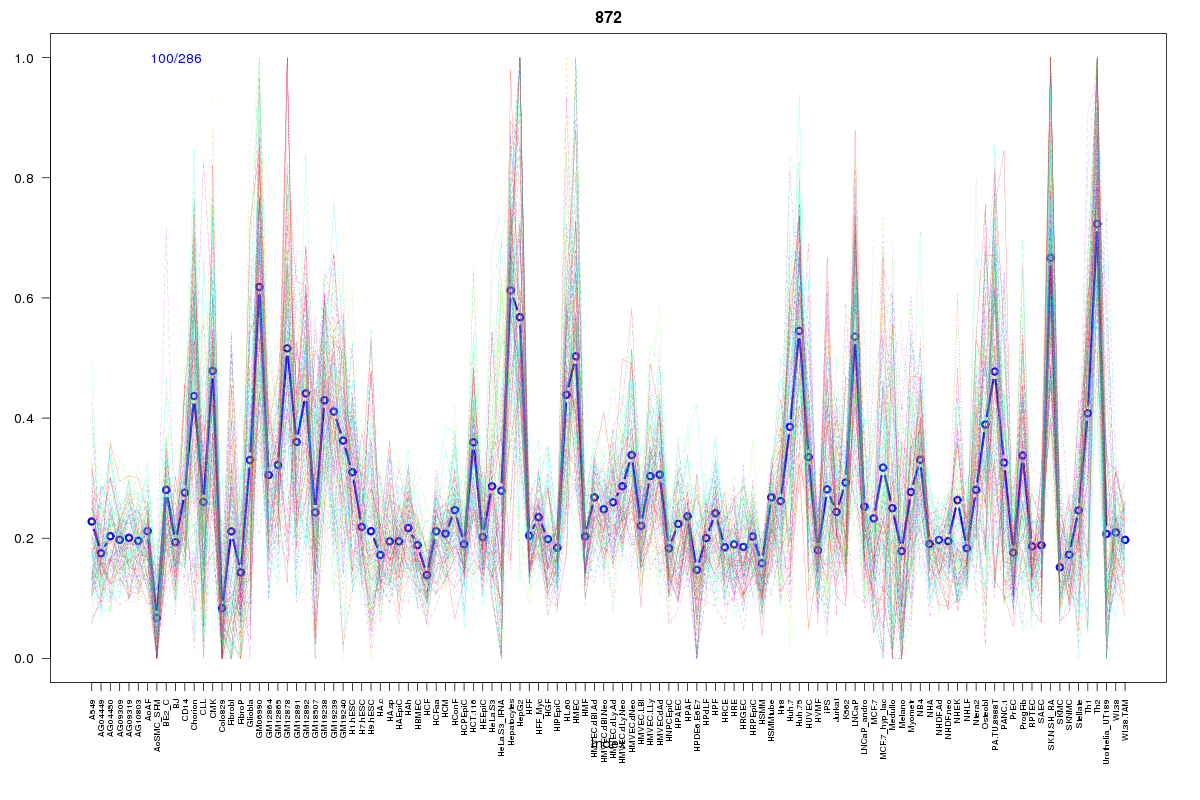 | 872 | 1 |
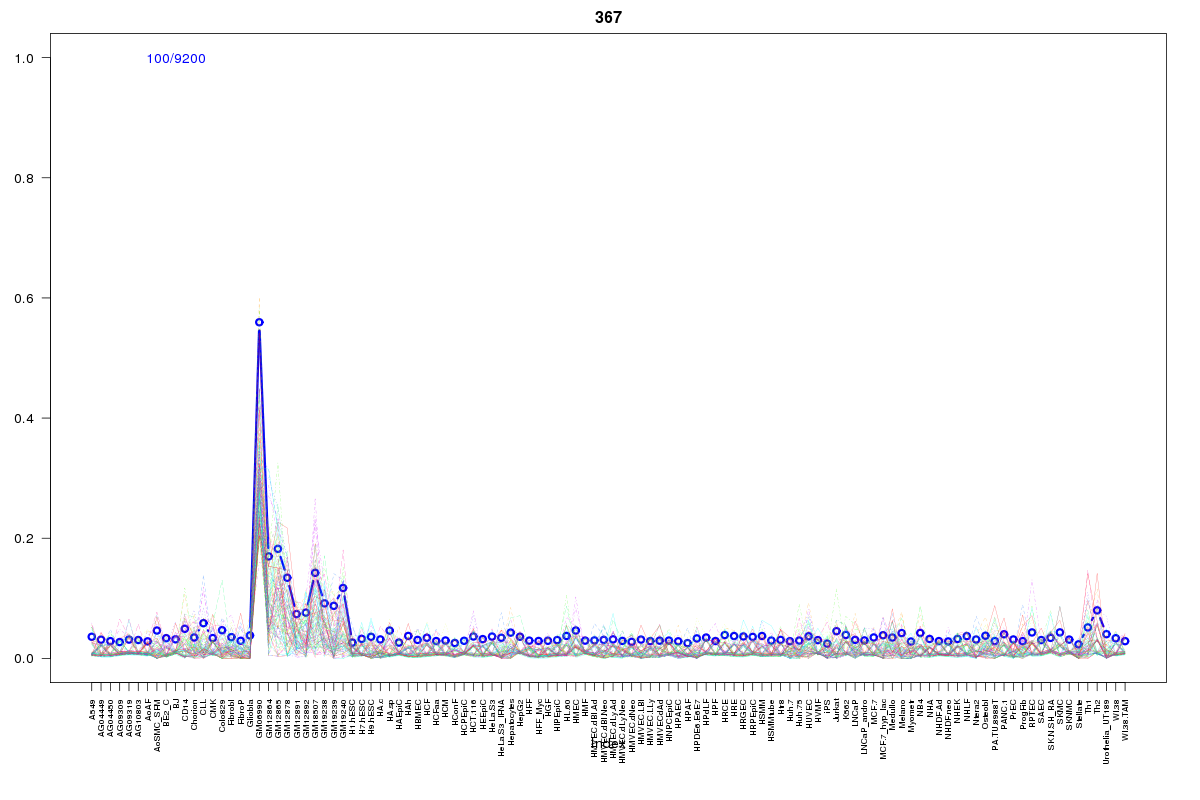 | 367 | 1 |
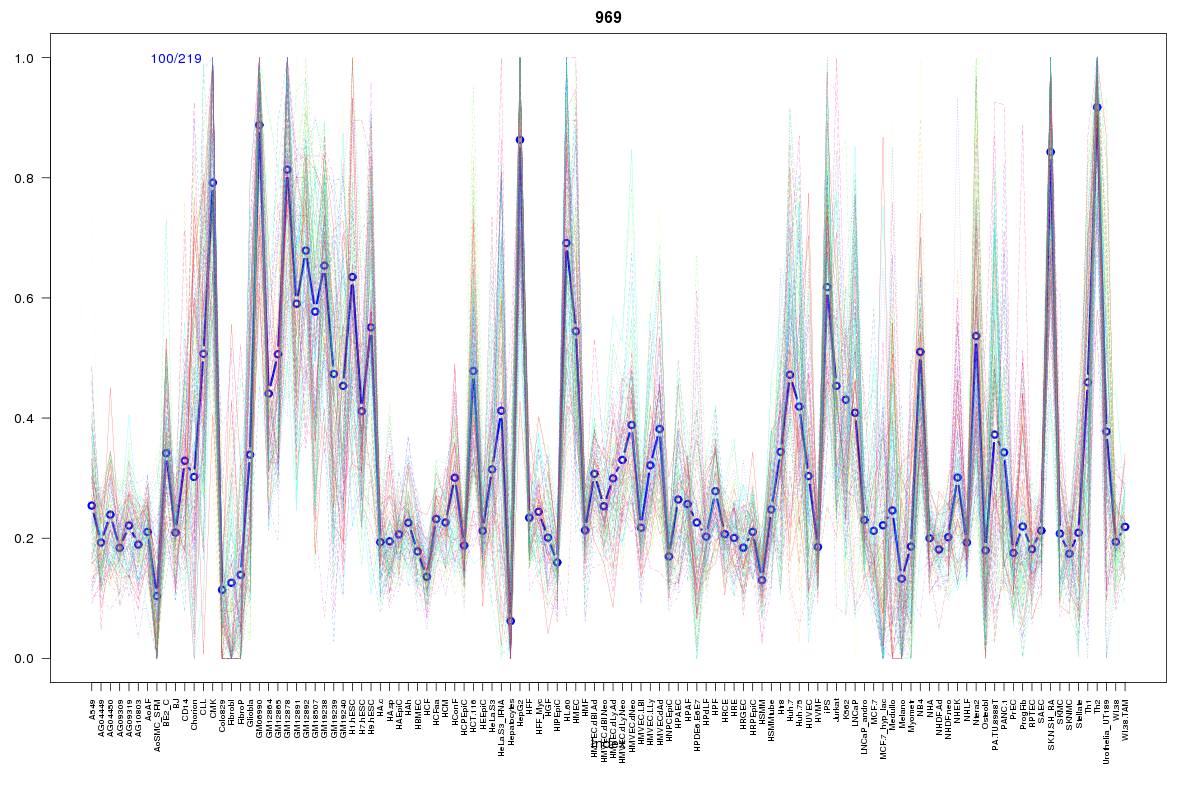 | 969 | 1 |
 | 251 | 1 |
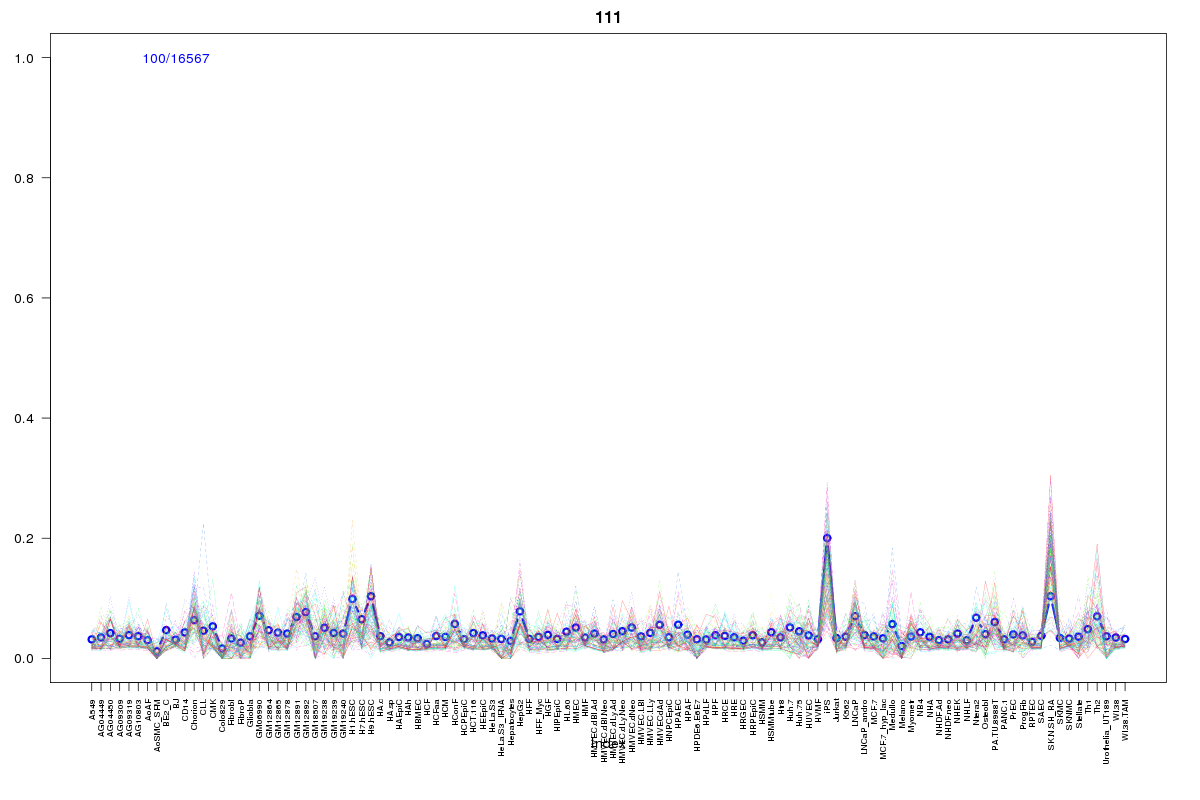 | 111 | 1 |
 | 604 | 1 |
 | 1721 | 1 |
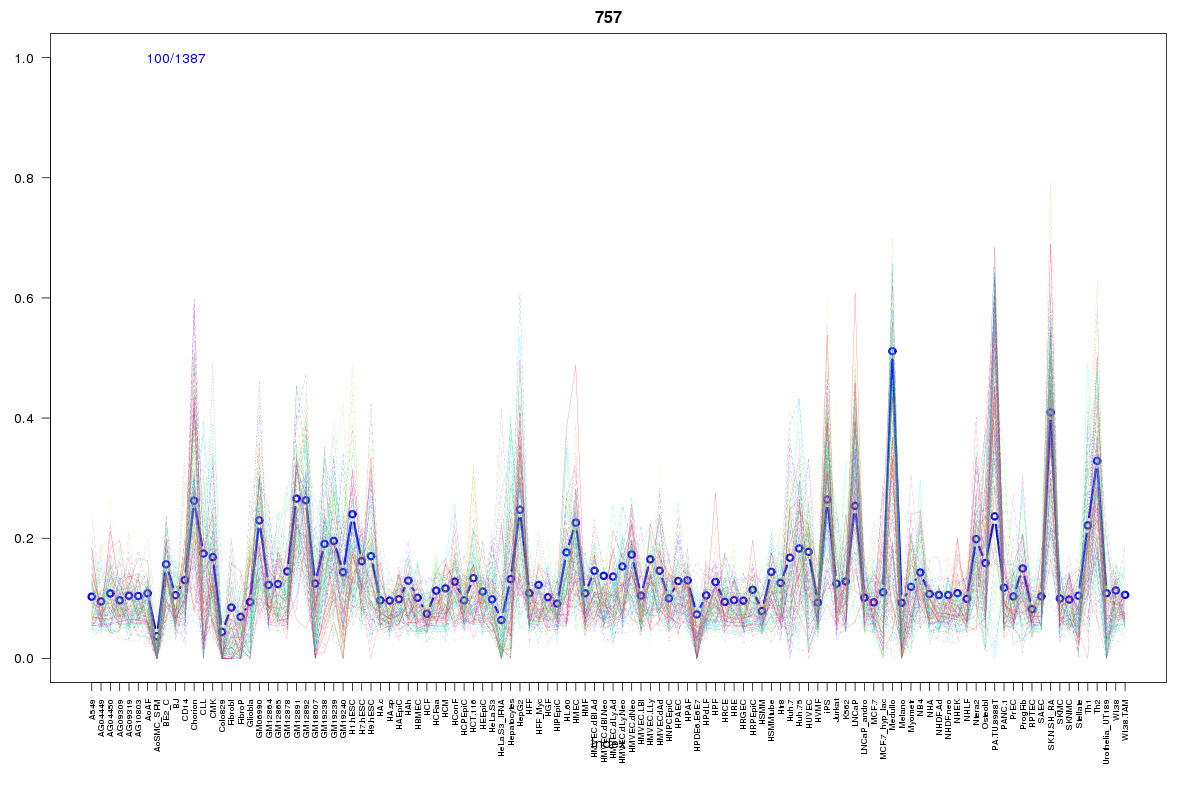 | 757 | 1 |
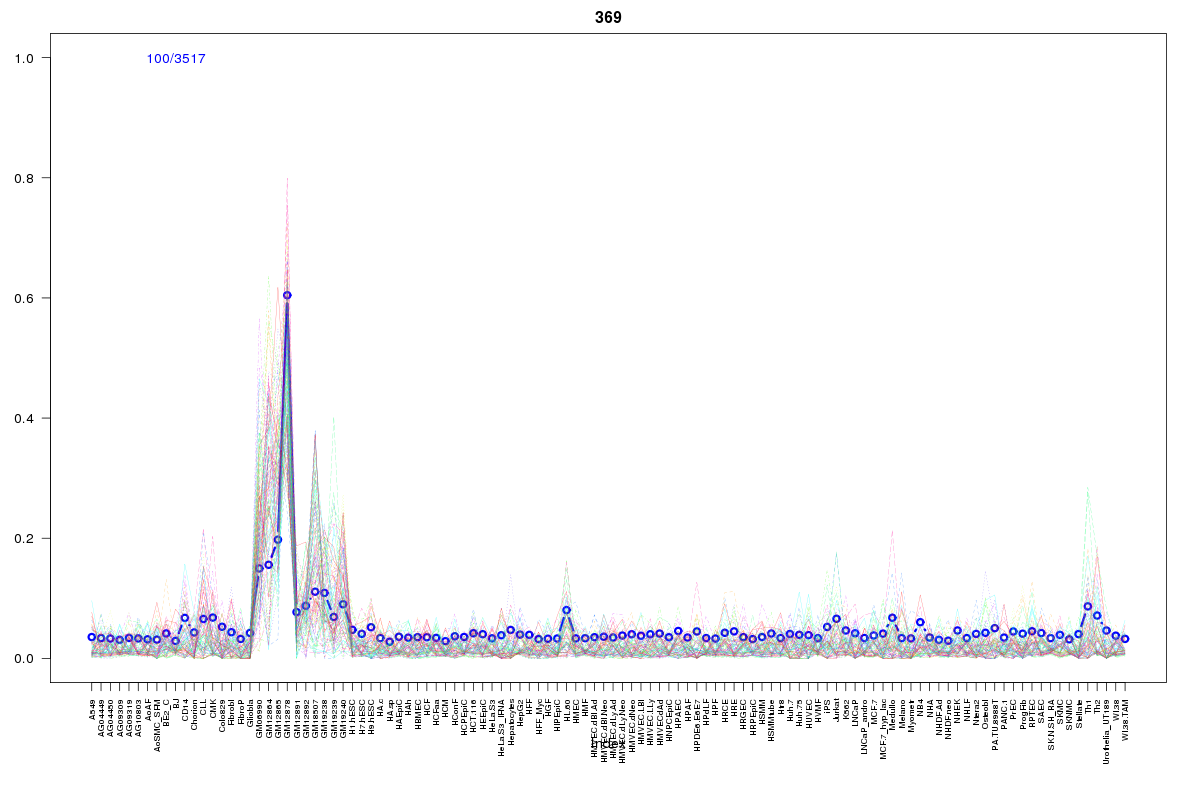 | 369 | 1 |
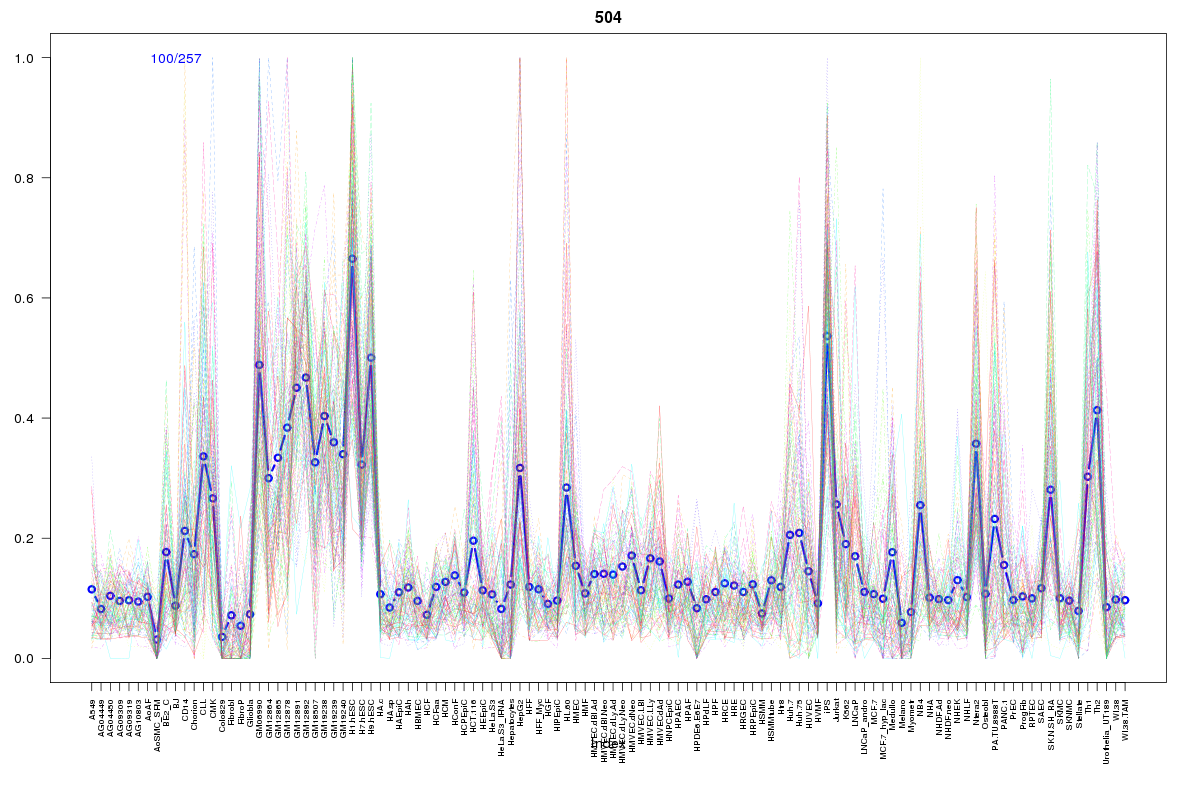 | 504 | 1 |
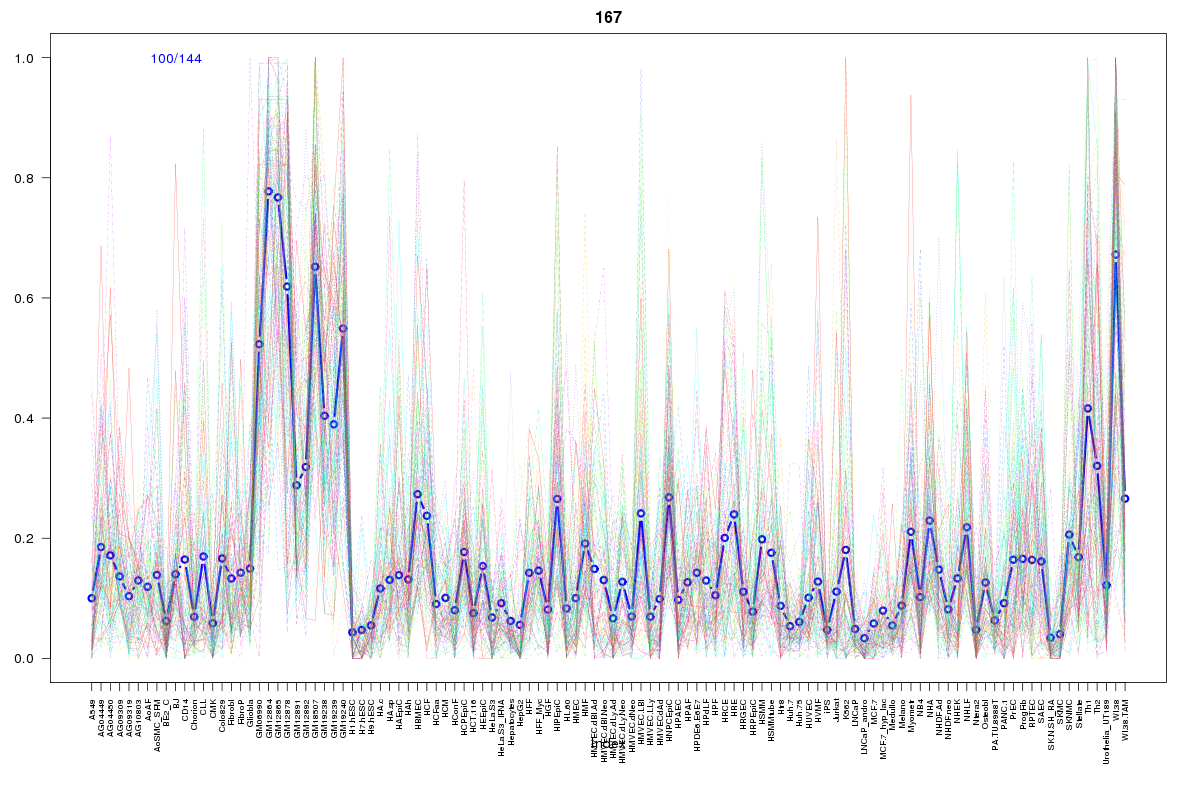 | 167 | 1 |
 | 2122 | 1 |
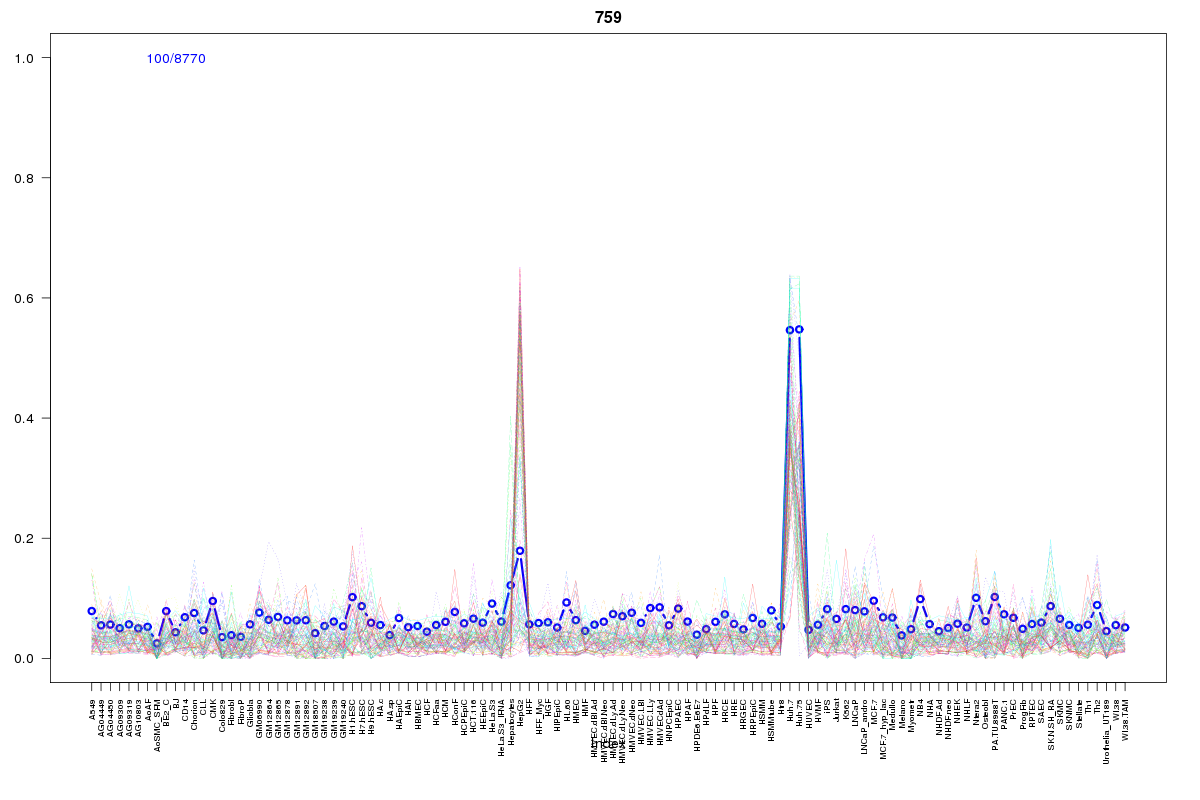 | 759 | 1 |
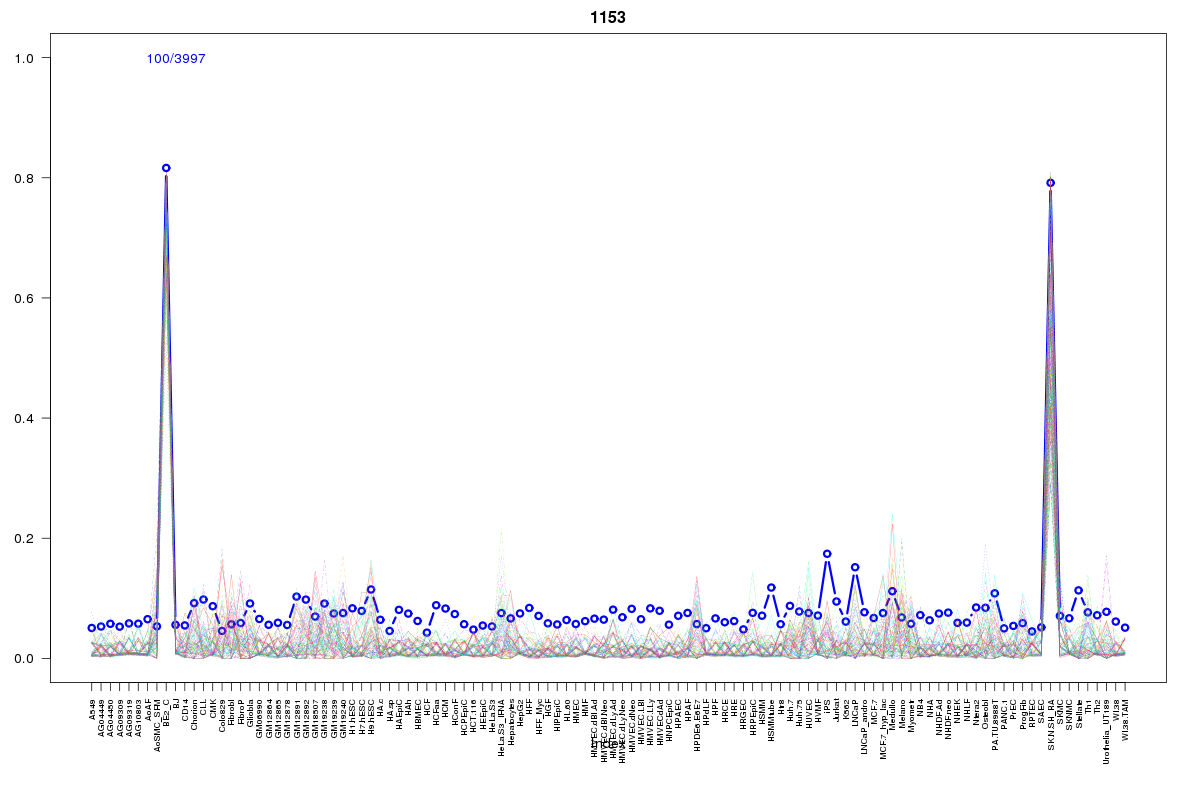 | 1153 | 1 |
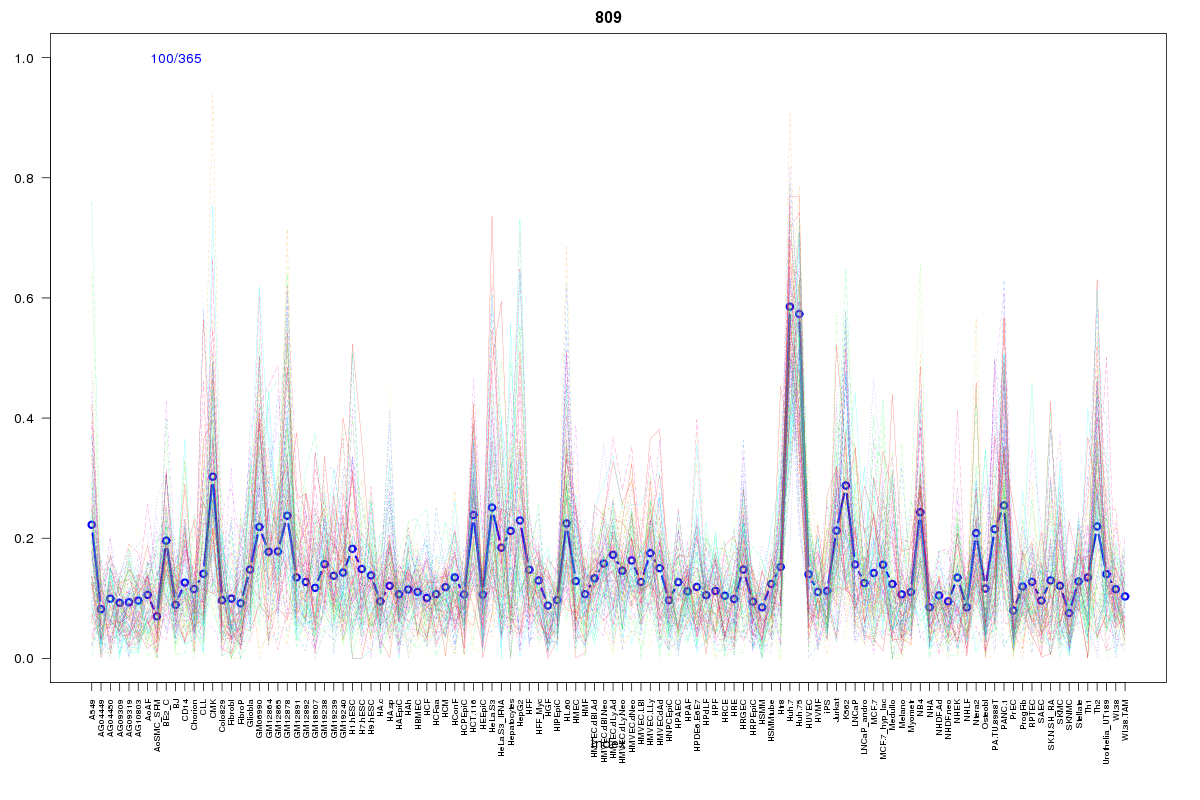 | 809 | 1 |
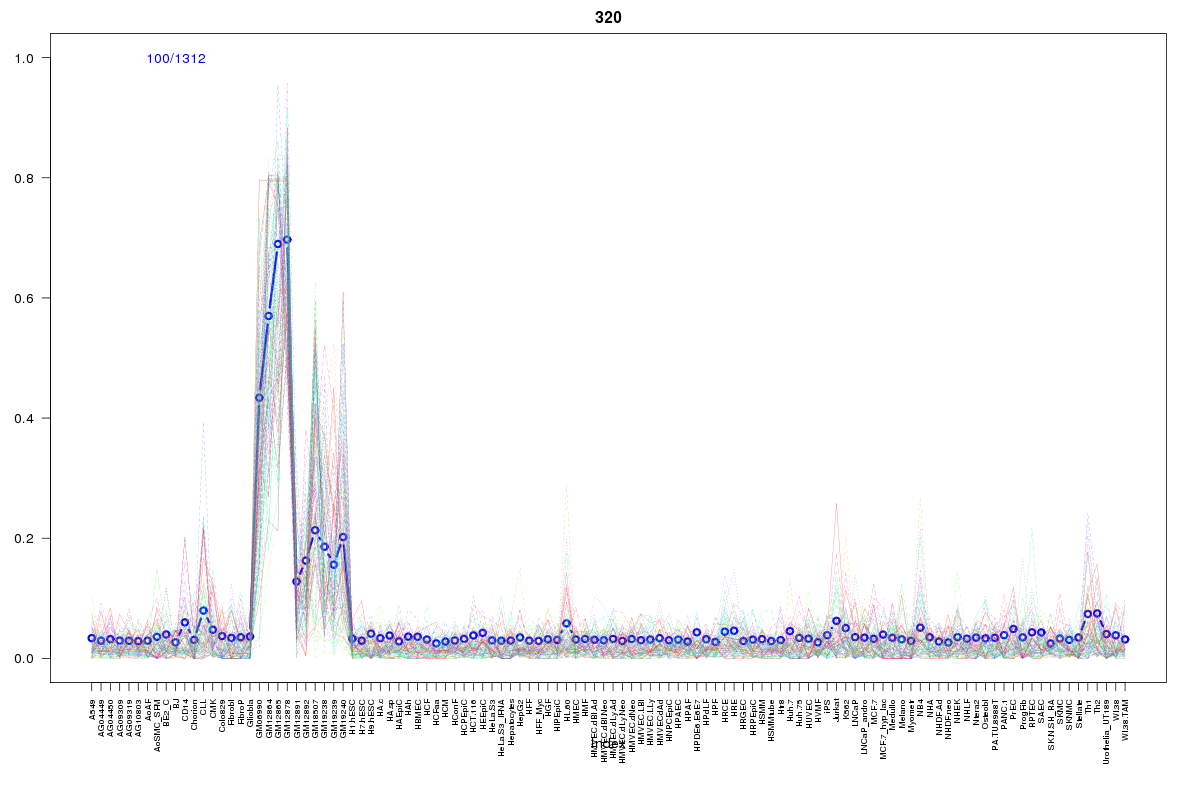 | 320 | 1 |
 | 1963 | 1 |
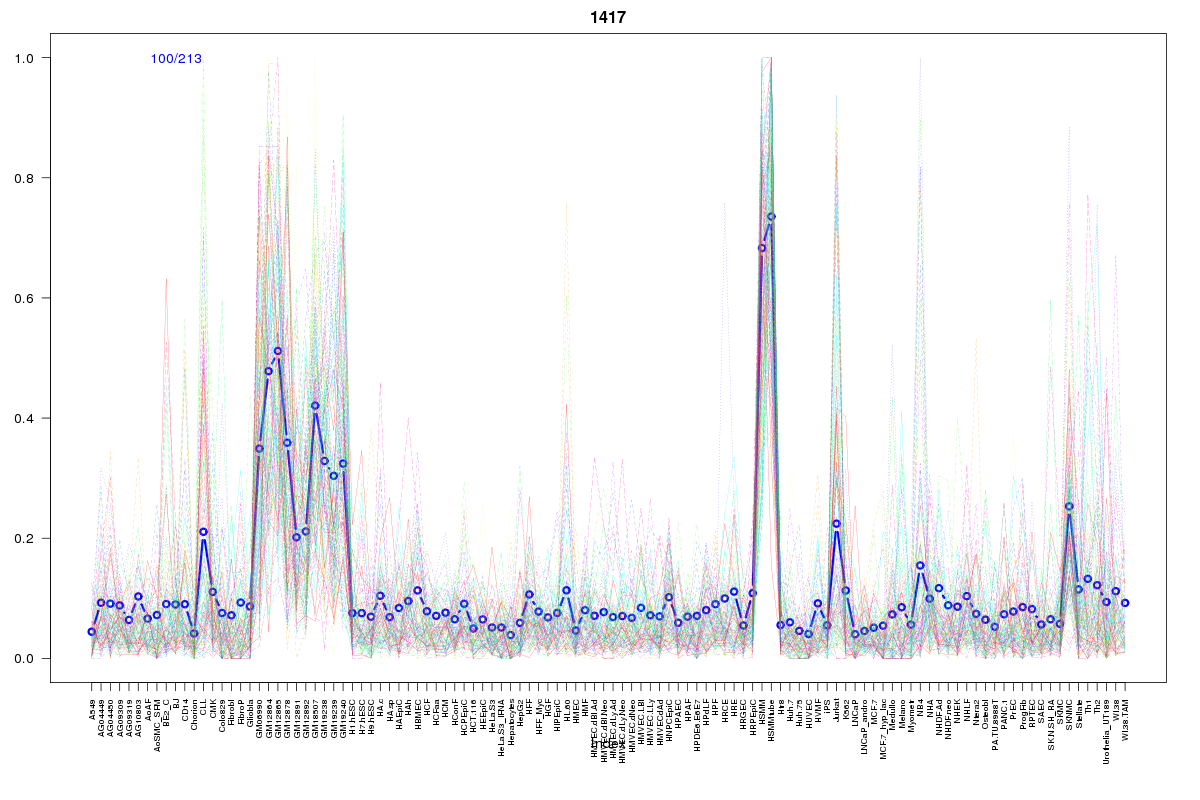 | 1417 | 1 |
Resources
BED file downloads
Connects to 49 DHS sitesTop 10 Correlated DHS Sites
p-values indiciate significant higher or lower correlationExternal Databases
UCSCEnsembl (ENSG00000136842)