Gene: GOLGA1
chr9: 127640645-127703378Expression Profile
(log scale)
Graphical Connections
Distribution of linked clusters:
You may find it interesting if many of the connected DHS sites belong to the same cluster.| Cluster Profile | Cluster ID | Number of DHS sites in this cluster |
|---|---|---|
 | 1724 | 9 |
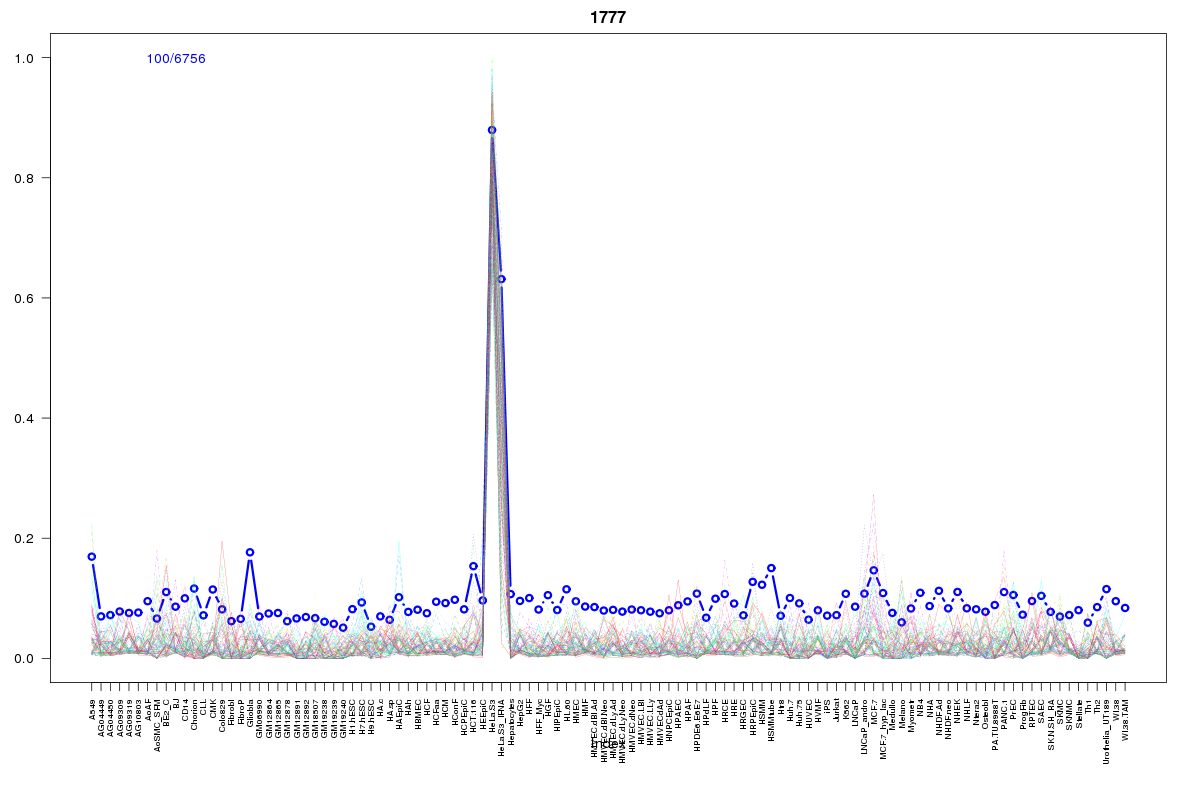 | 1777 | 3 |
 | 927 | 2 |
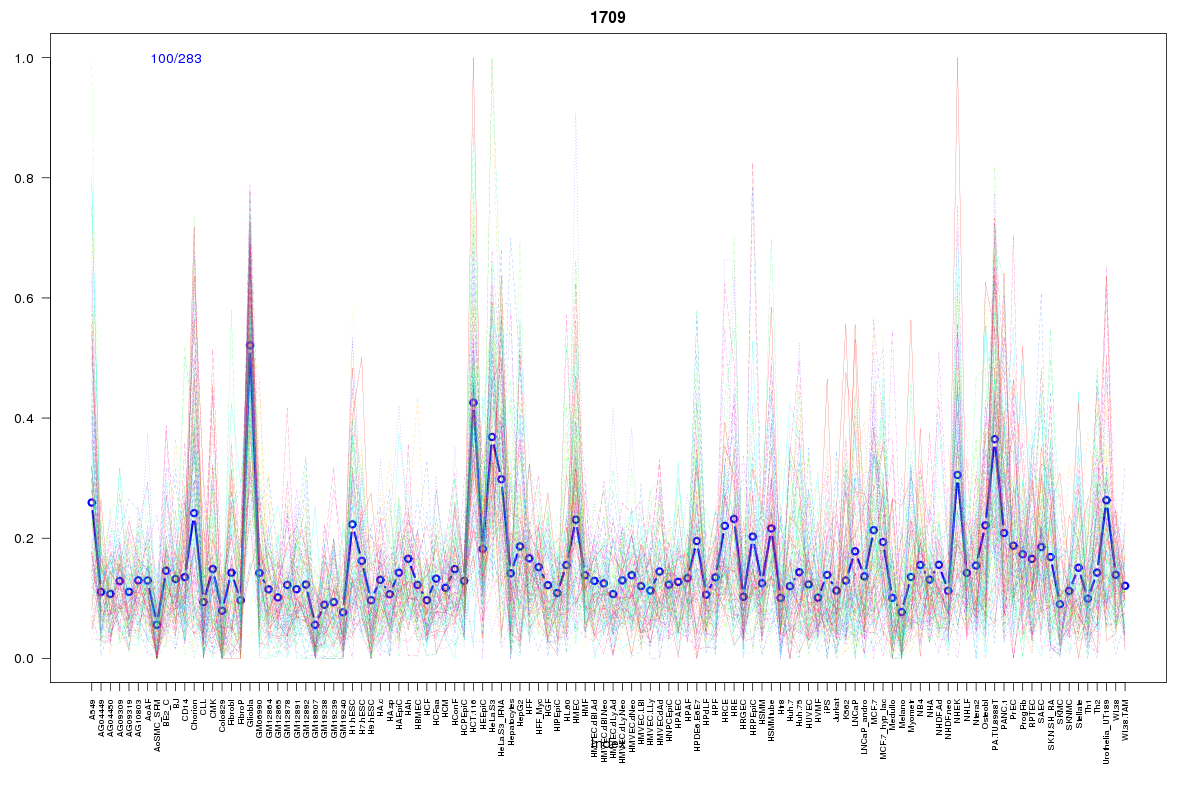 | 1709 | 2 |
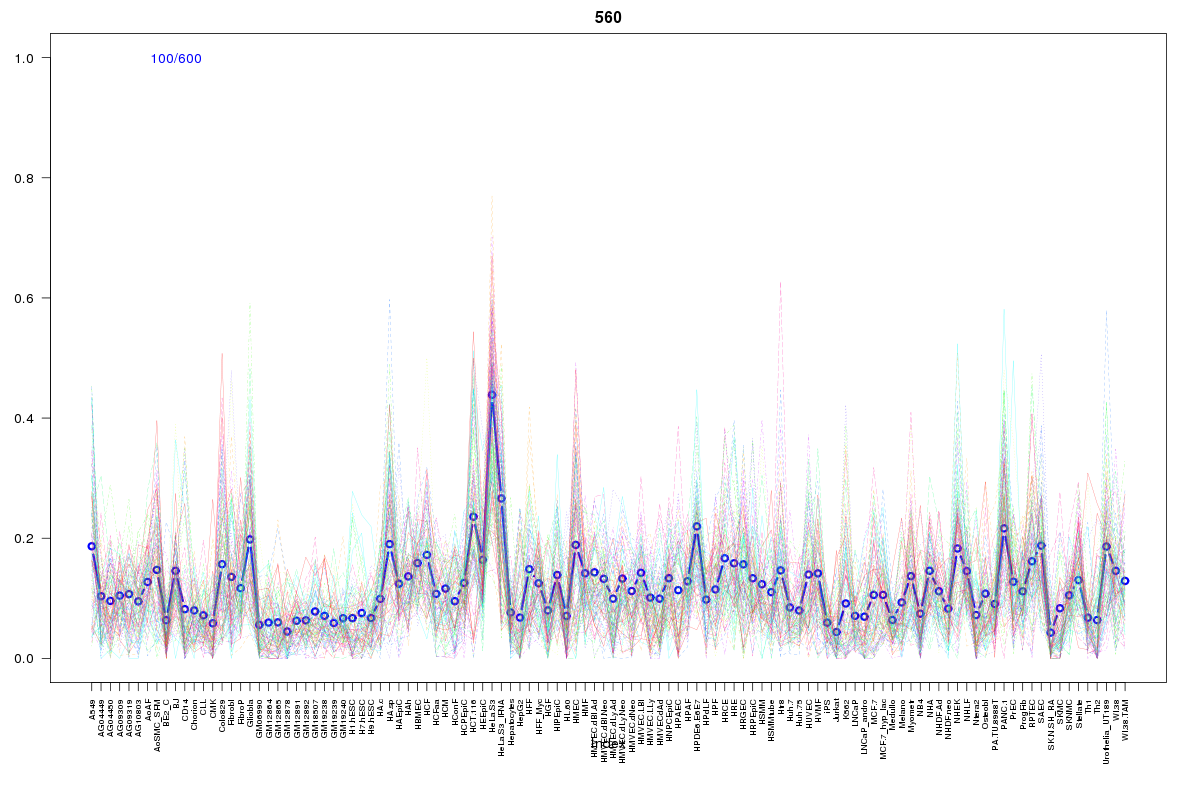 | 560 | 2 |
 | 860 | 1 |
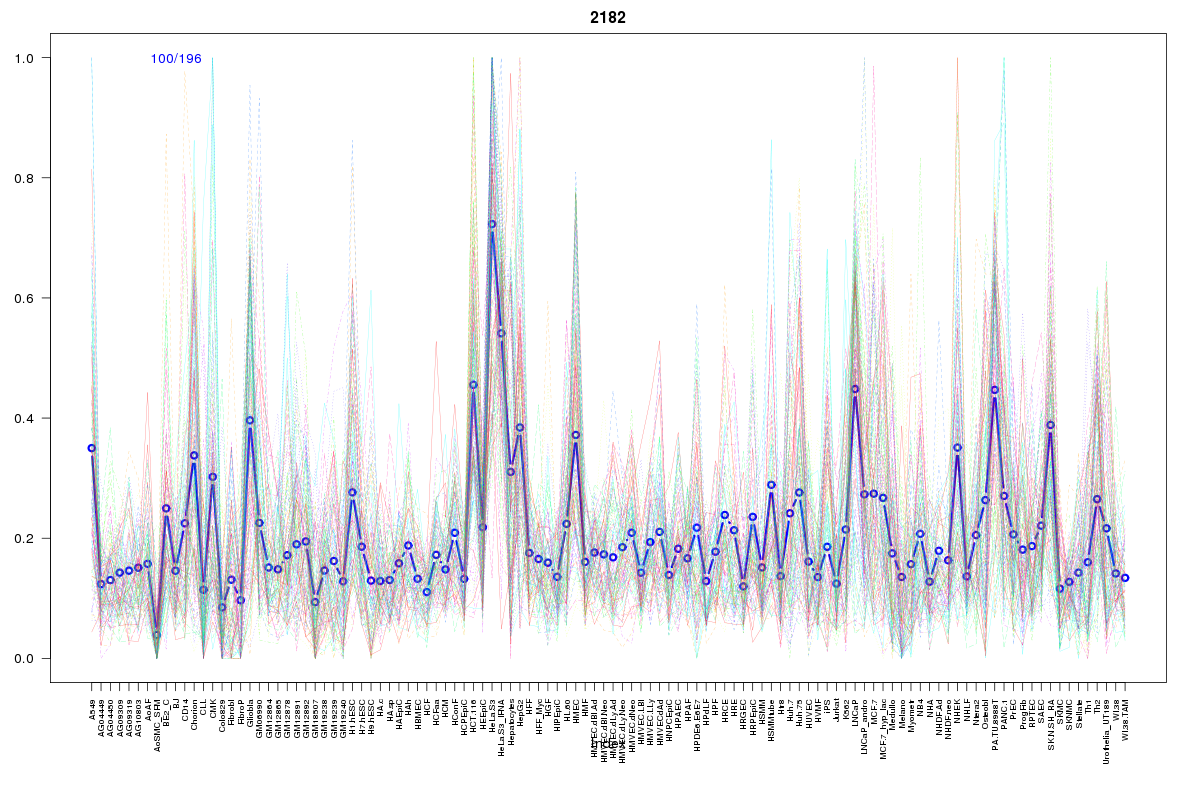 | 2182 | 1 |
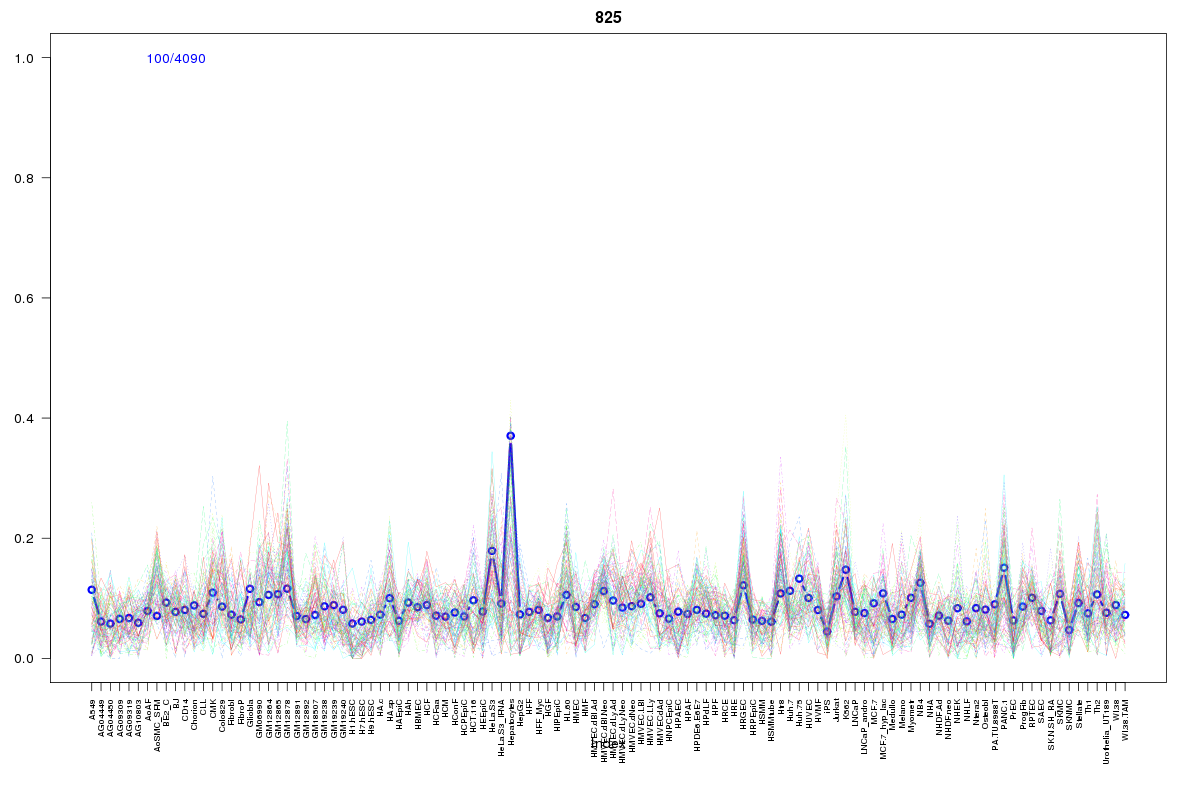 | 825 | 1 |
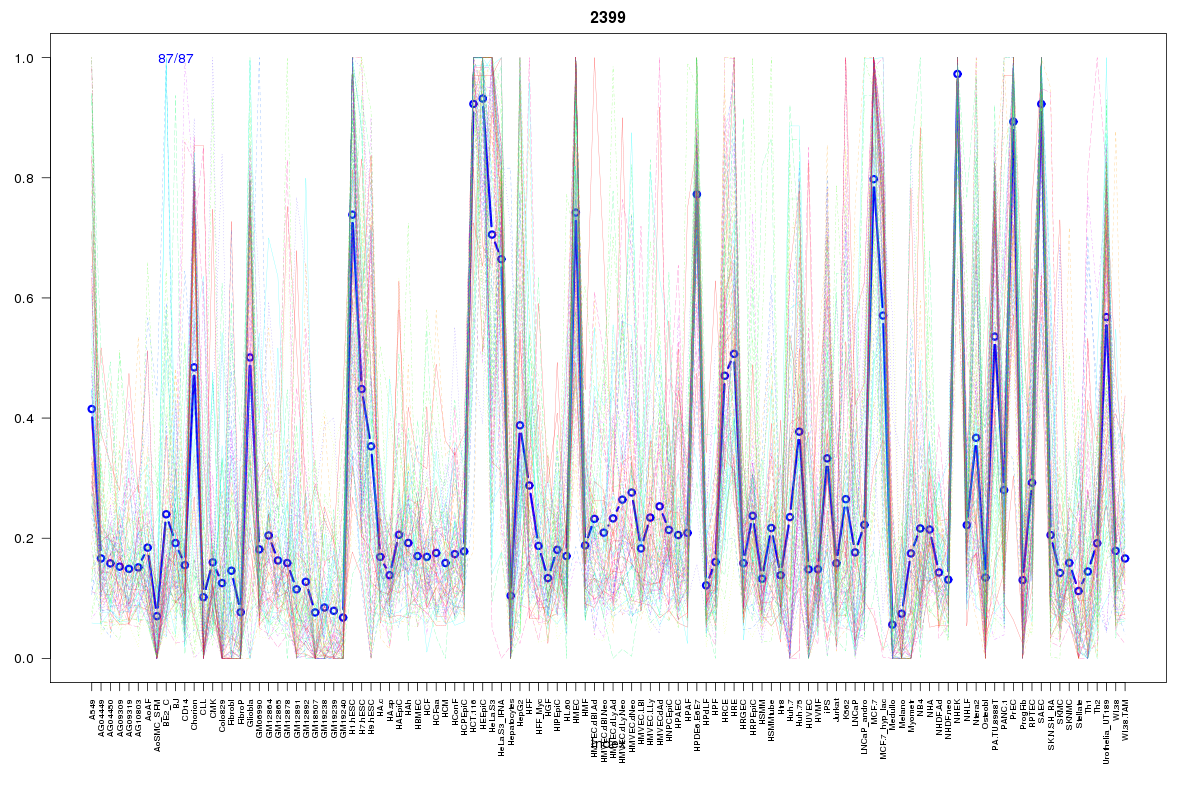 | 2399 | 1 |
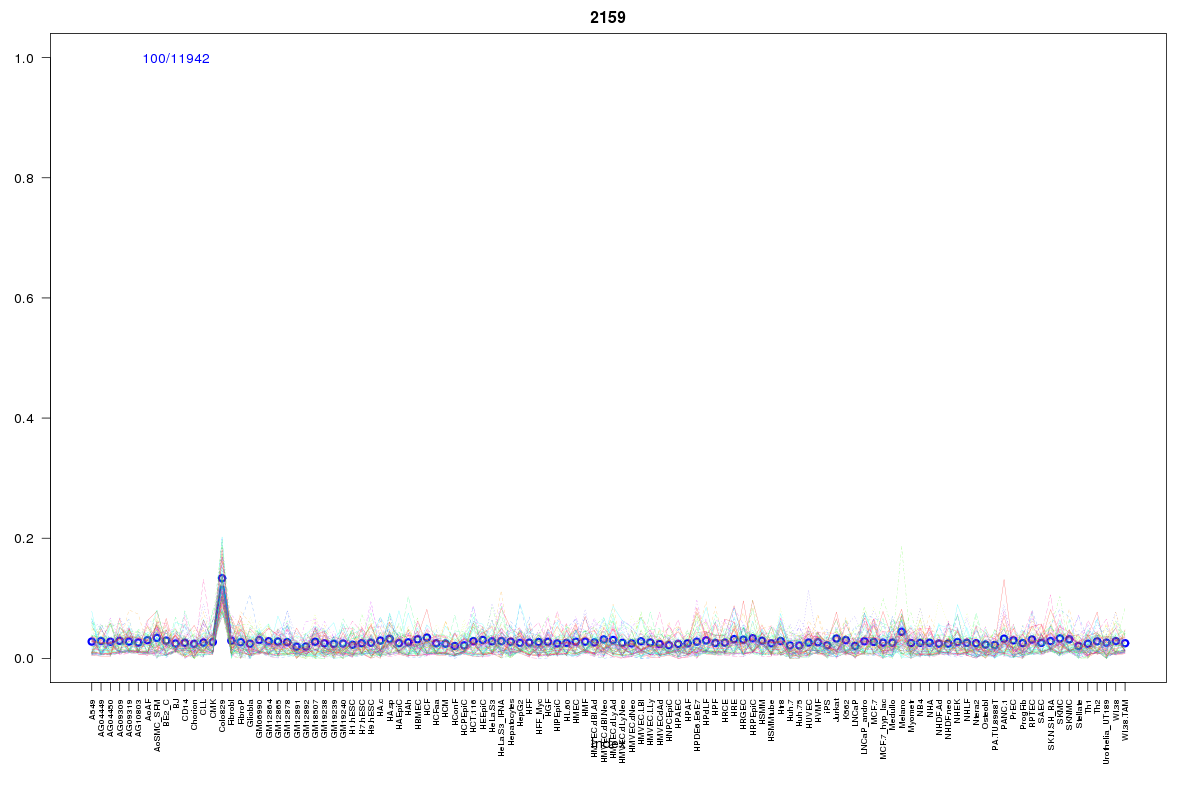 | 2159 | 1 |
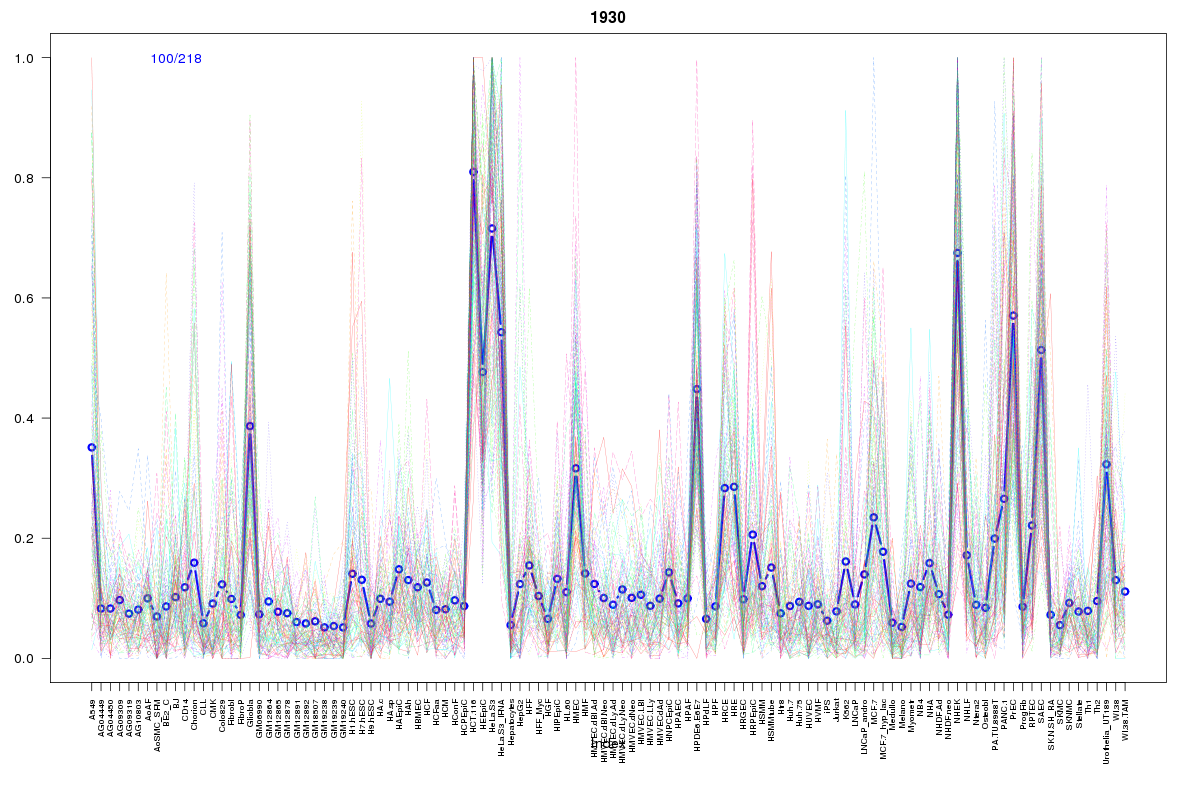 | 1930 | 1 |
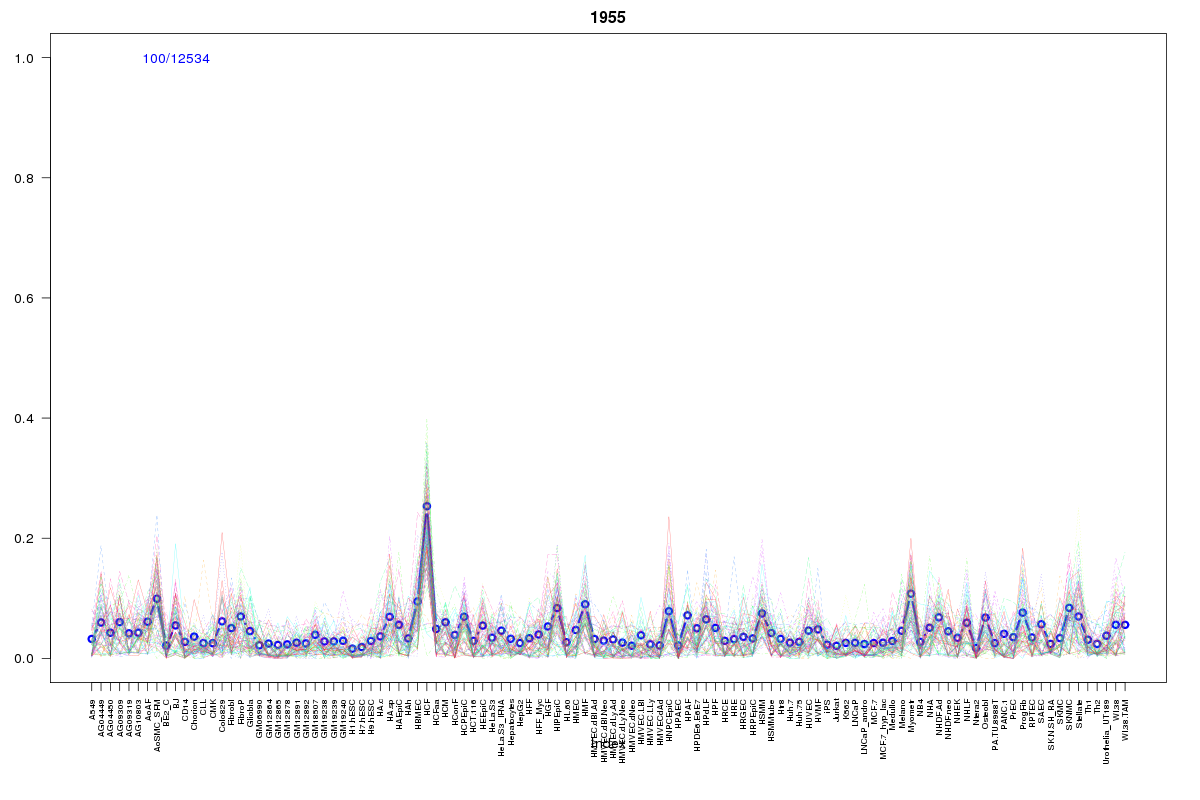 | 1955 | 1 |
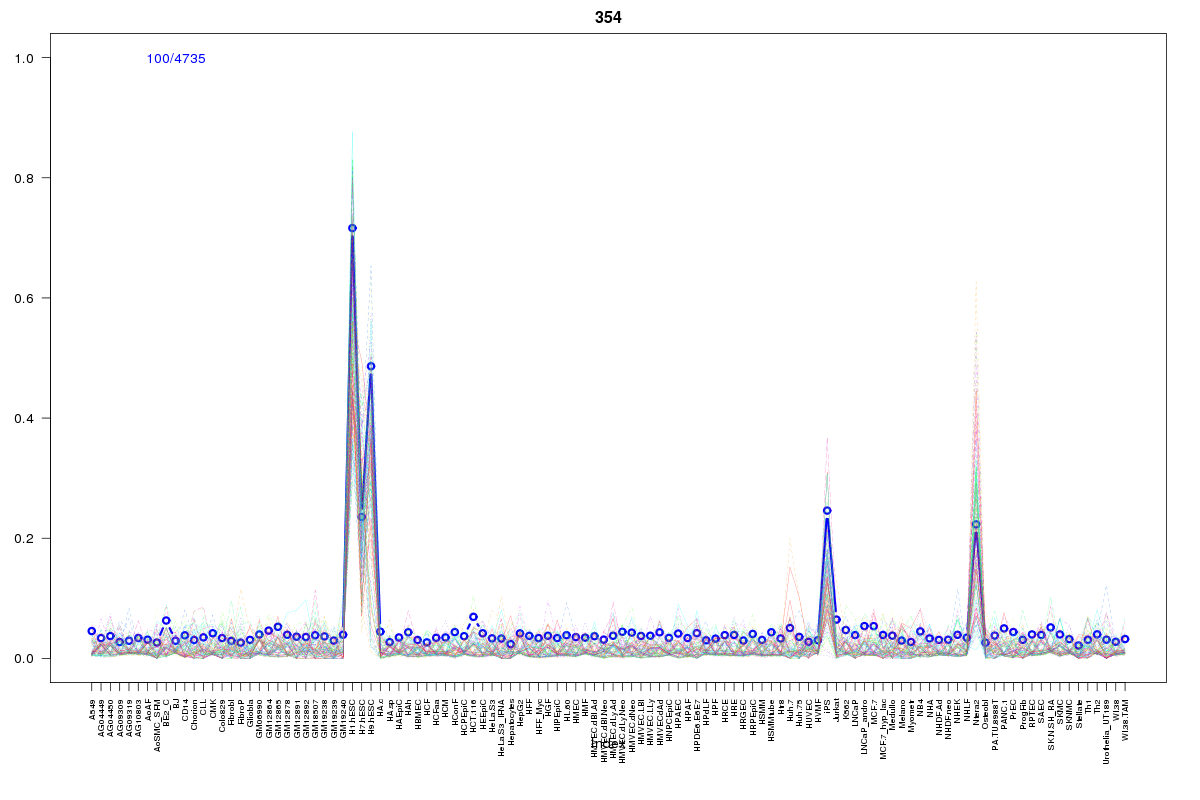 | 354 | 1 |
 | 1779 | 1 |
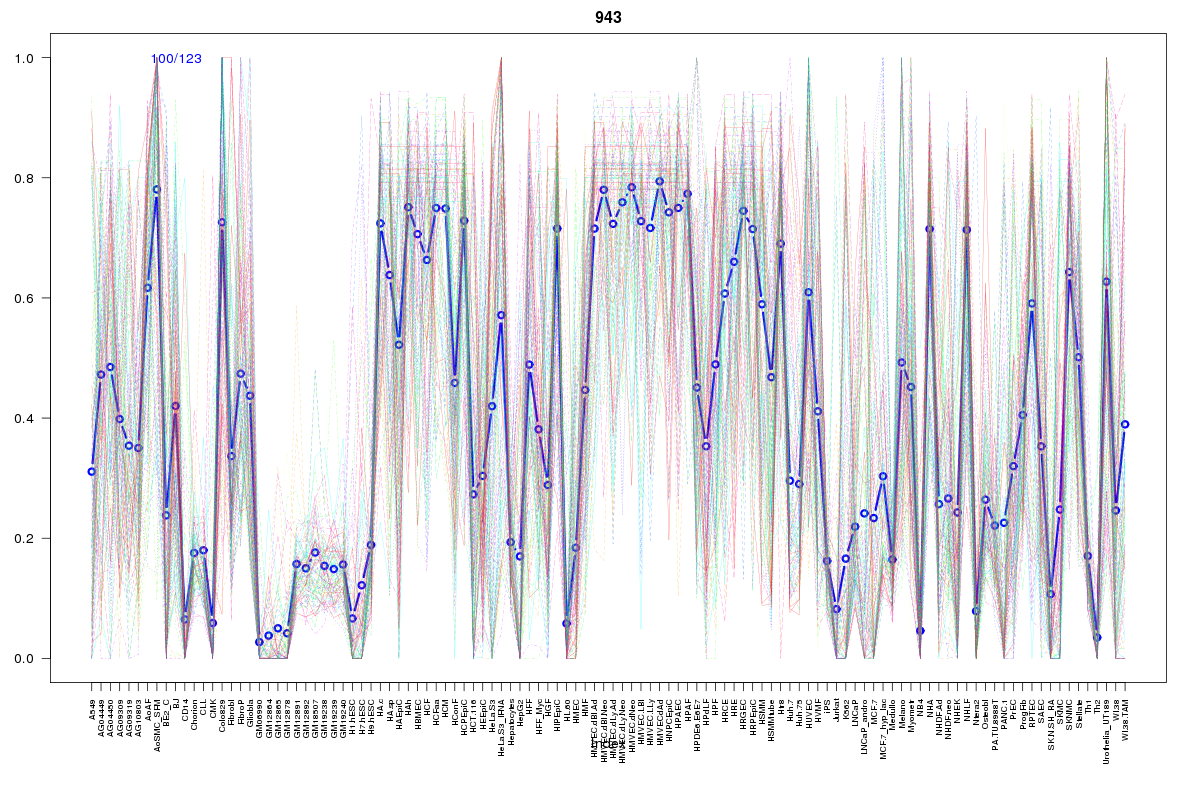 | 943 | 1 |
 | 2055 | 1 |
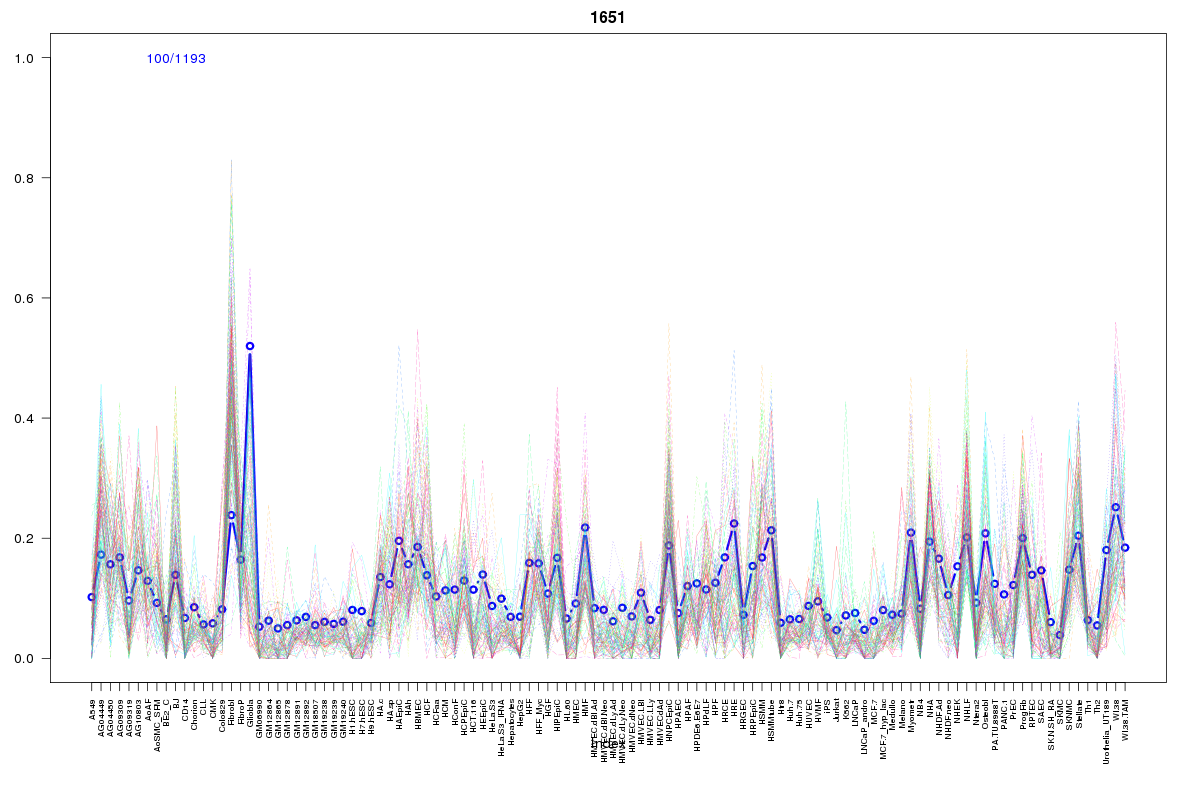 | 1651 | 1 |
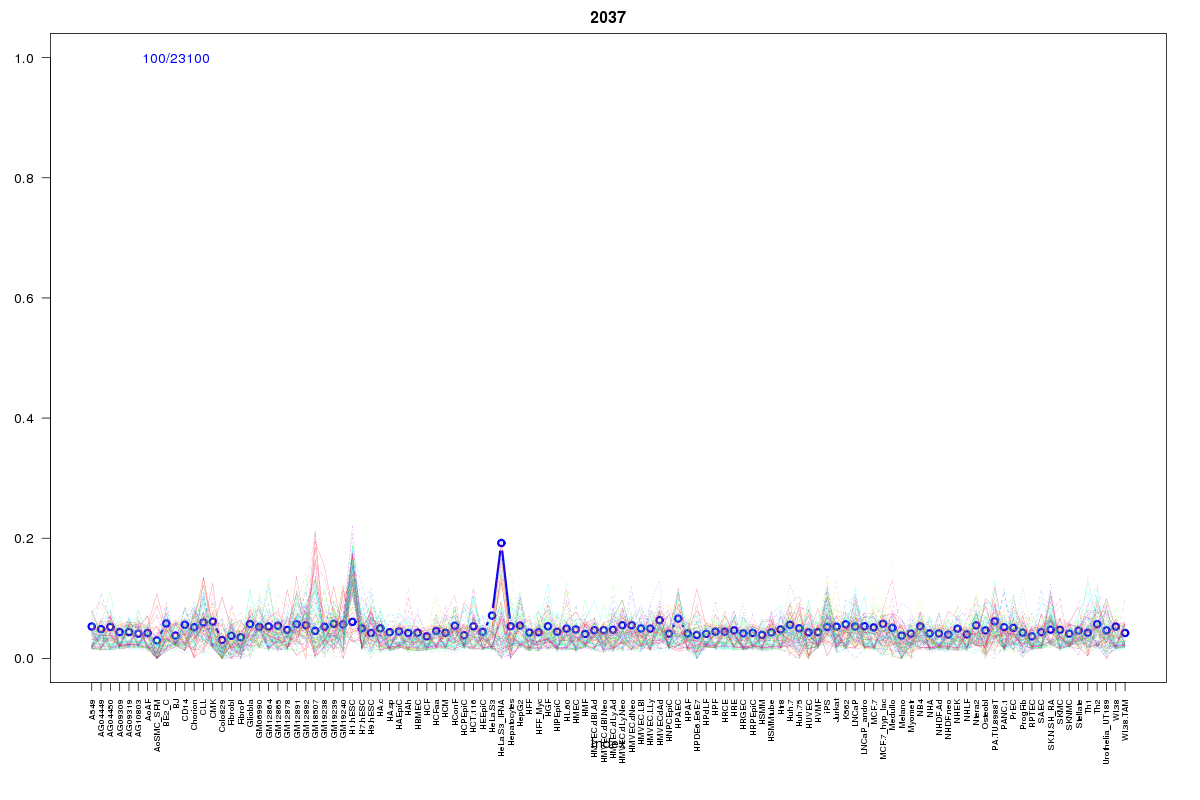 | 2037 | 1 |
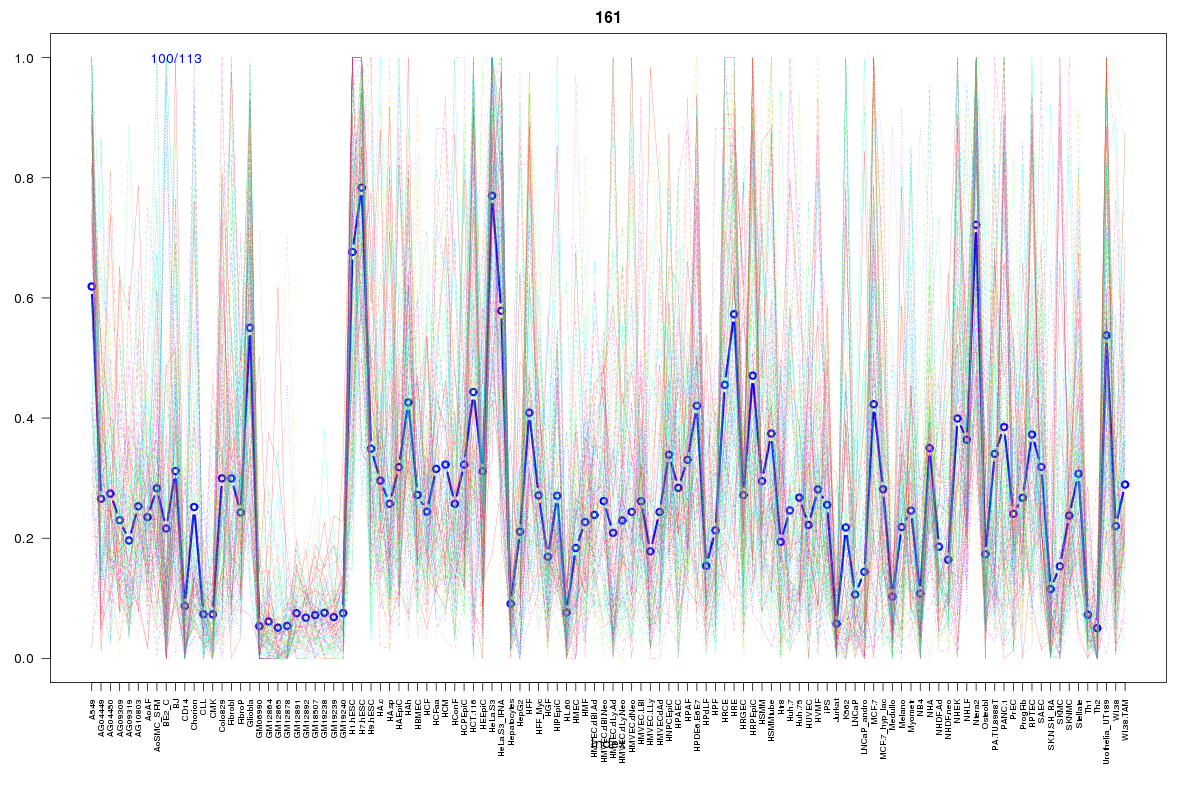 | 161 | 1 |
 | 881 | 1 |
 | 615 | 1 |
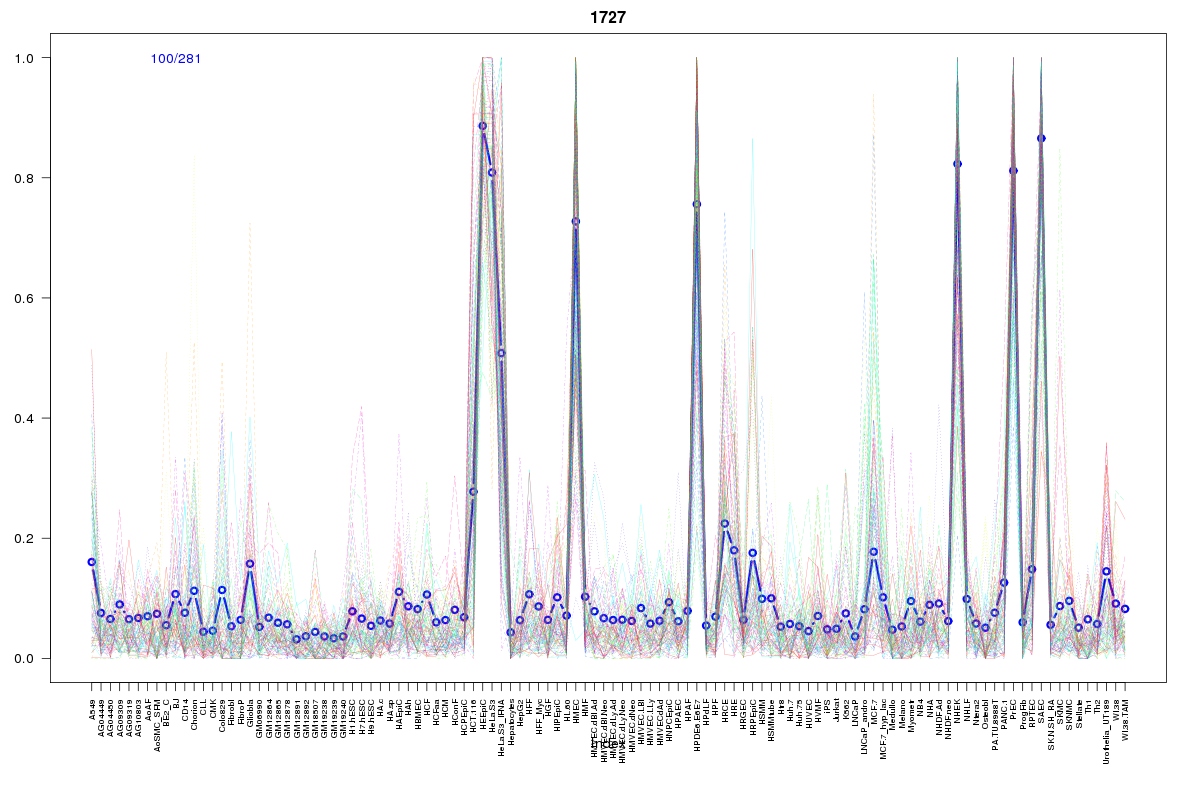 | 1727 | 1 |
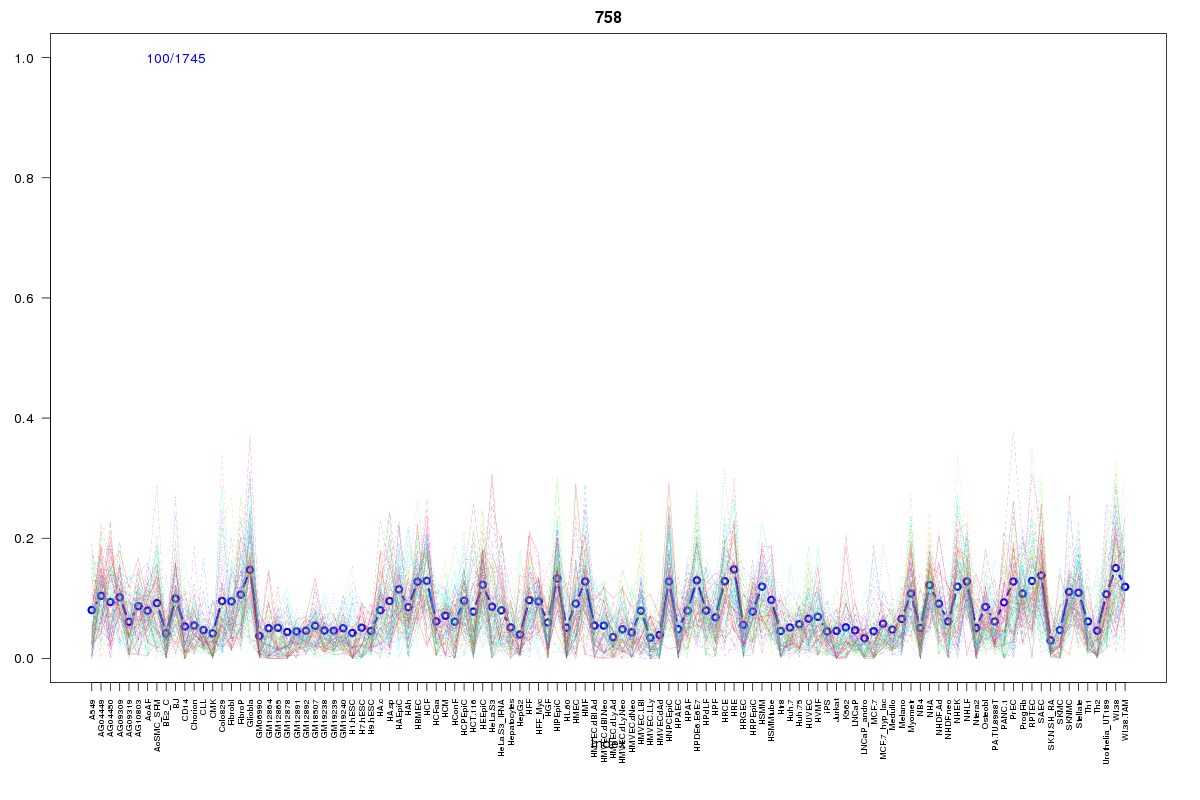 | 758 | 1 |
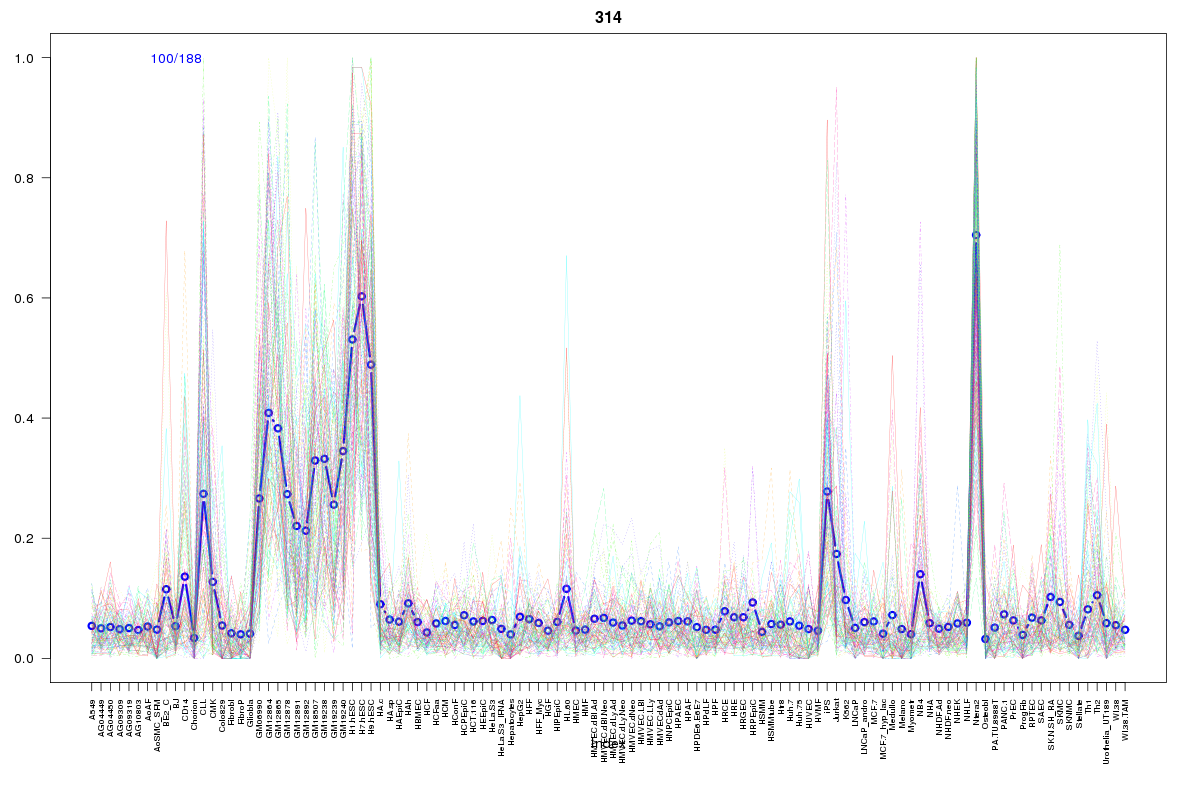 | 314 | 1 |
Resources
BED file downloads
Connects to 37 DHS sitesTop 10 Correlated DHS Sites
p-values indiciate significant higher or lower correlation| Location | Cluster | P-value |
|---|---|---|
| chr9:127596845-127596995 | 1709 | 0 |
| chr9:127597260-127597410 | 1709 | 0 |
| chr9:127581225-127581375 | 1930 | 0.001 |
| chr9:127586340-127586490 | 1724 | 0.003 |
| chr9:127597040-127597190 | 1779 | 0.004 |
| chr9:127580865-127581015 | 2182 | 0.004 |
| chr9:127597825-127597975 | 560 | 0.006 |
| chr9:127575980-127576130 | 758 | 0.006 |
| chr9:127700565-127700715 | 860 | 0.011 |
| chr9:127582200-127582350 | 1724 | 0.013 |
| chr9:127541220-127541370 | 1651 | 0.013 |
External Databases
UCSCEnsembl (ENSG00000136935)