Gene: TCF19
chr6: 31126318-31131992Expression Profile
(log scale)
Graphical Connections
Distribution of linked clusters:
You may find it interesting if many of the connected DHS sites belong to the same cluster.| Cluster Profile | Cluster ID | Number of DHS sites in this cluster |
|---|---|---|
 | 1078 | 2 |
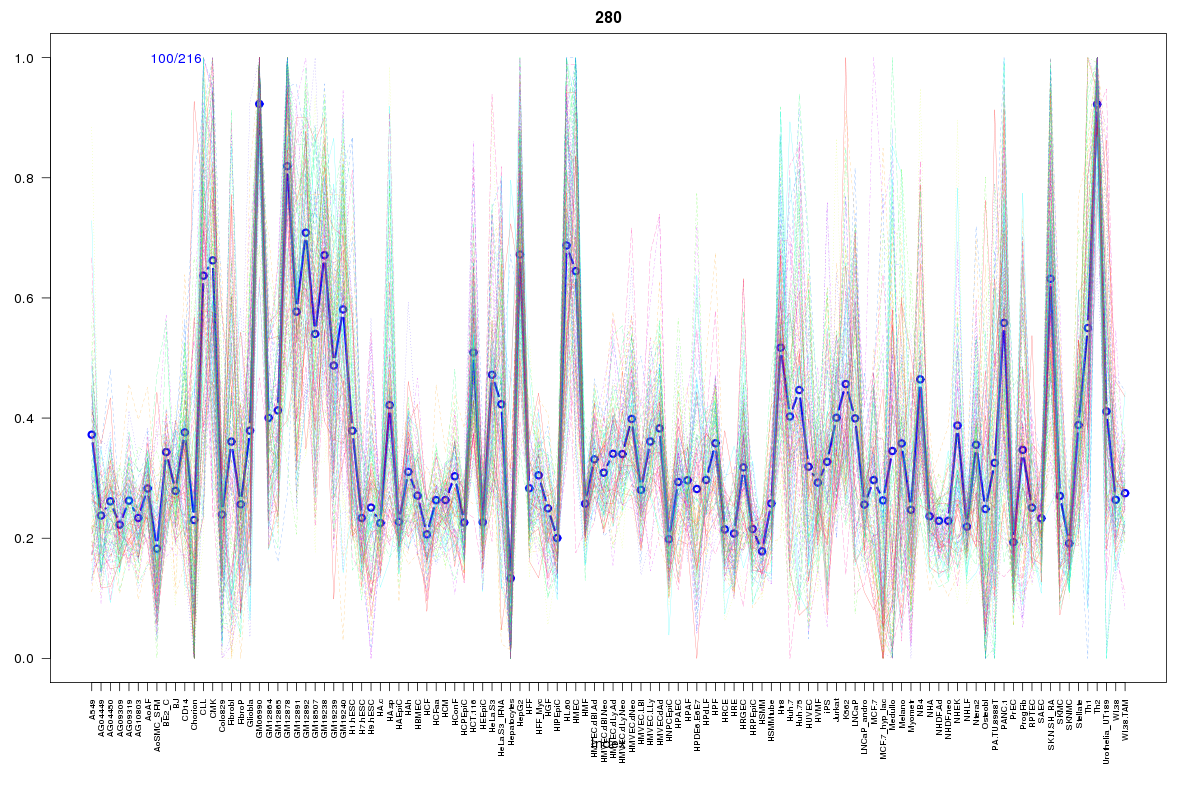 | 280 | 1 |
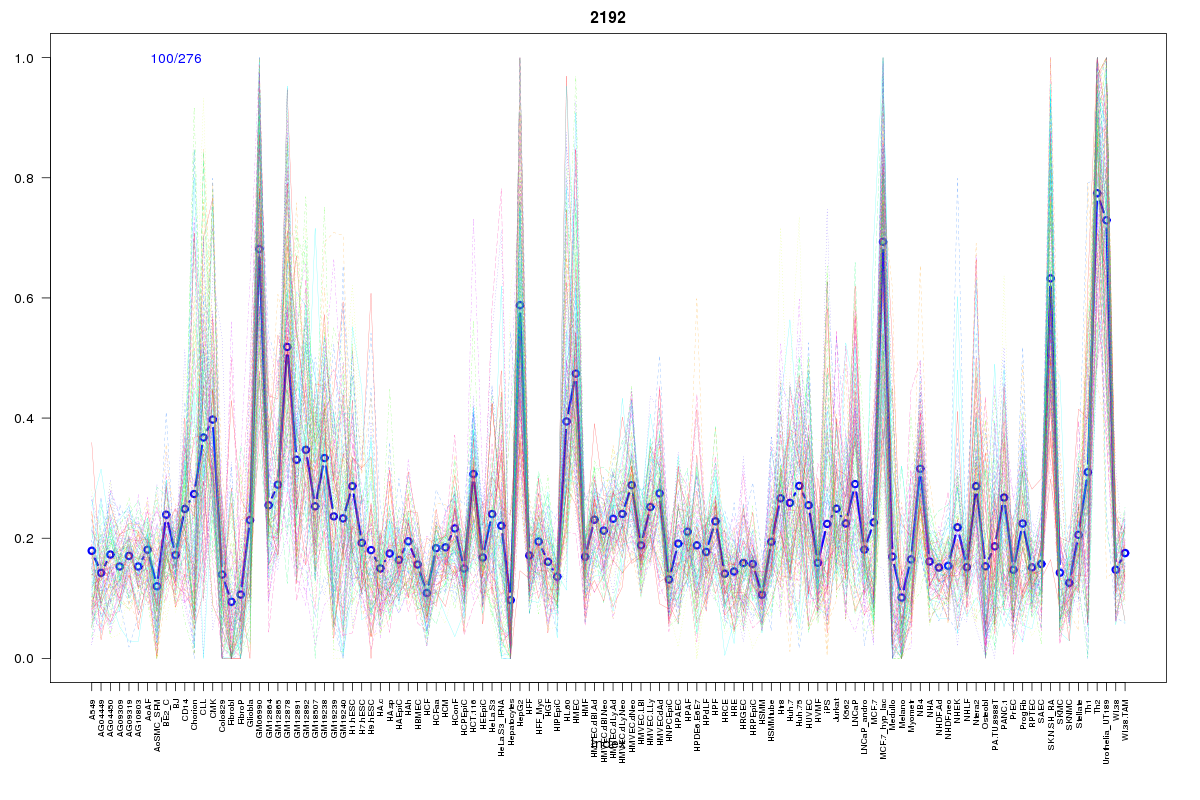 | 2192 | 1 |
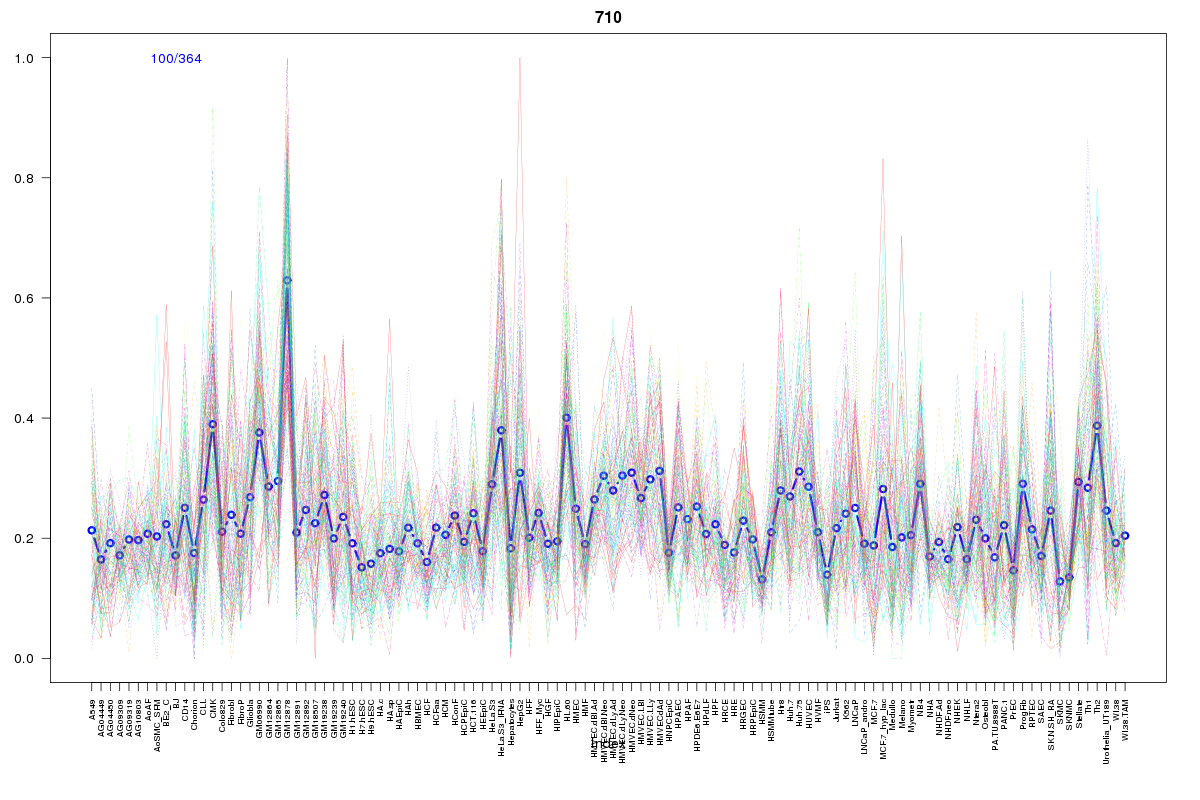 | 710 | 1 |
 | 2062 | 1 |
 | 282 | 1 |
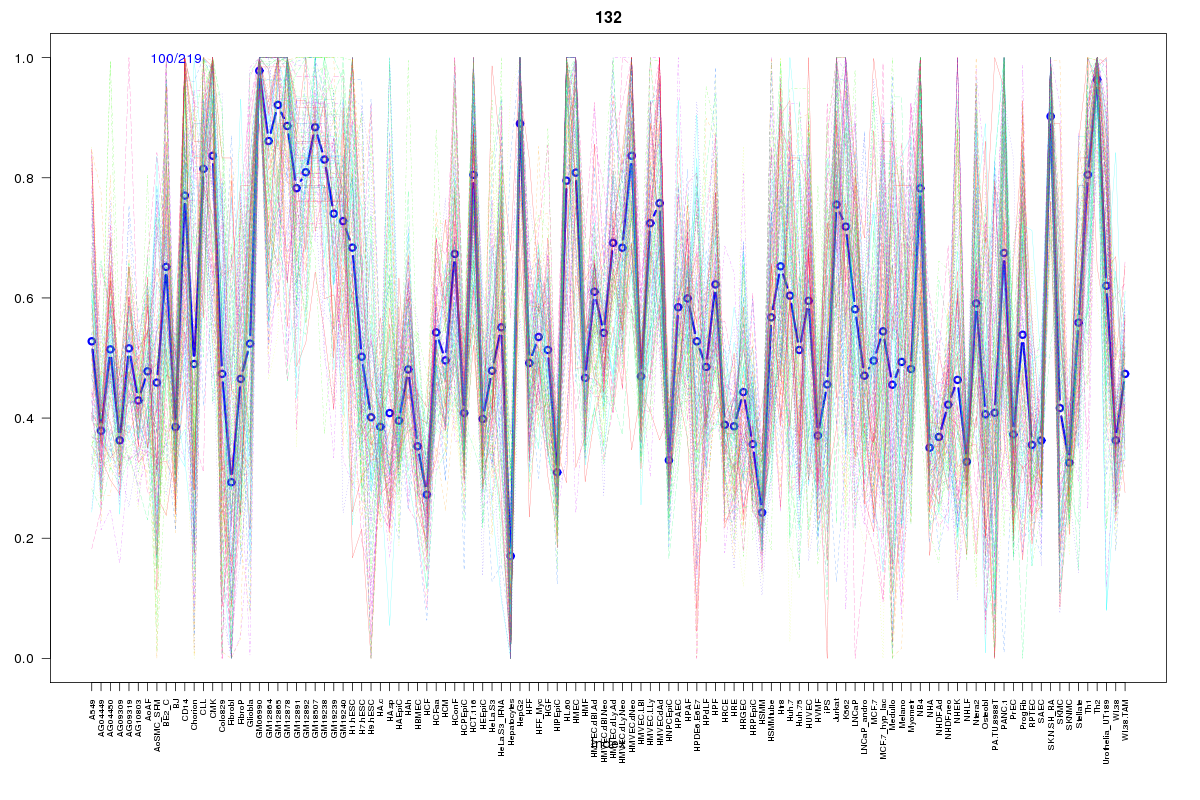 | 132 | 1 |
 | 421 | 1 |
 | 66 | 1 |
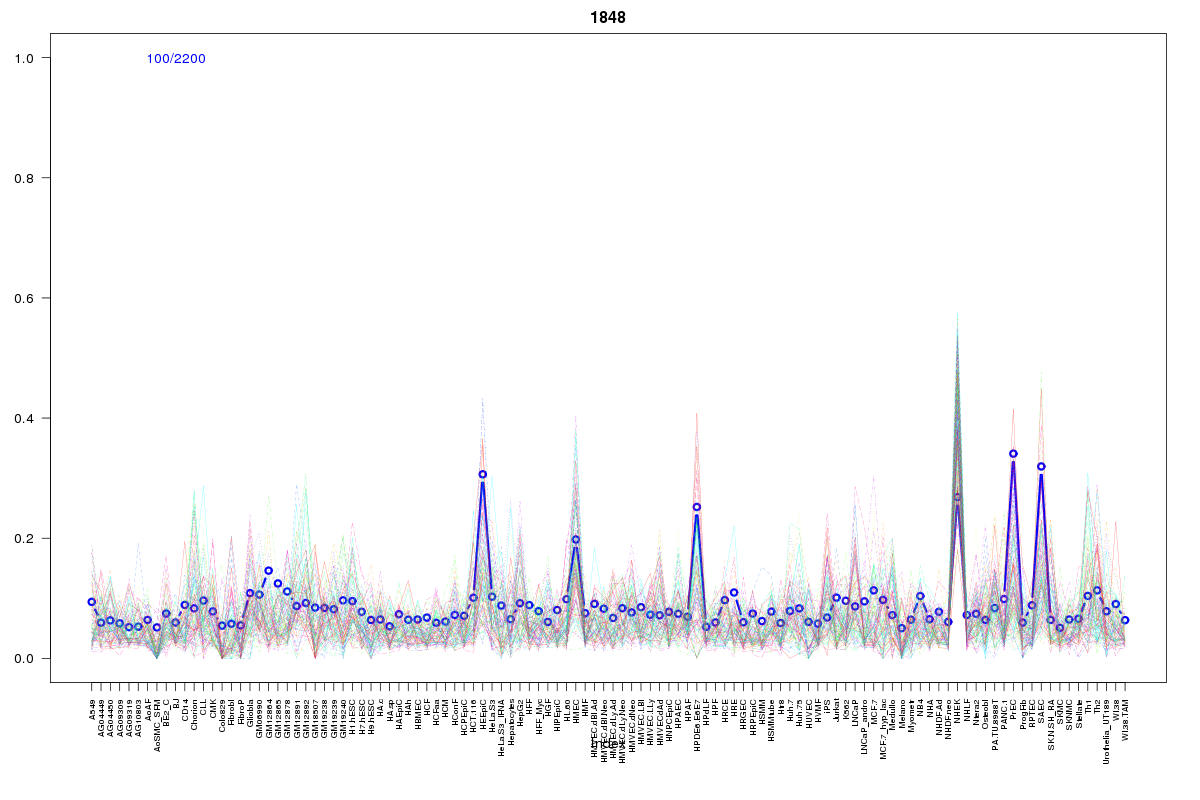 | 1848 | 1 |
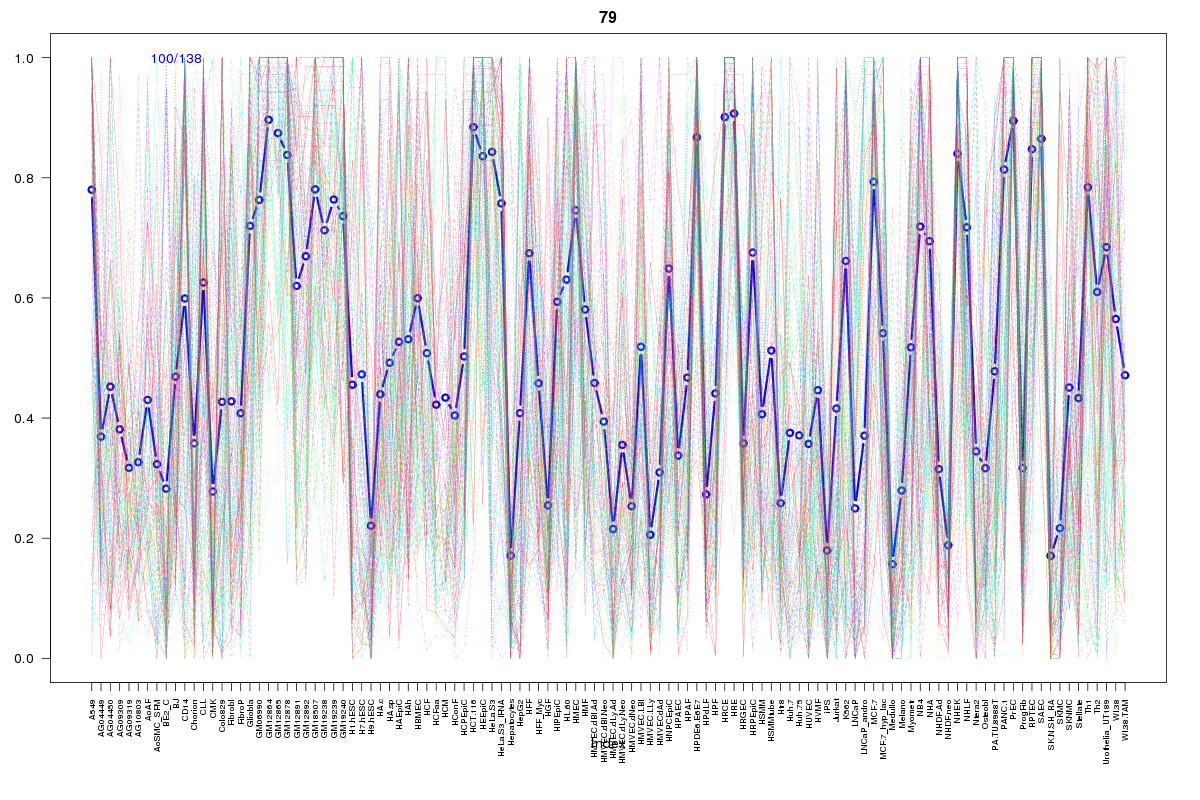 | 79 | 1 |
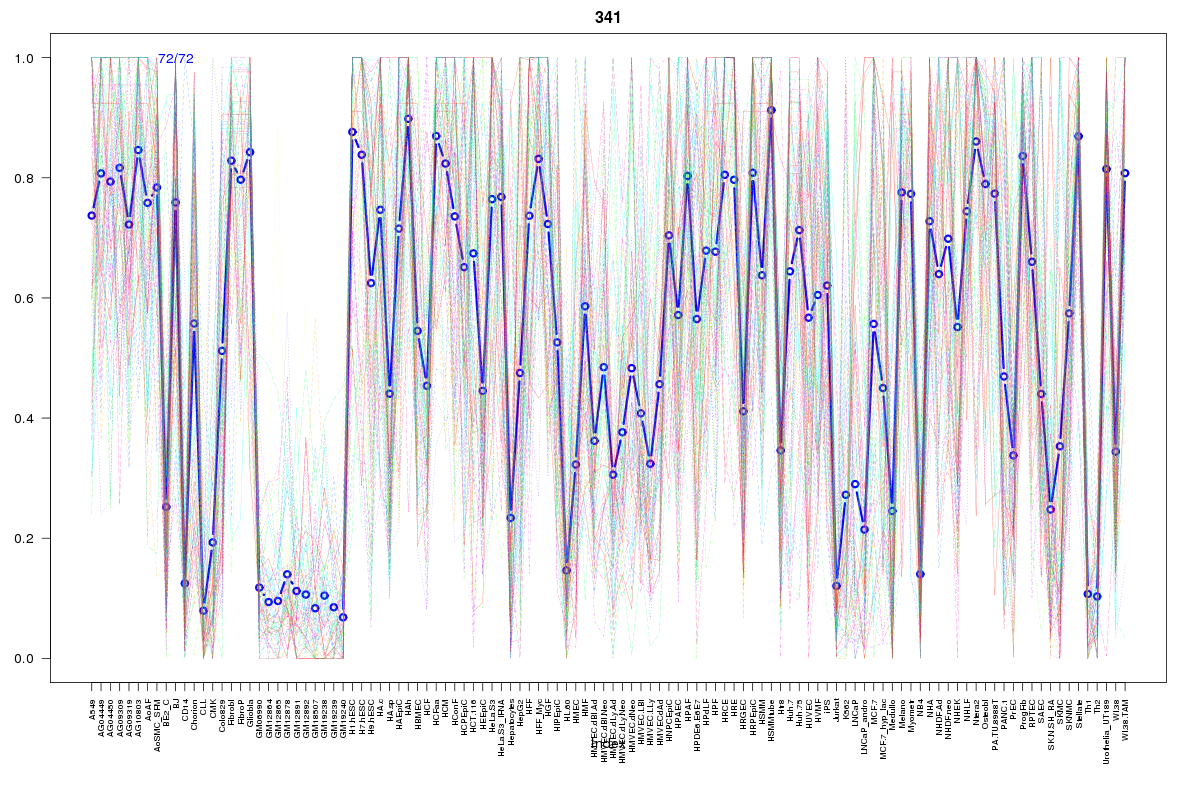 | 341 | 1 |
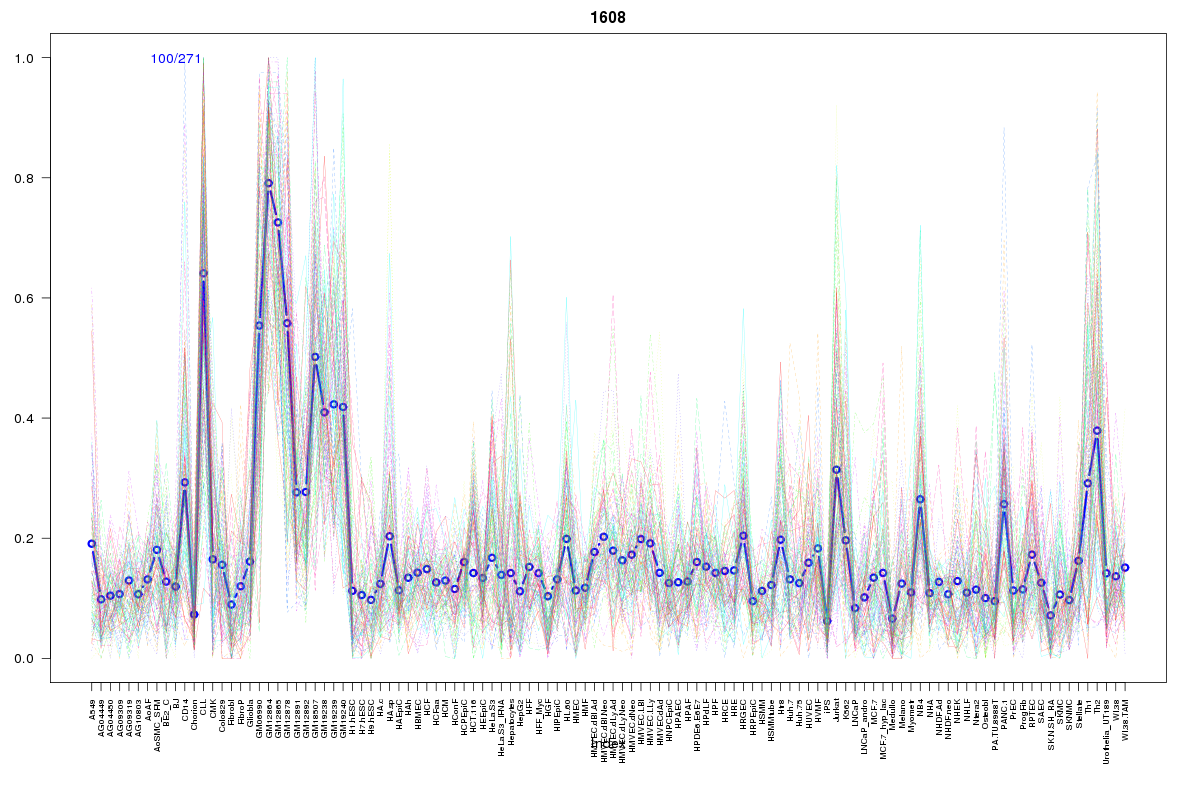 | 1608 | 1 |
 | 2122 | 1 |
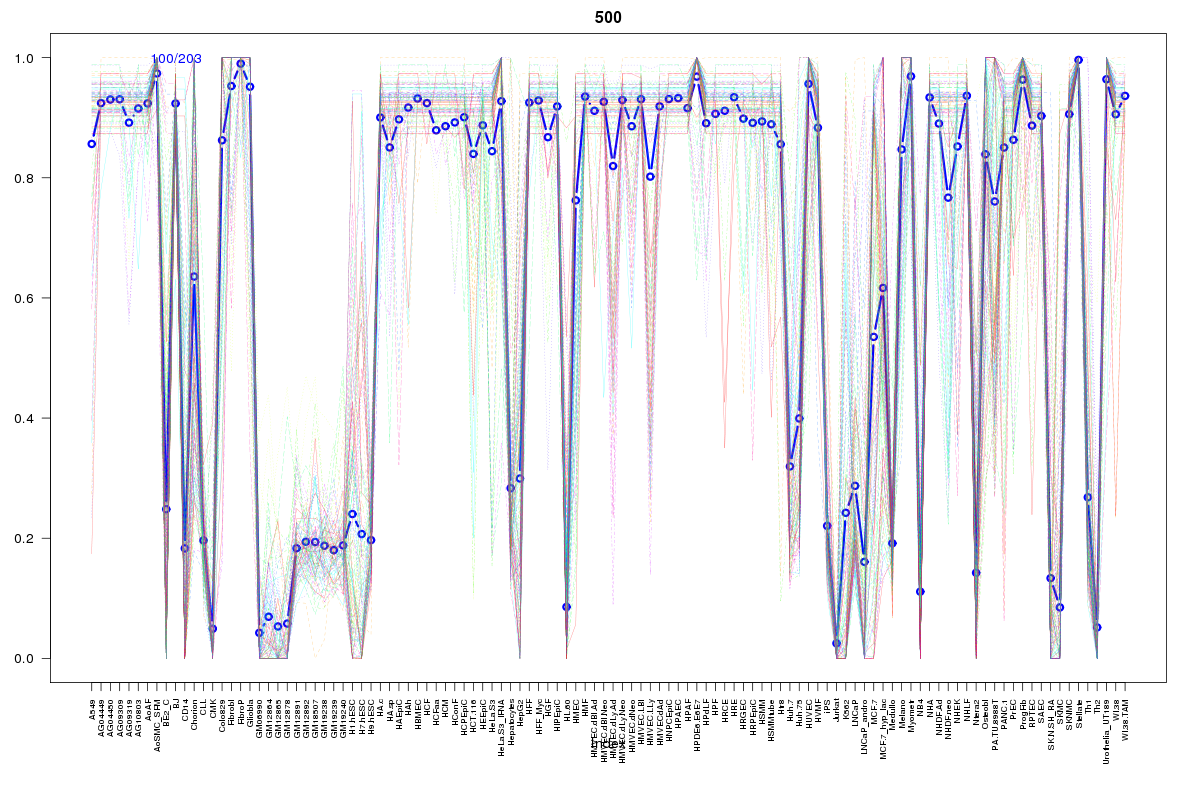 | 500 | 1 |
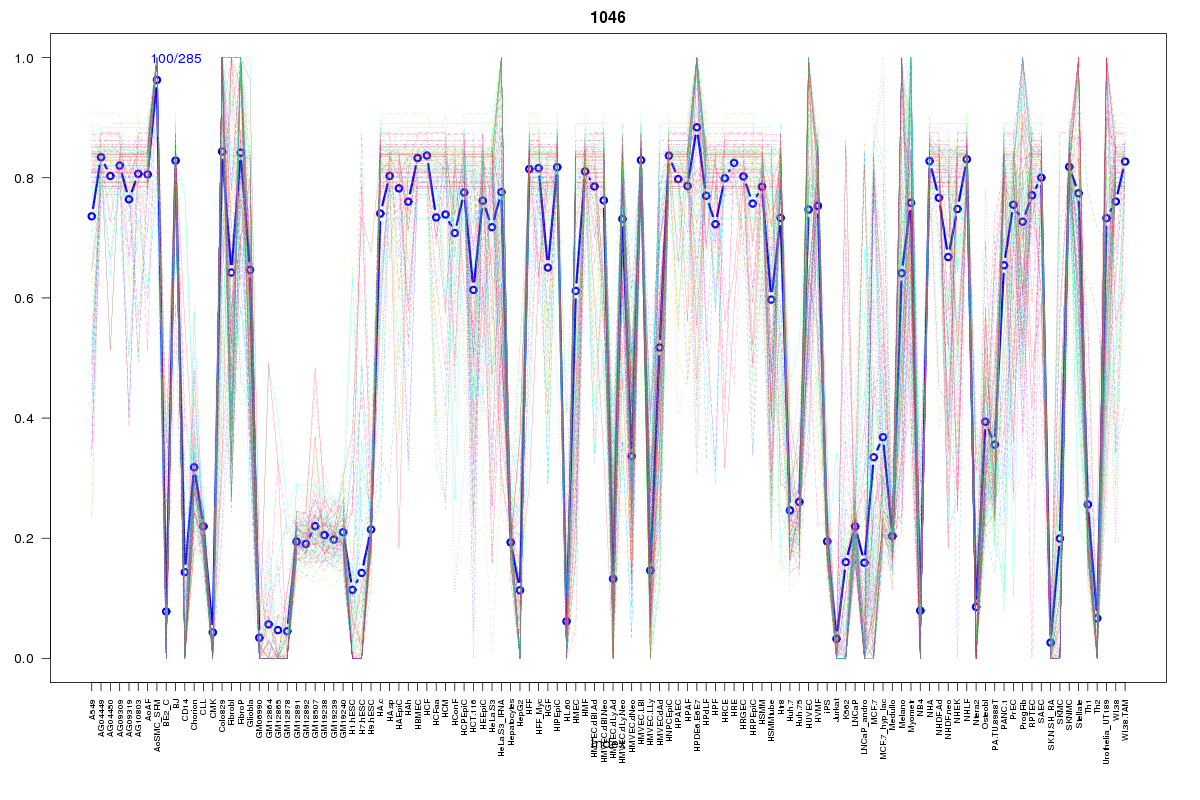 | 1046 | 1 |
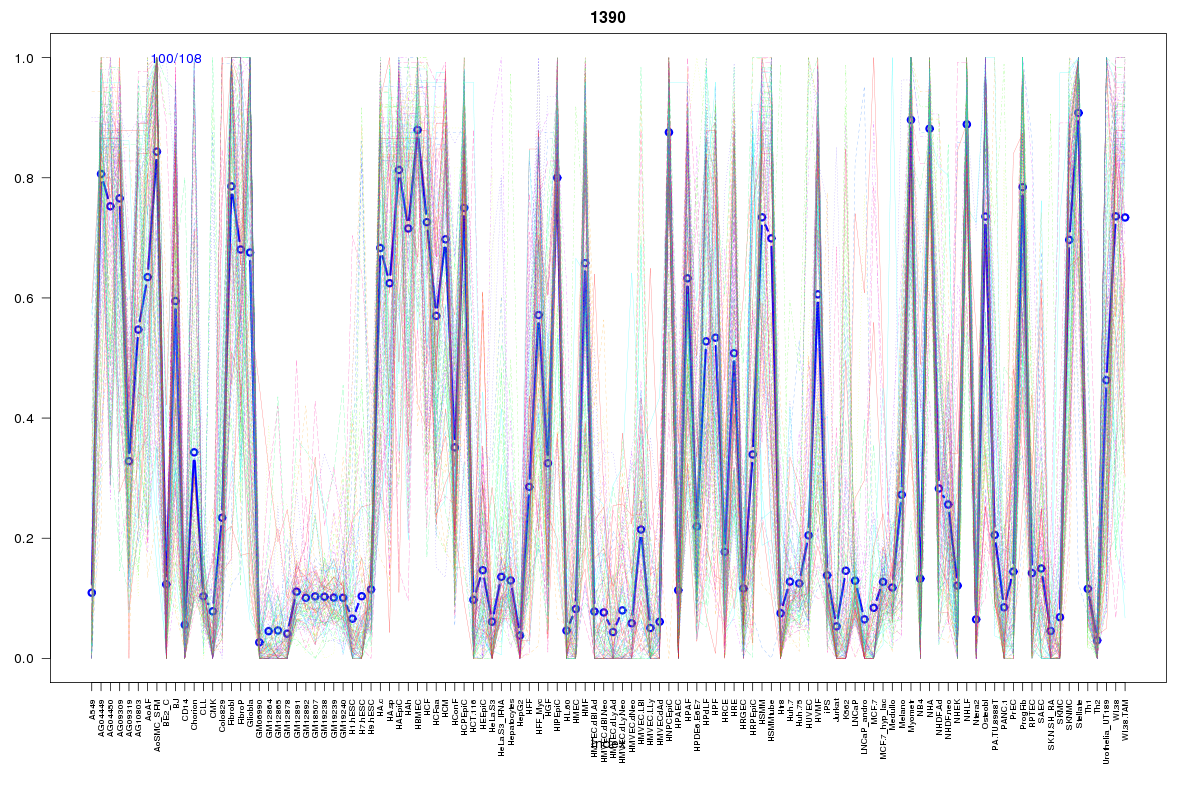 | 1390 | 1 |
Resources
BED file downloads
Connects to 18 DHS sitesTop 10 Correlated DHS Sites
p-values indiciate significant higher or lower correlation| Location | Cluster | P-value |
|---|---|---|
| chr6:31165740-31165890 | 132 | 0 |
| chr6:31165560-31165710 | 282 | 0 |
| chr6:31165980-31166130 | 421 | 0.001 |
| chr6:31172000-31172150 | 1608 | 0.006 |
| chr6:31148265-31148415 | 2062 | 0.006 |
| chr6:31125685-31125835 | 280 | 0.006 |
| chr6:31166640-31166790 | 66 | 0.007 |
| chr6:31126485-31126635 | 2192 | 0.007 |
| chr6:31126700-31126850 | 710 | 0.009 |
| chr6:31105705-31105855 | 1078 | 0.009 |
| chr6:31171460-31171610 | 79 | 0.01 |
External Databases
UCSCEnsembl (ENSG00000137310)