Gene: DPT
chr1: 168664696-168698502Expression Profile
(log scale)
Graphical Connections
Distribution of linked clusters:
You may find it interesting if many of the connected DHS sites belong to the same cluster.| Cluster Profile | Cluster ID | Number of DHS sites in this cluster |
|---|---|---|
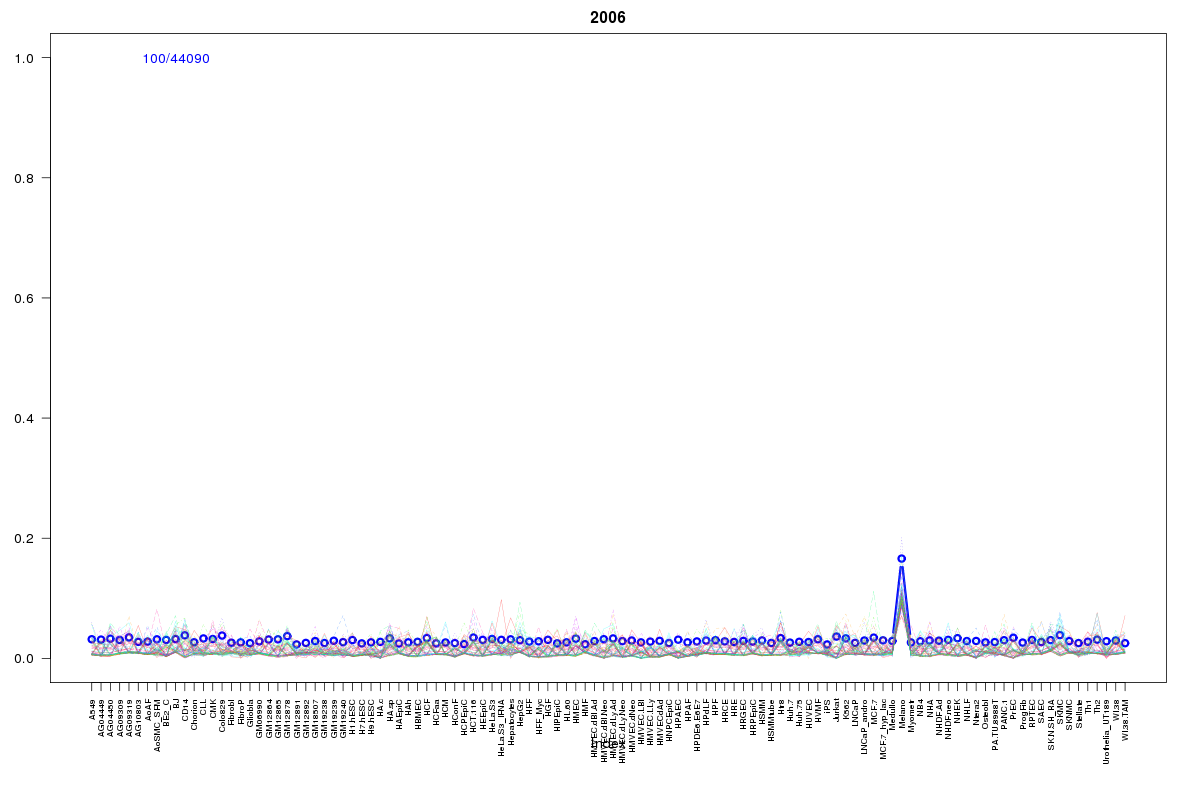 | 2006 | 2 |
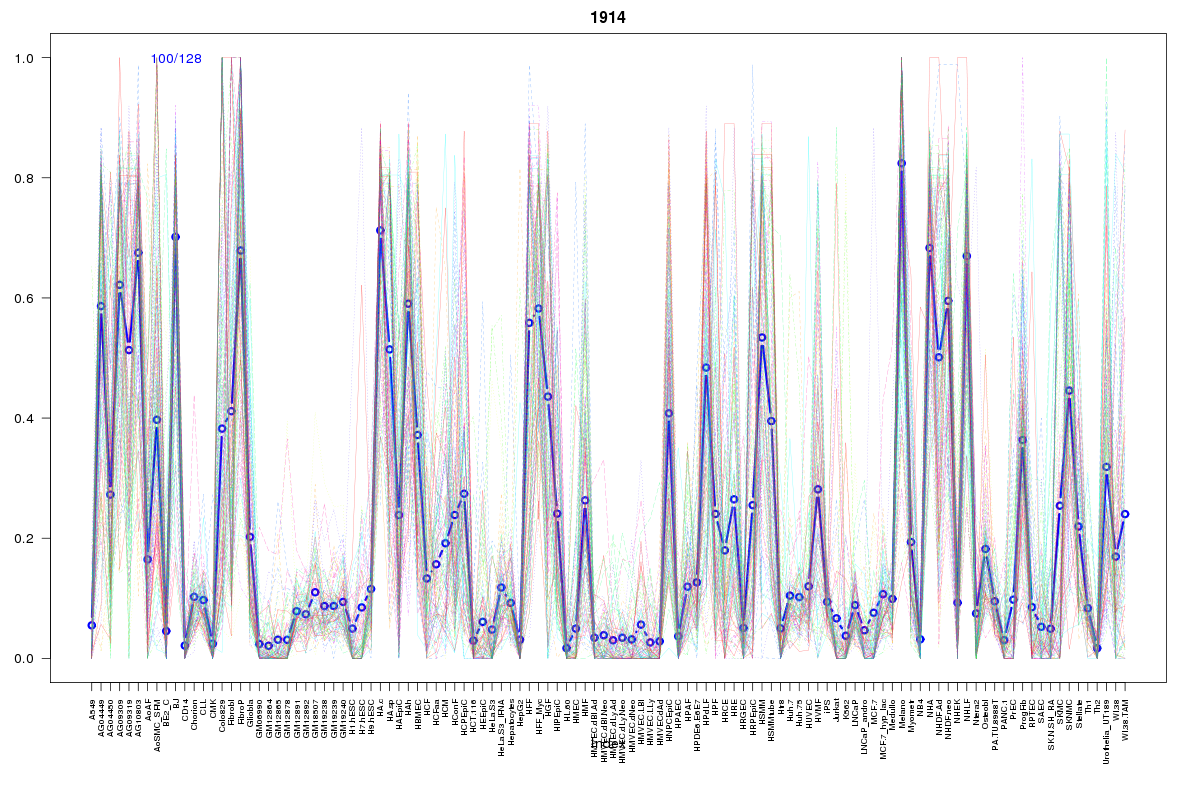 | 1914 | 2 |
 | 555 | 1 |
 | 860 | 1 |
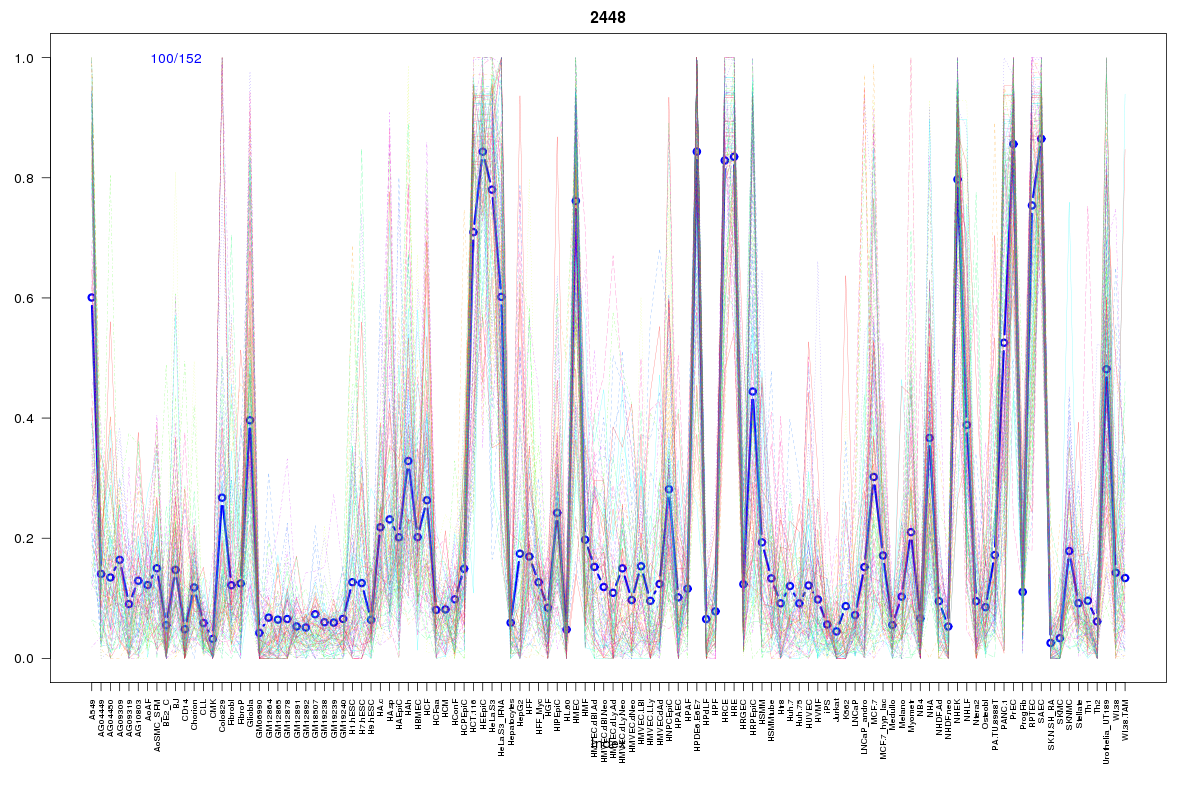 | 2448 | 1 |
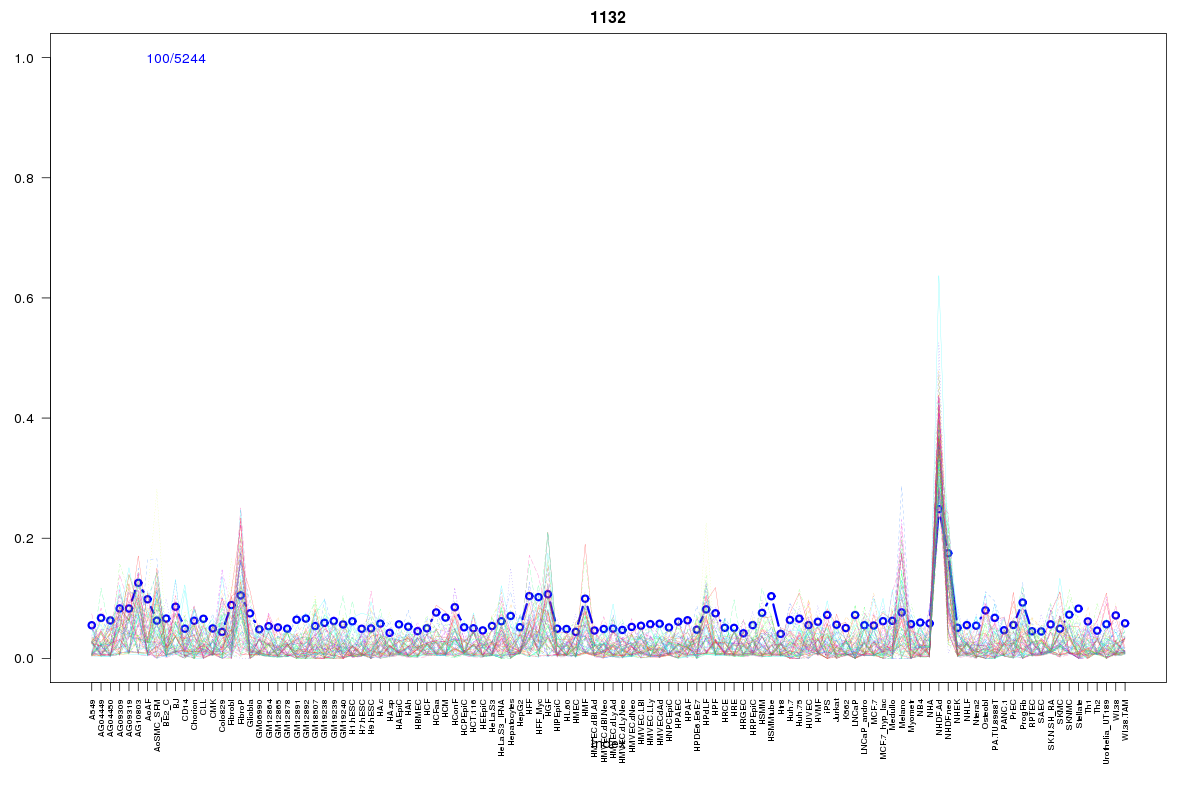 | 1132 | 1 |
 | 1495 | 1 |
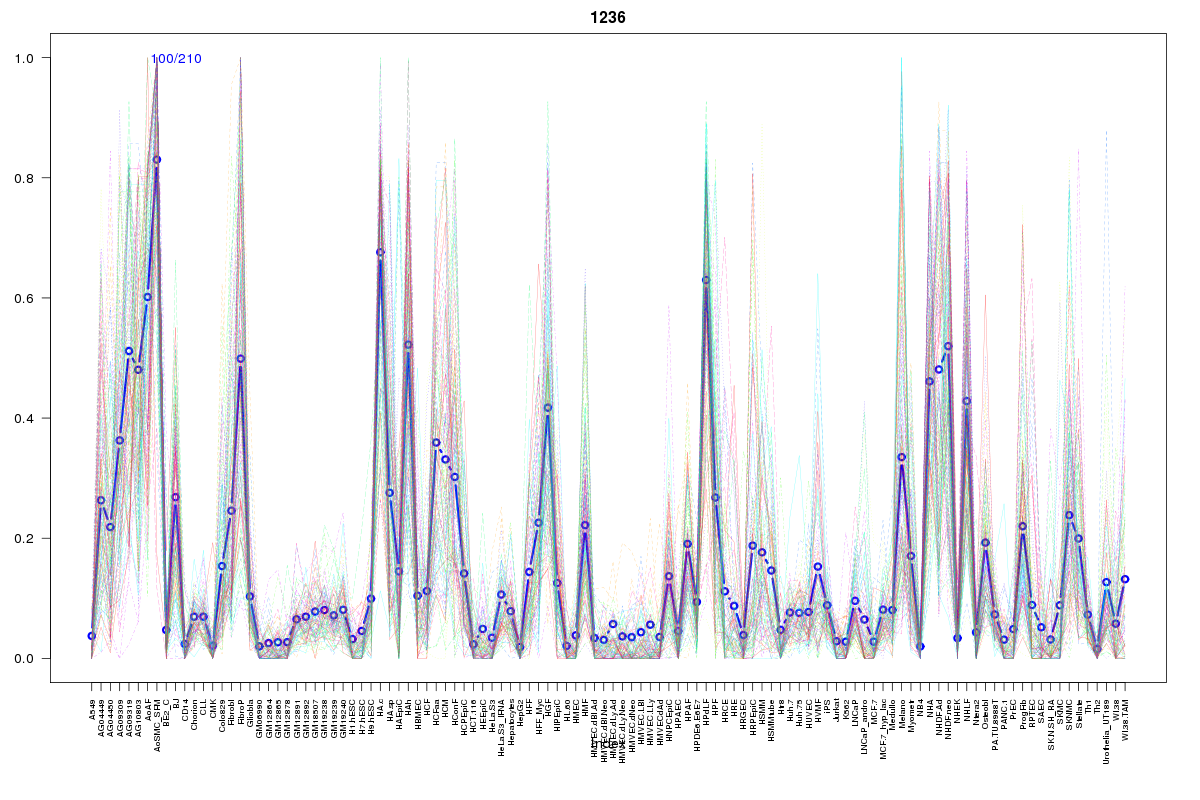 | 1236 | 1 |
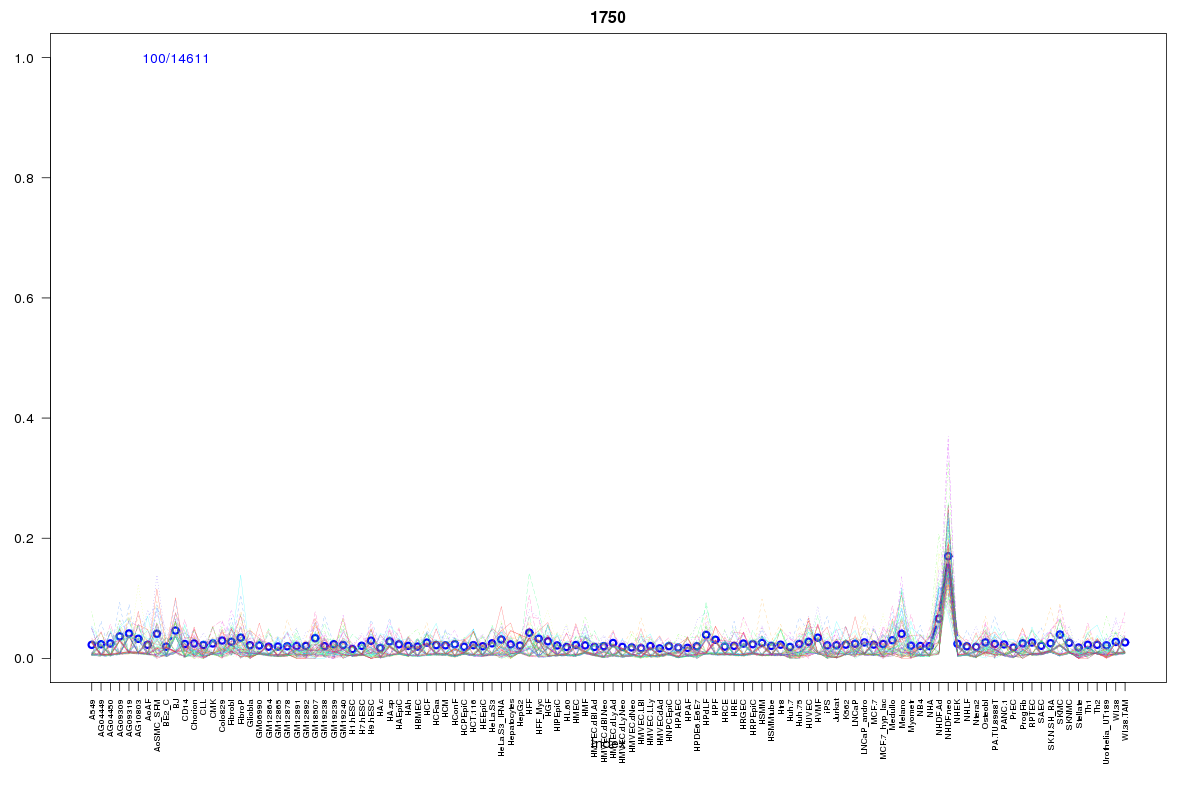 | 1750 | 1 |
Resources
BED file downloads
Connects to 11 DHS sitesTop 10 Correlated DHS Sites
p-values indiciate significant higher or lower correlation| Location | Cluster | P-value |
|---|---|---|
| chr1:168698420-168698570 | 1495 | 0 |
| chr1:168762000-168762150 | 1750 | 0.002 |
| chr1:168678400-168678550 | 1914 | 0.003 |
| chr1:168695620-168695770 | 1132 | 0.007 |
| chr1:168678560-168678710 | 1914 | 0.008 |
| chr1:168664865-168665015 | 860 | 0.013 |
| chr1:168737260-168737410 | 1236 | 0.016 |
| chr1:168608065-168608215 | 2006 | 0.018 |
| chr1:168619905-168620055 | 2006 | 0.024 |
| chr1:168688700-168688850 | 2448 | 0.015 |
| chr1:168606780-168606930 | 555 | 0.003 |
External Databases
UCSCEnsembl (ENSG00000143196)