Gene: ATP8B2
chr1: 154298028-154310322Expression Profile
(log scale)
Graphical Connections
Distribution of linked clusters:
You may find it interesting if many of the connected DHS sites belong to the same cluster.| Cluster Profile | Cluster ID | Number of DHS sites in this cluster |
|---|---|---|
 | 626 | 3 |
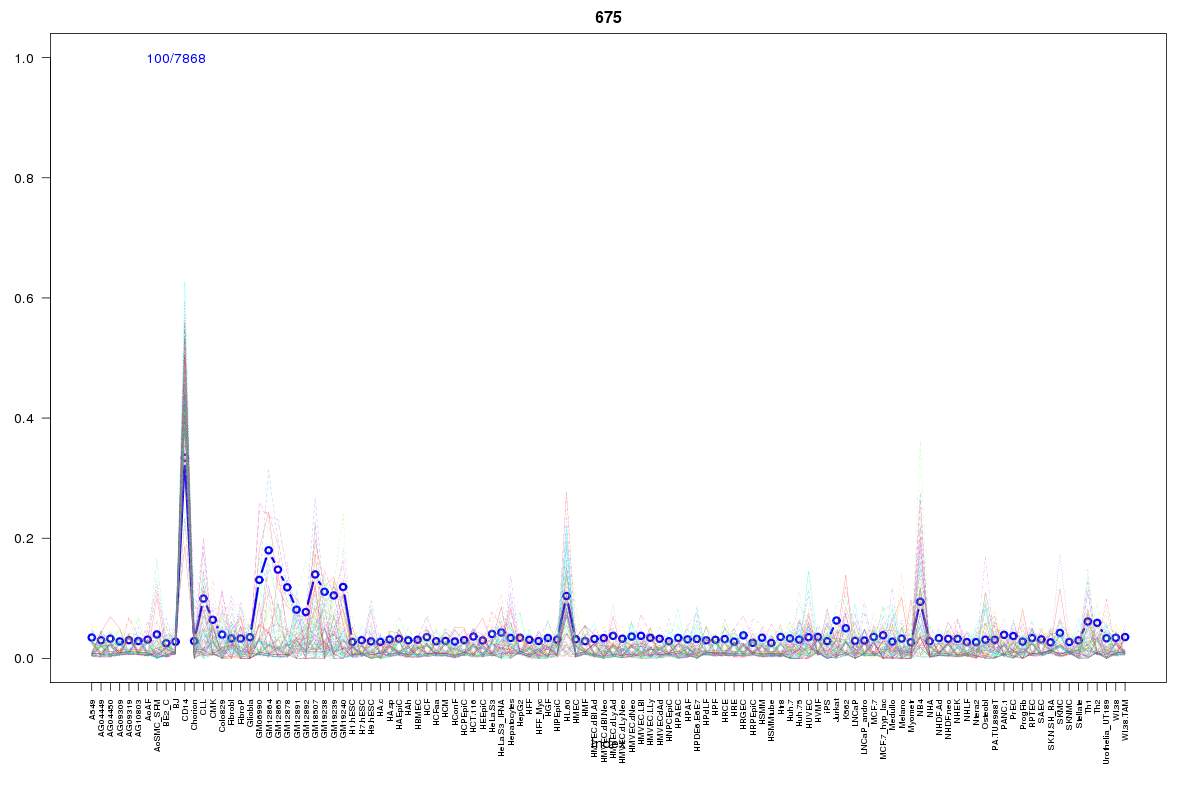 | 675 | 2 |
 | 2055 | 2 |
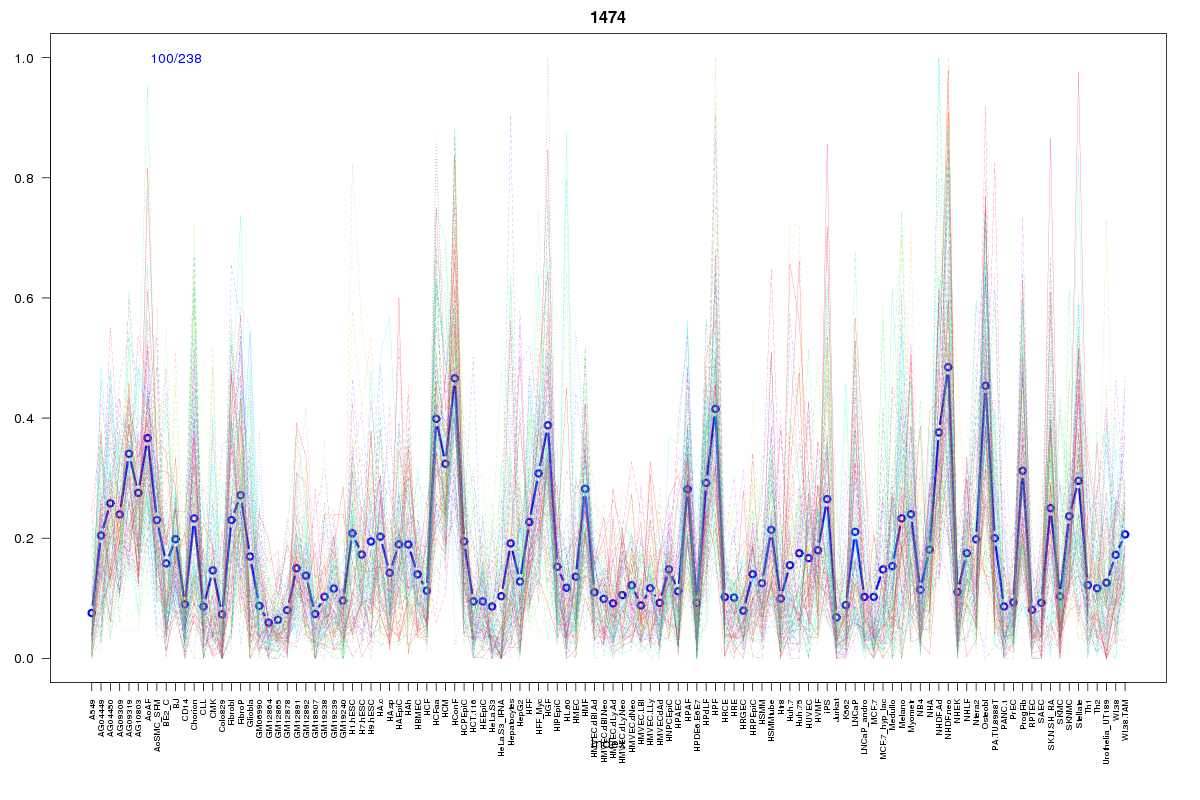 | 1474 | 1 |
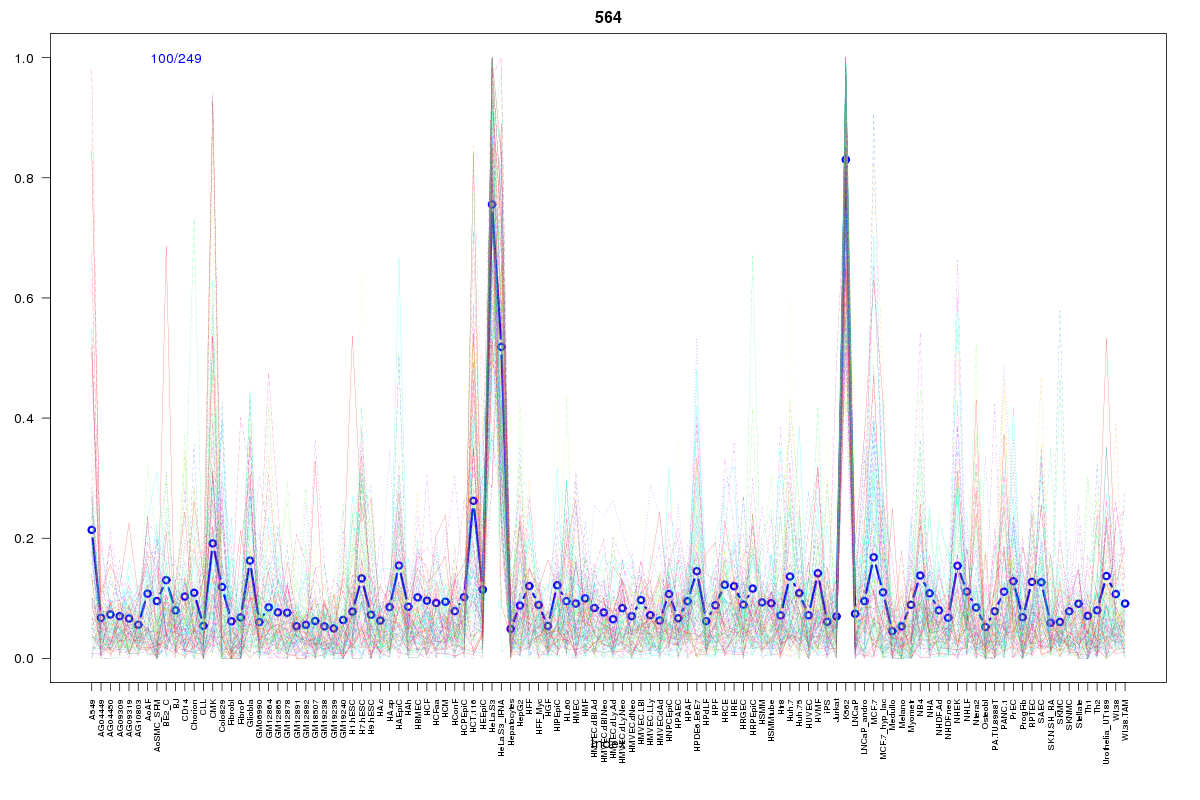 | 564 | 1 |
 | 326 | 1 |
 | 569 | 1 |
 | 421 | 1 |
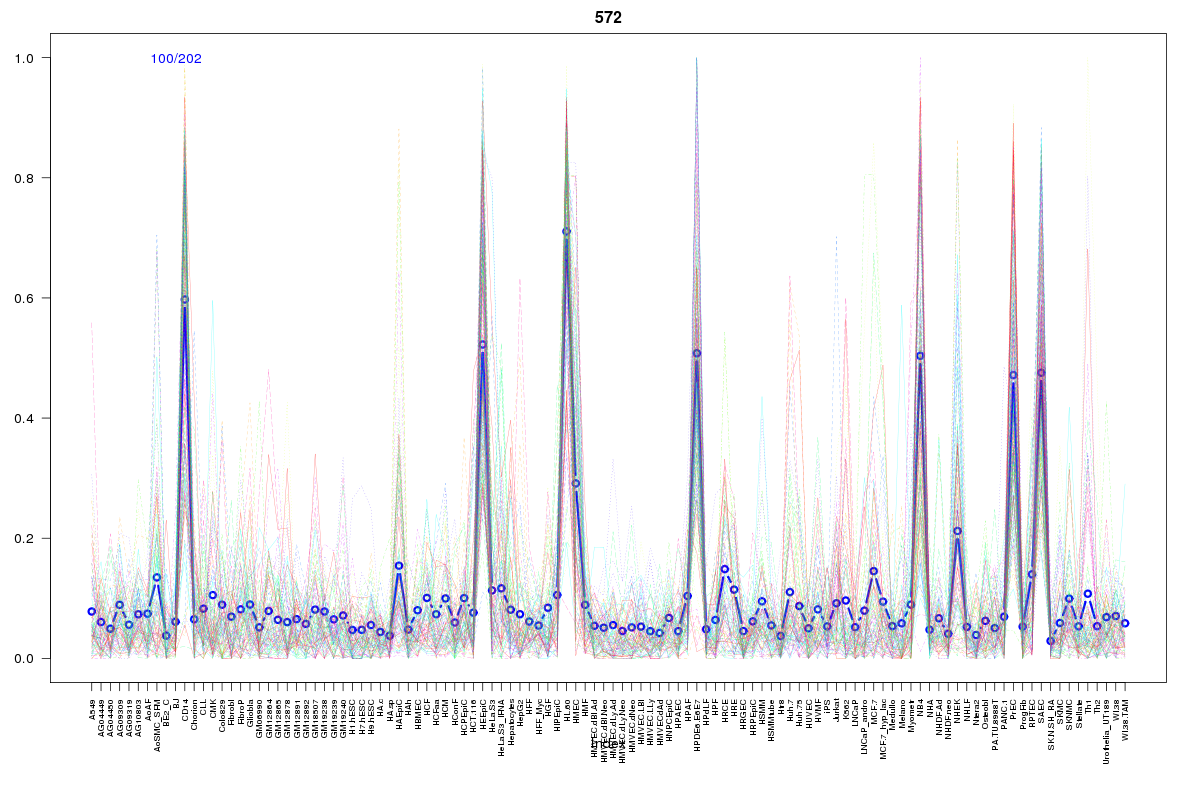 | 572 | 1 |
 | 2107 | 1 |
 | 2492 | 1 |
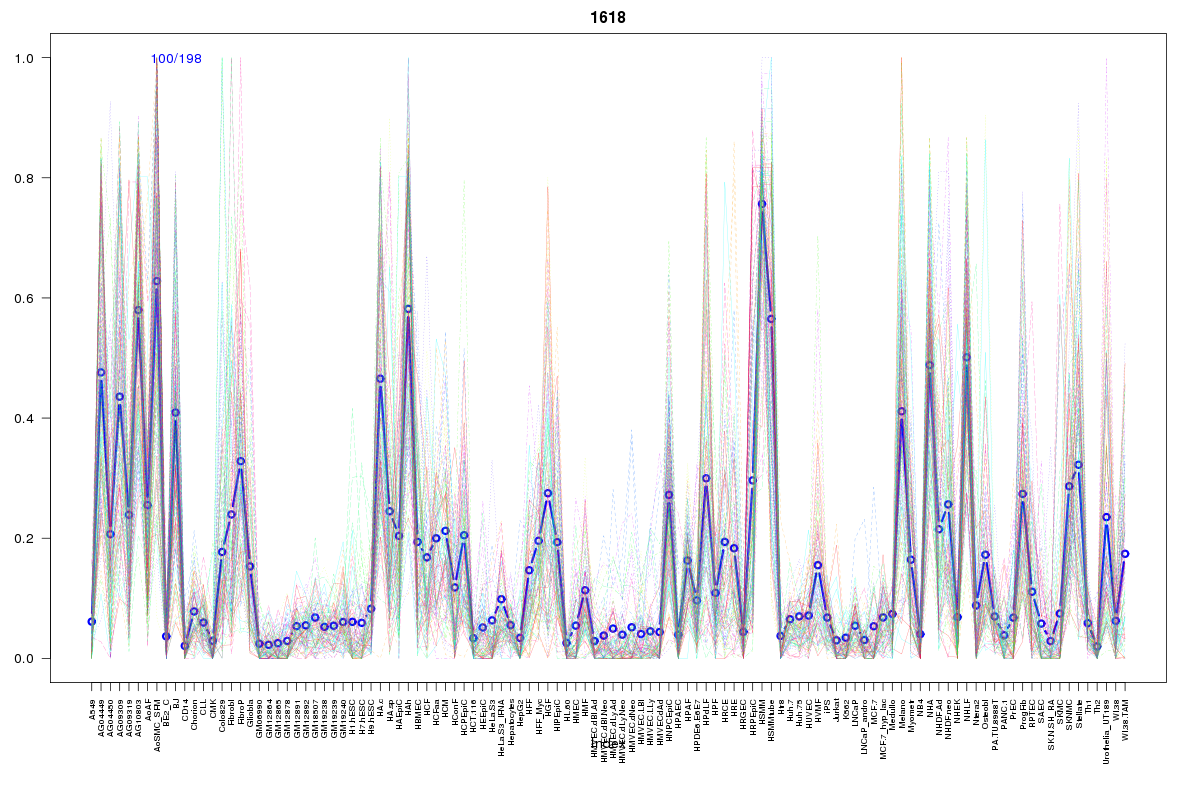 | 1618 | 1 |
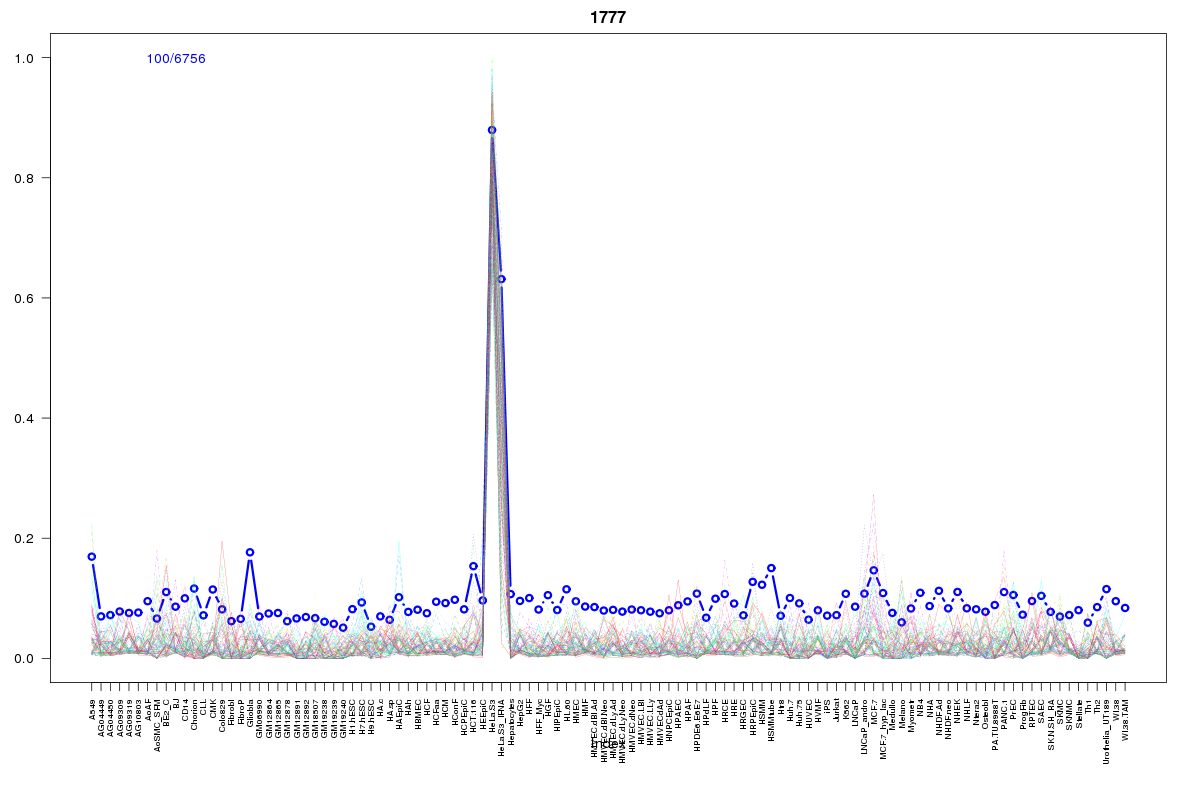 | 1777 | 1 |
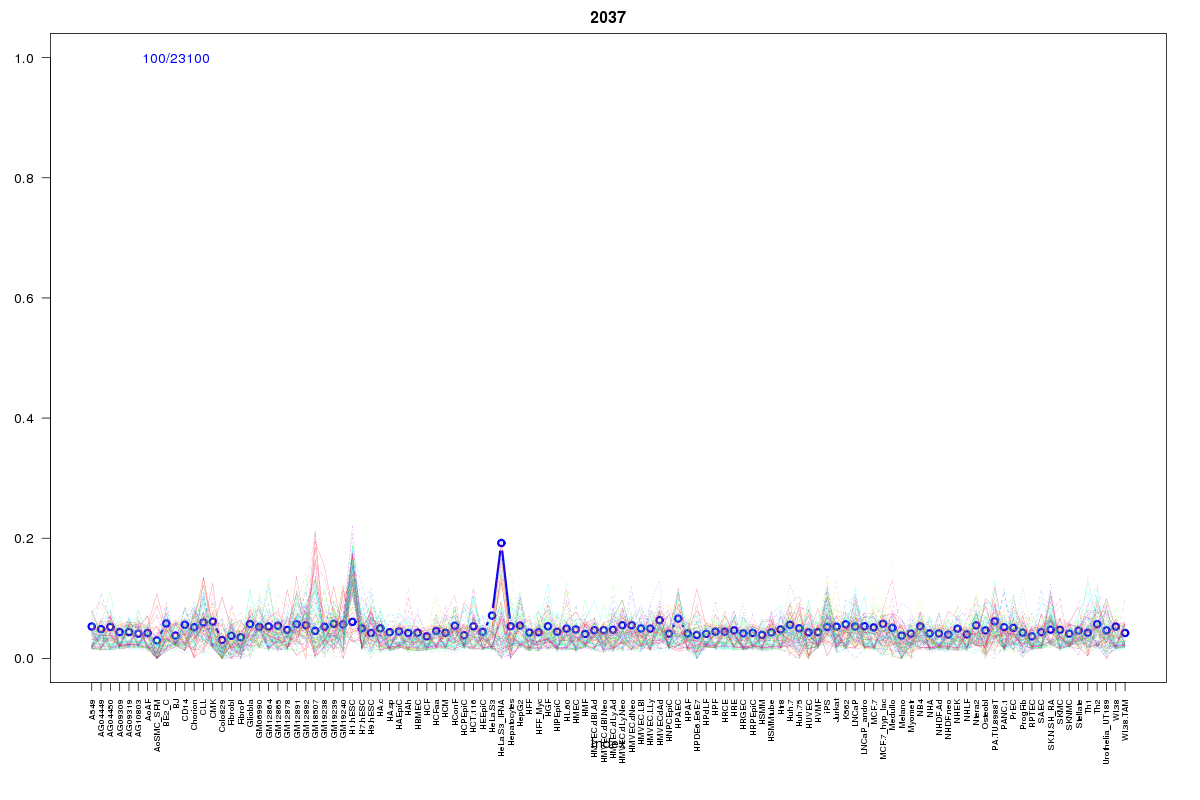 | 2037 | 1 |
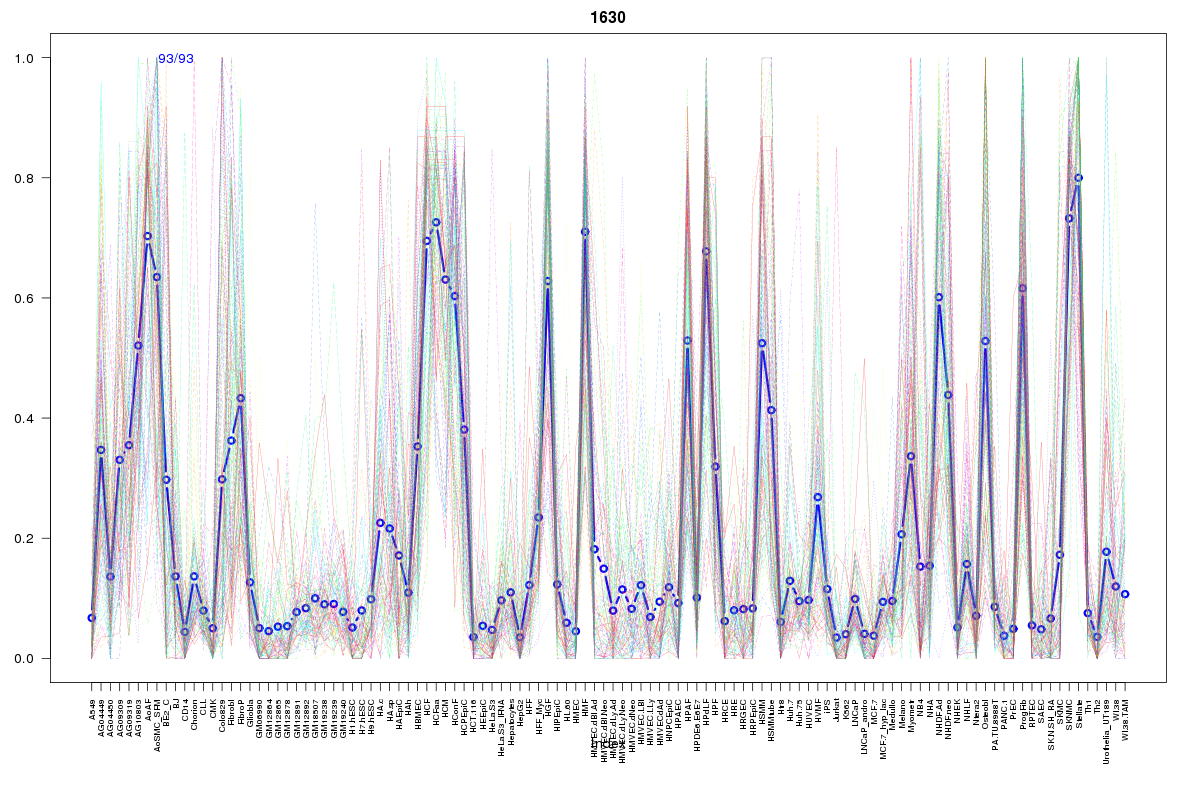 | 1630 | 1 |
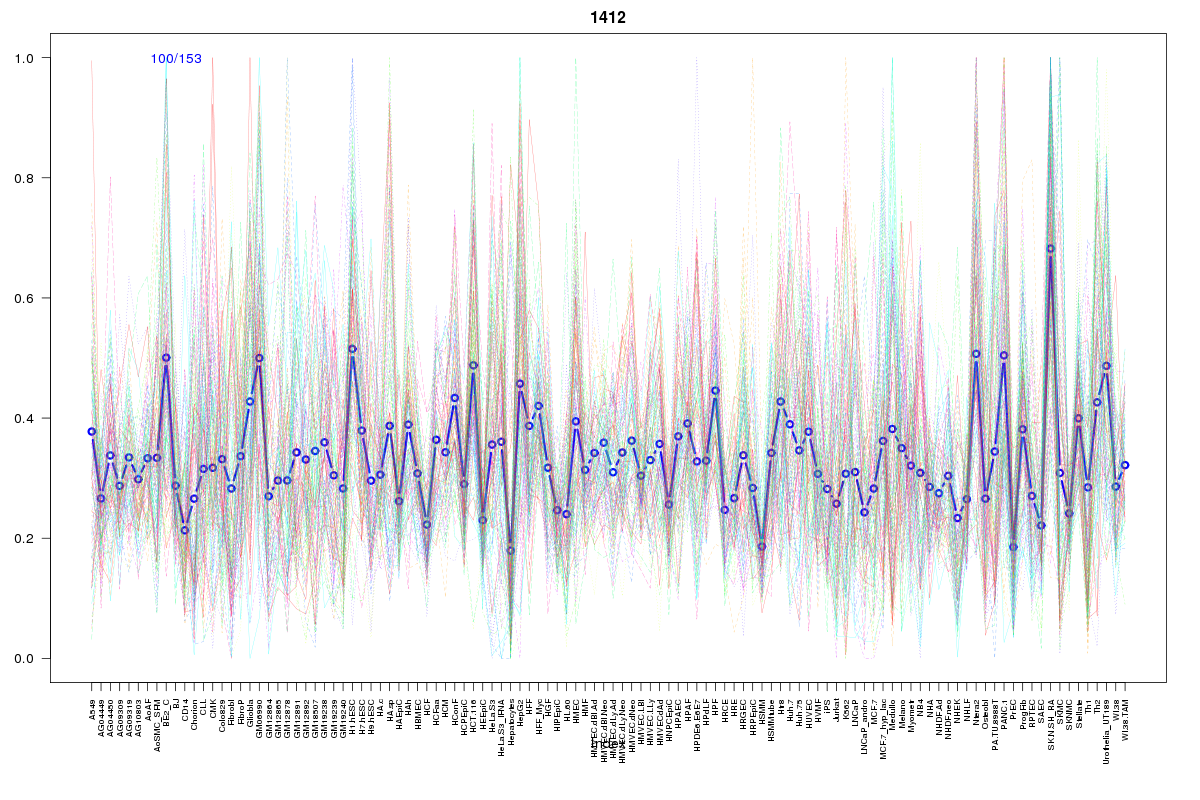 | 1412 | 1 |
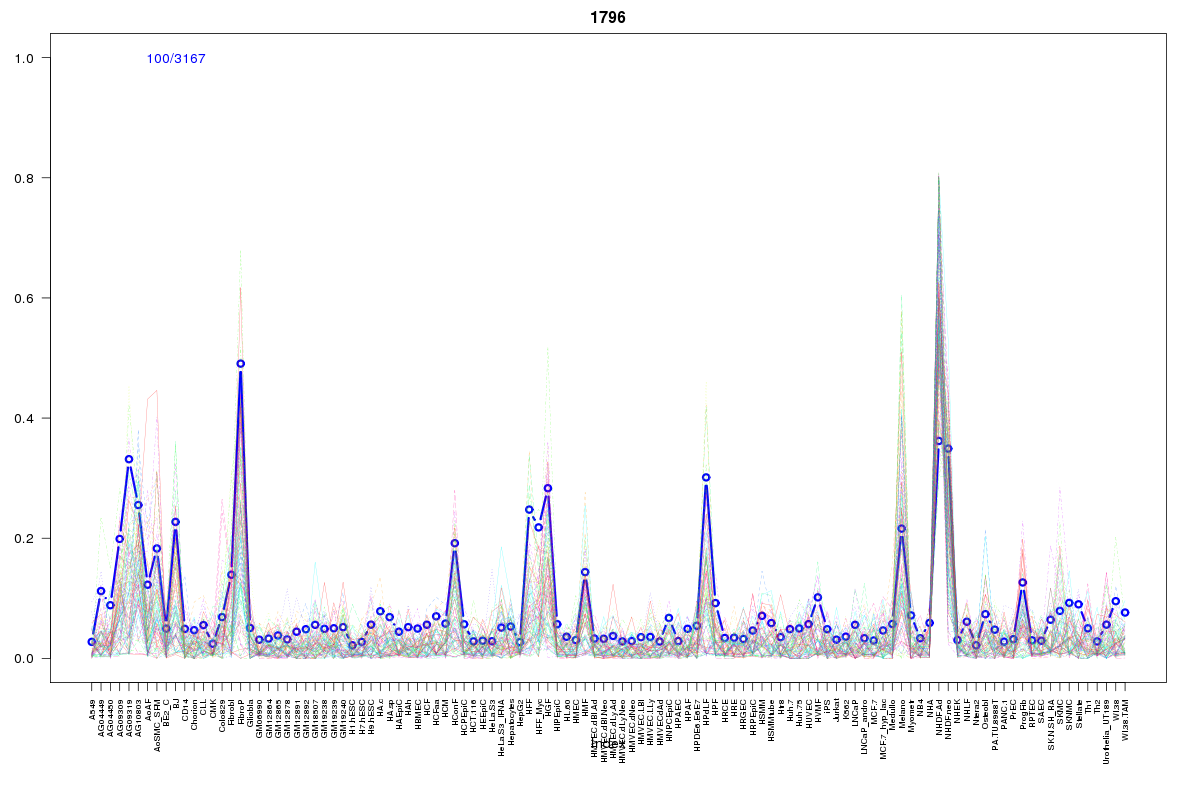 | 1796 | 1 |
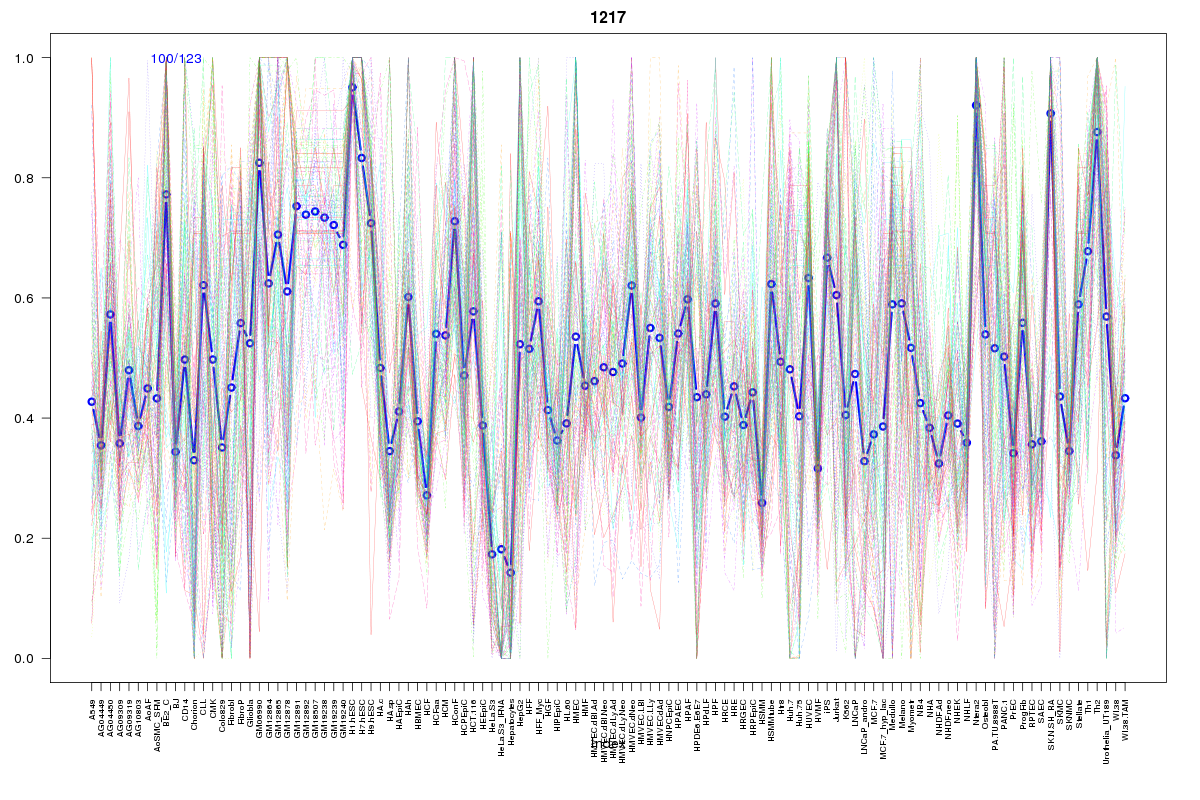 | 1217 | 1 |
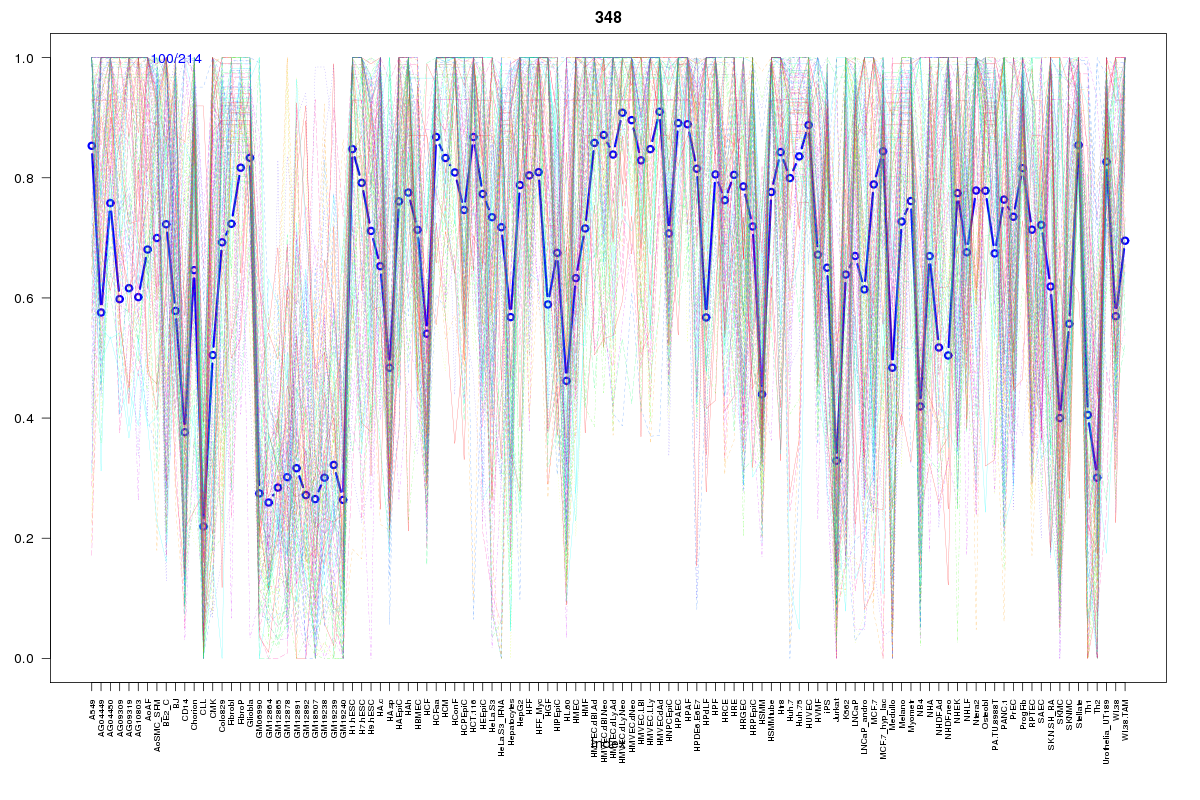 | 348 | 1 |
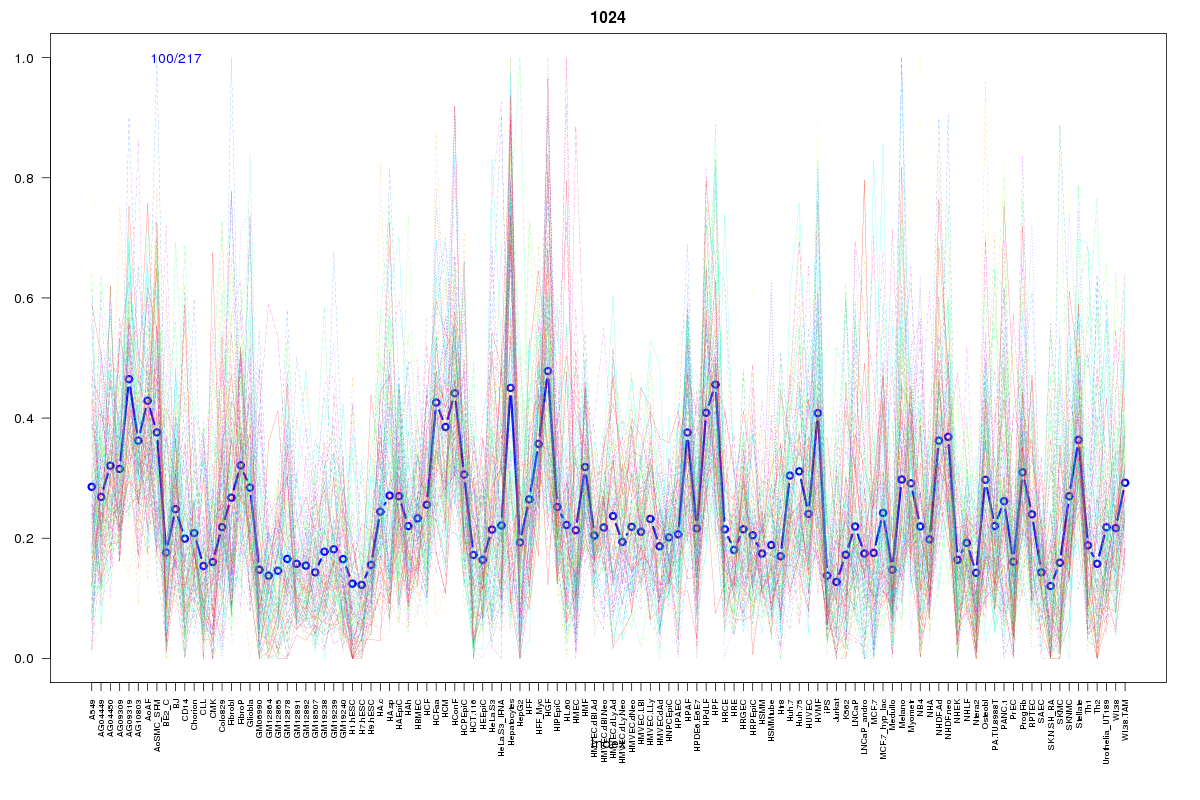 | 1024 | 1 |
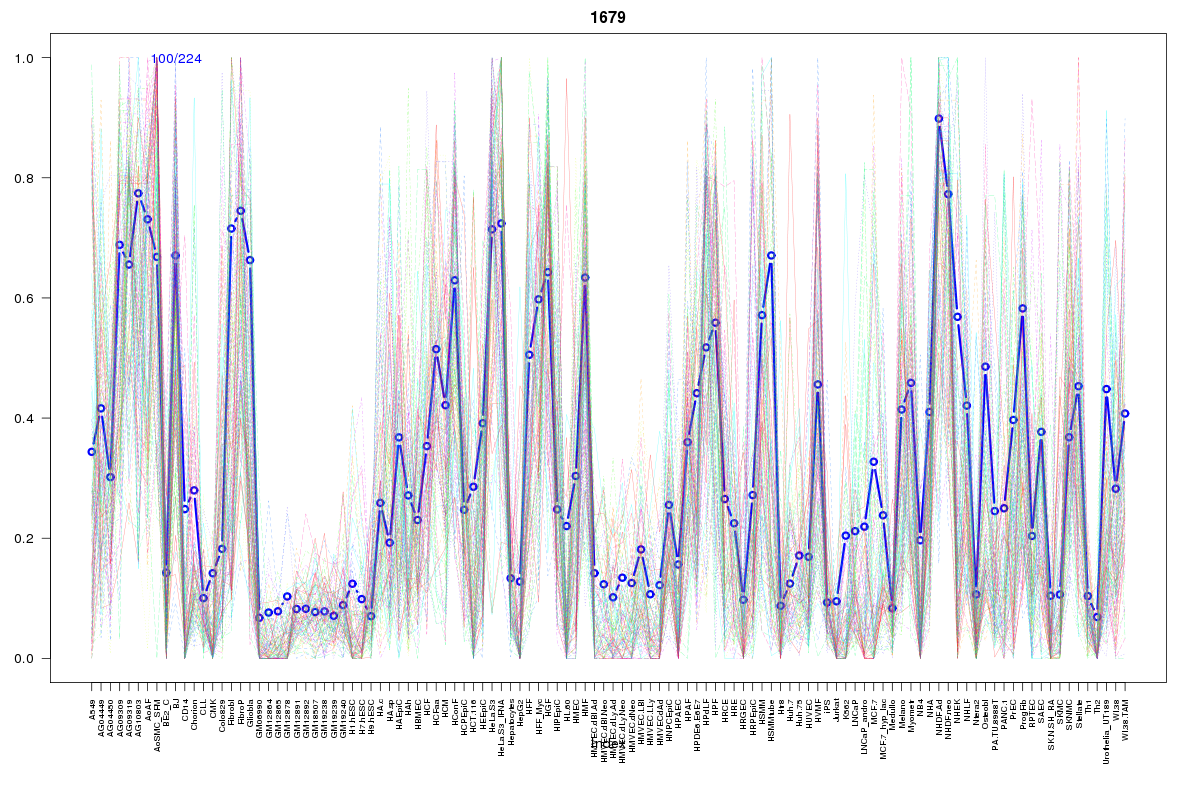 | 1679 | 1 |
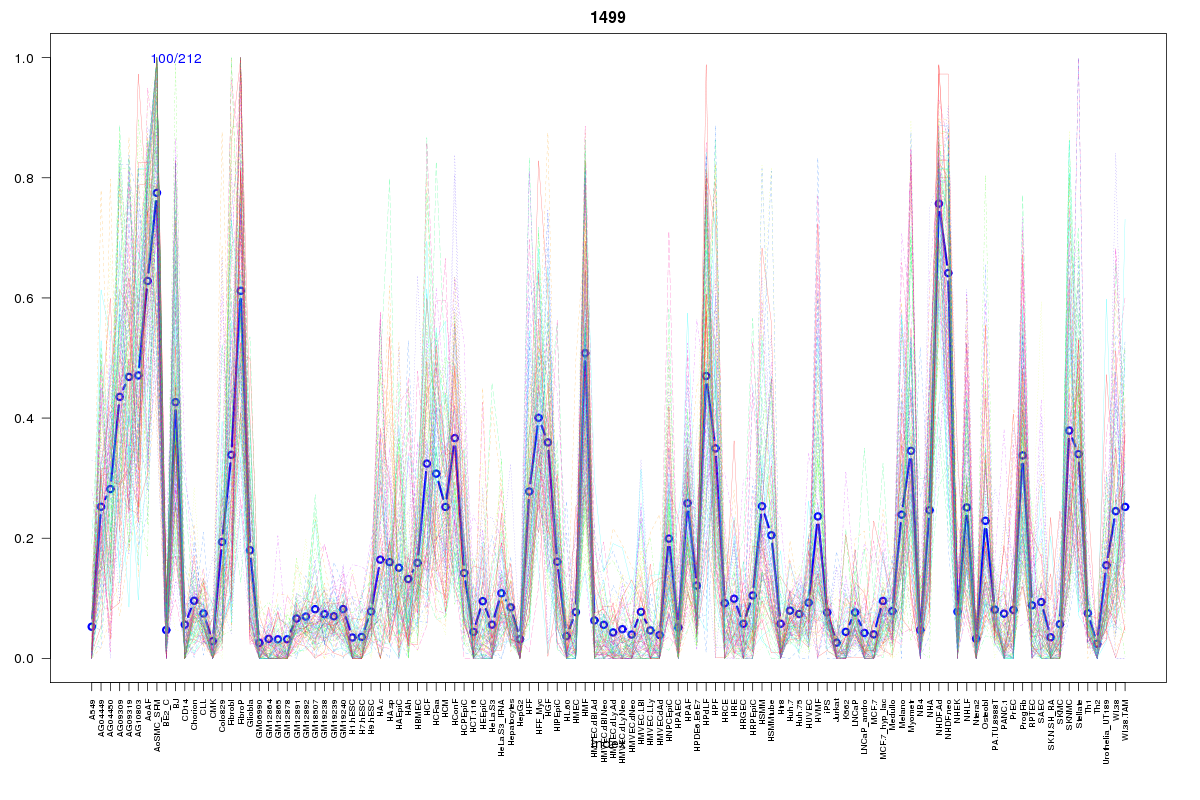 | 1499 | 1 |
Resources
BED file downloads
Connects to 26 DHS sitesTop 10 Correlated DHS Sites
p-values indiciate significant higher or lower correlation| Location | Cluster | P-value |
|---|---|---|
| chr1:154299240-154299390 | 1679 | 0.001 |
| chr1:154299420-154299570 | 1499 | 0.002 |
| chr1:154299045-154299195 | 1024 | 0.003 |
| chr1:154406960-154407110 | 1630 | 0.004 |
| chr1:154325360-154325510 | 1474 | 0.005 |
| chr1:154298800-154298950 | 348 | 0.006 |
| chr1:154407300-154407450 | 1796 | 0.014 |
| chr1:154297840-154297990 | 1217 | 0.017 |
| chr1:154278760-154278910 | 1618 | 0.018 |
| chr1:154297620-154297770 | 1412 | 0.019 |
| chr1:154394100-154394250 | 626 | 0.02 |
External Databases
UCSCEnsembl (ENSG00000143515)