Gene: TTC13
chr1: 231041988-231114605Expression Profile
(log scale)
Graphical Connections
Distribution of linked clusters:
You may find it interesting if many of the connected DHS sites belong to the same cluster.| Cluster Profile | Cluster ID | Number of DHS sites in this cluster |
|---|---|---|
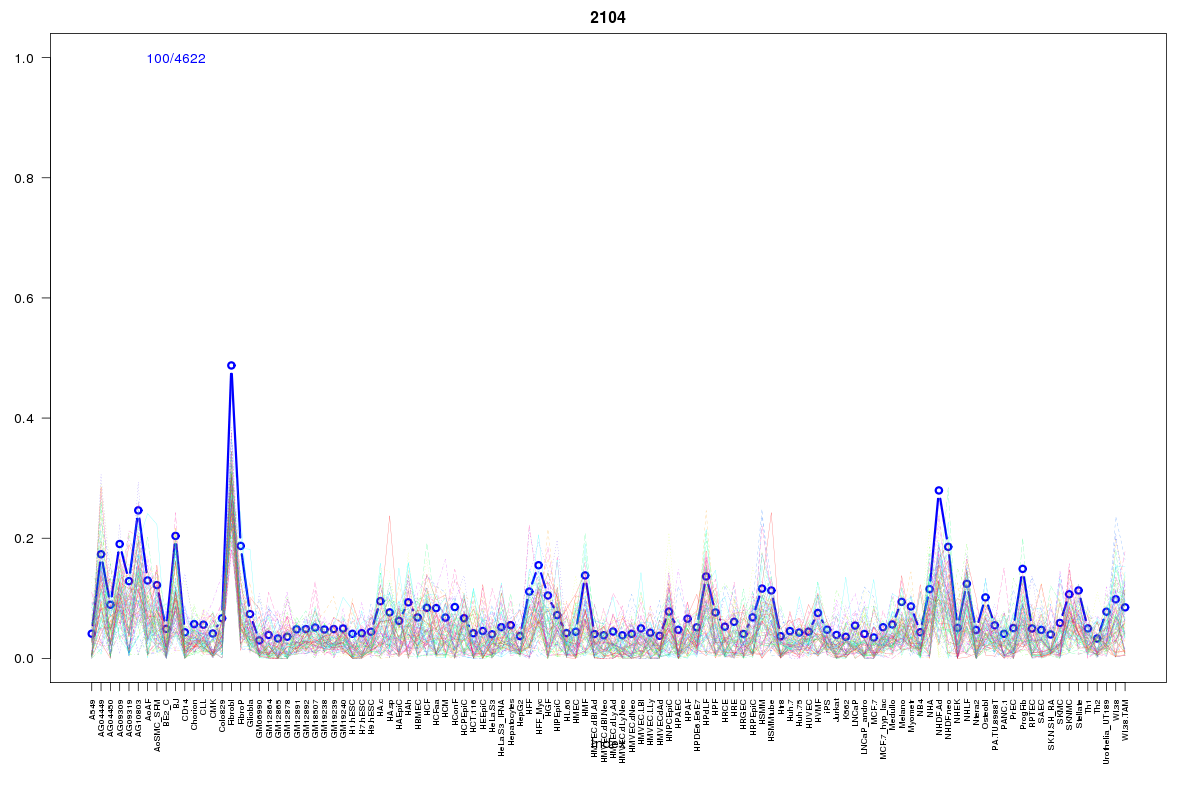 | 2104 | 2 |
 | 934 | 2 |
 | 251 | 1 |
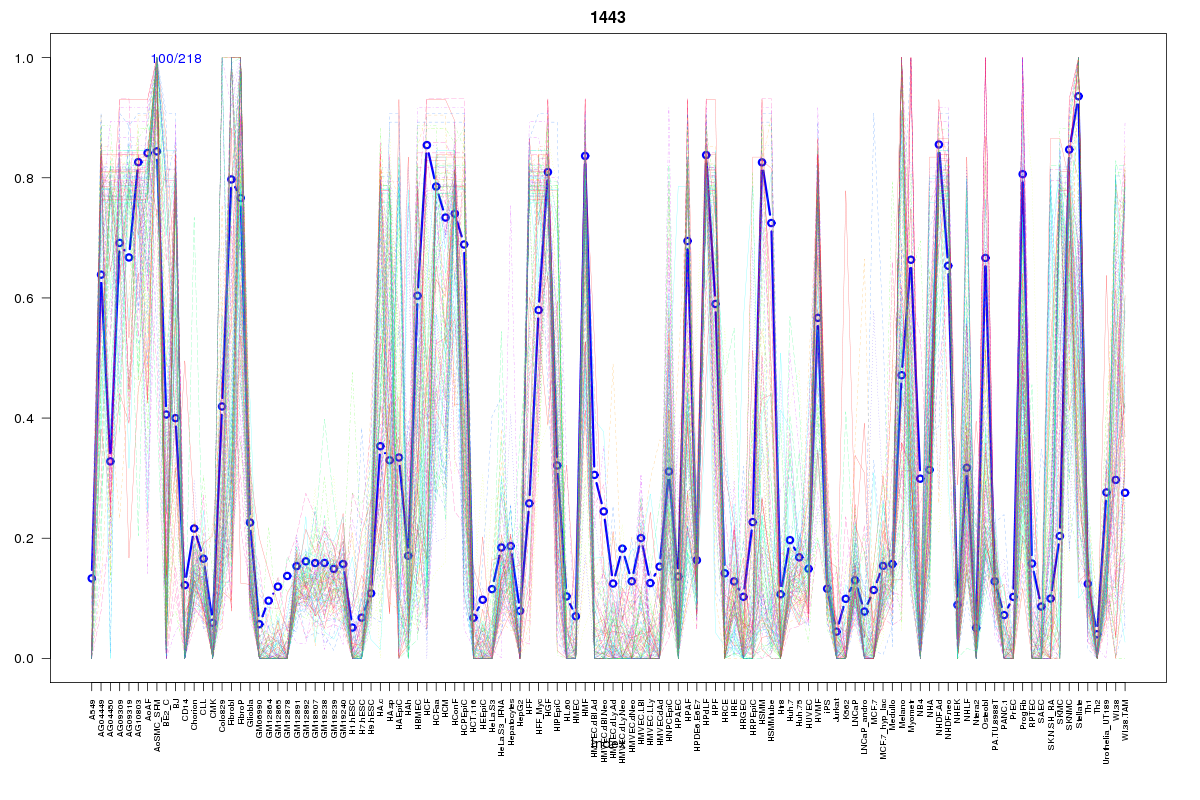 | 1443 | 1 |
 | 15 | 1 |
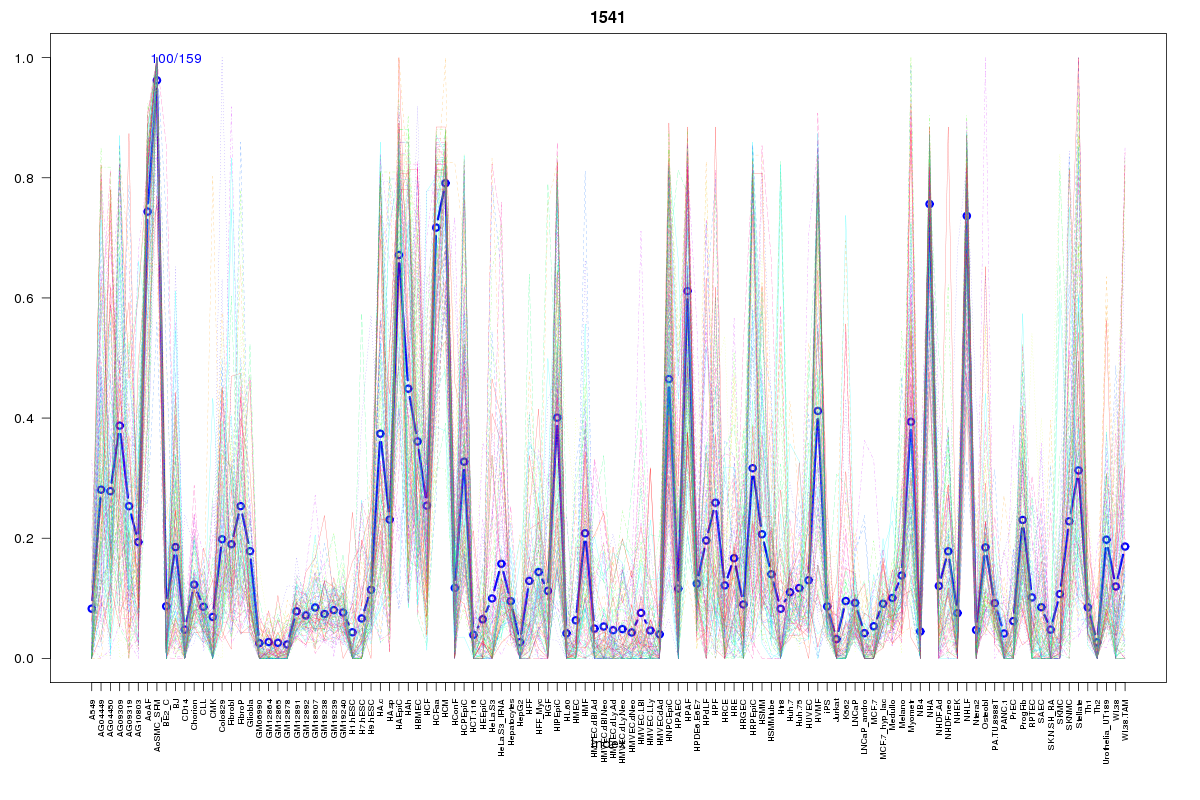 | 1541 | 1 |
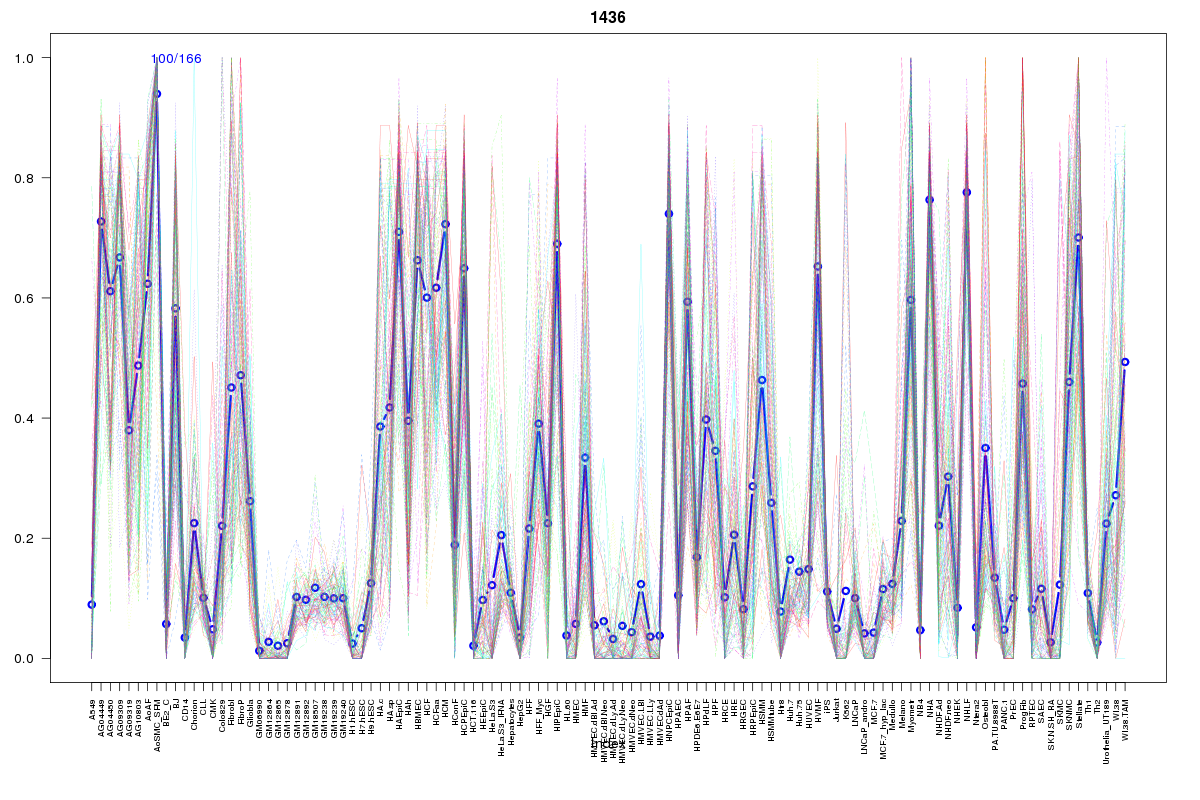 | 1436 | 1 |
 | 289 | 1 |
 | 2170 | 1 |
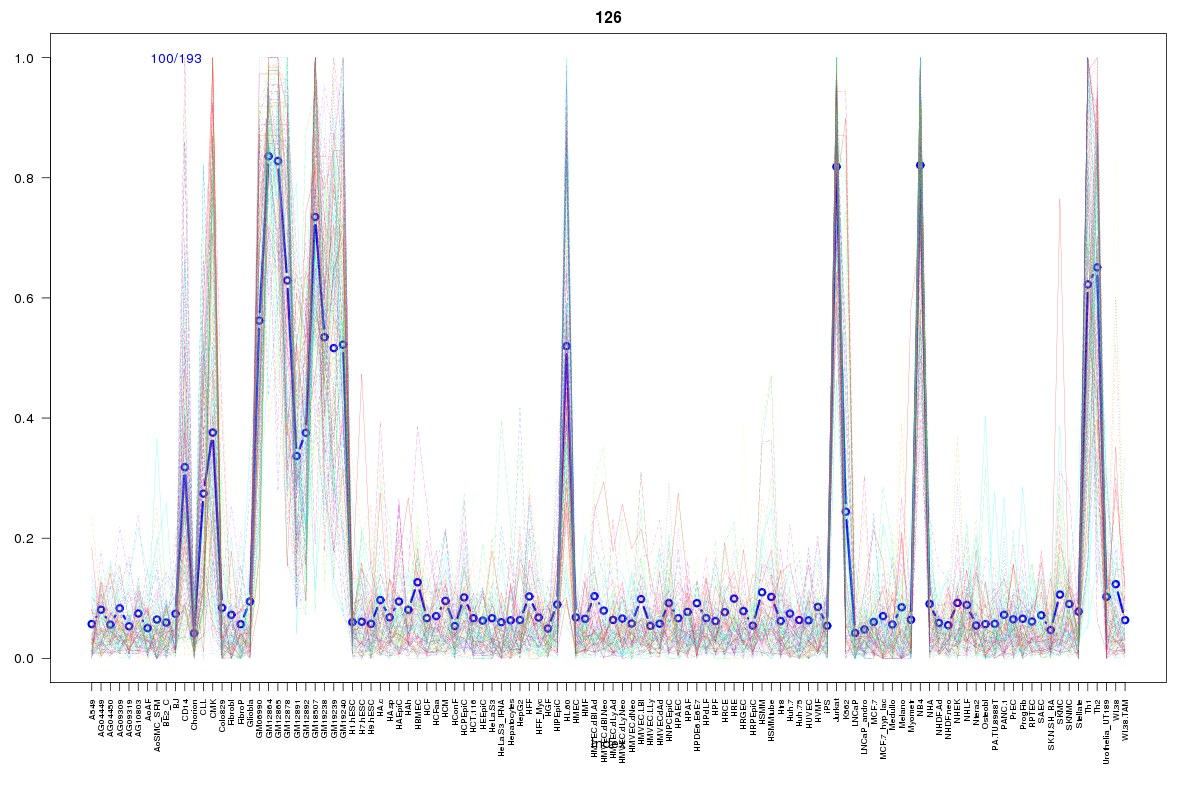 | 126 | 1 |
 | 2072 | 1 |
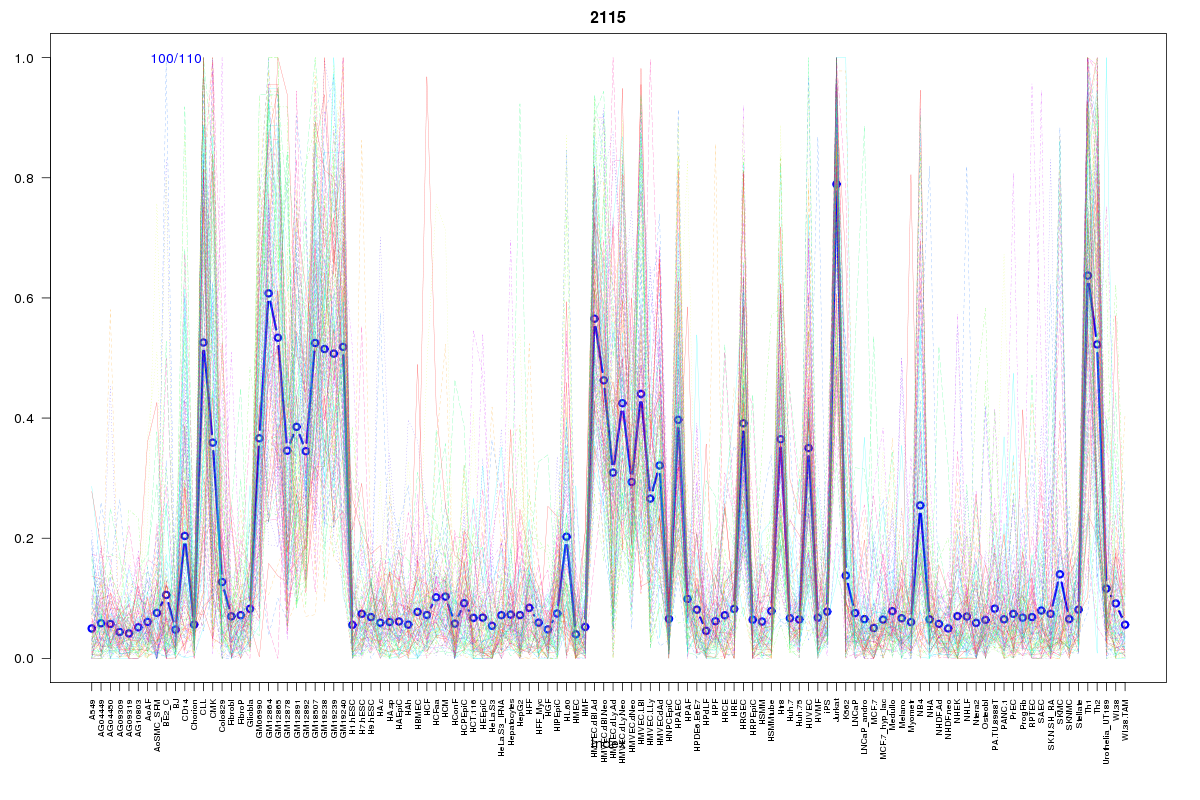 | 2115 | 1 |
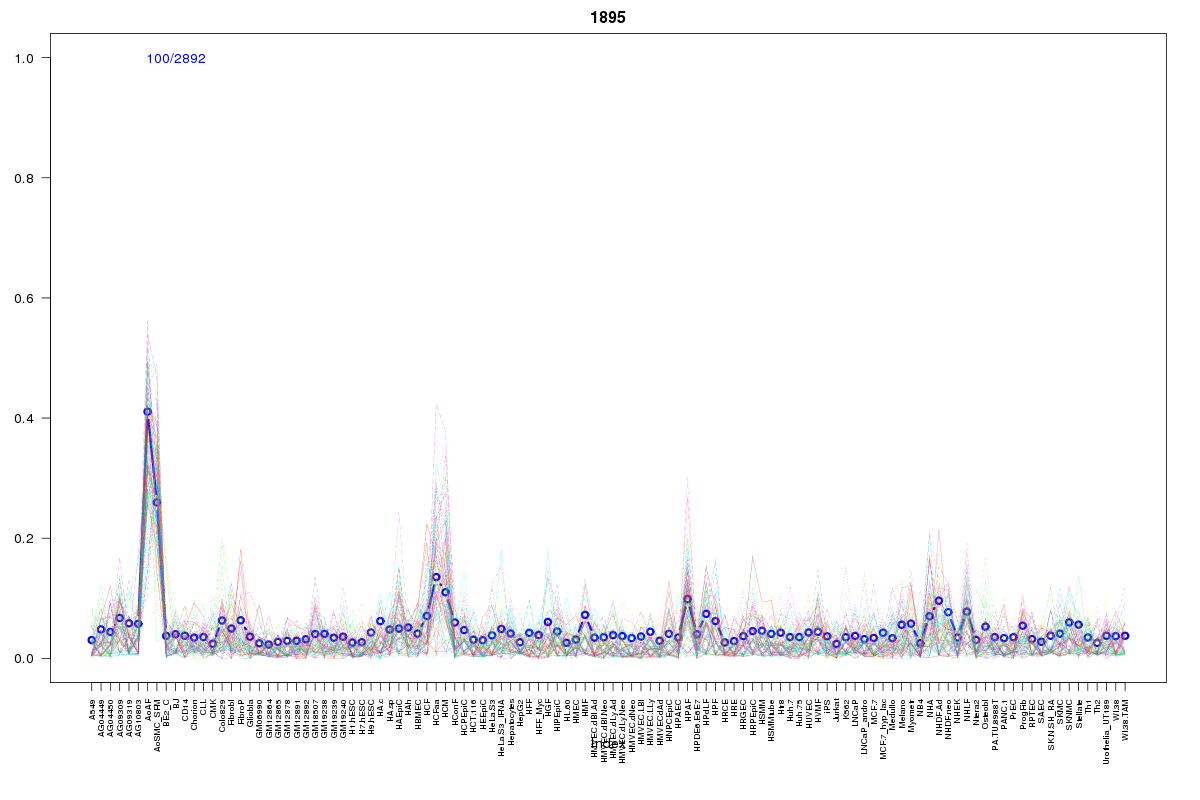 | 1895 | 1 |
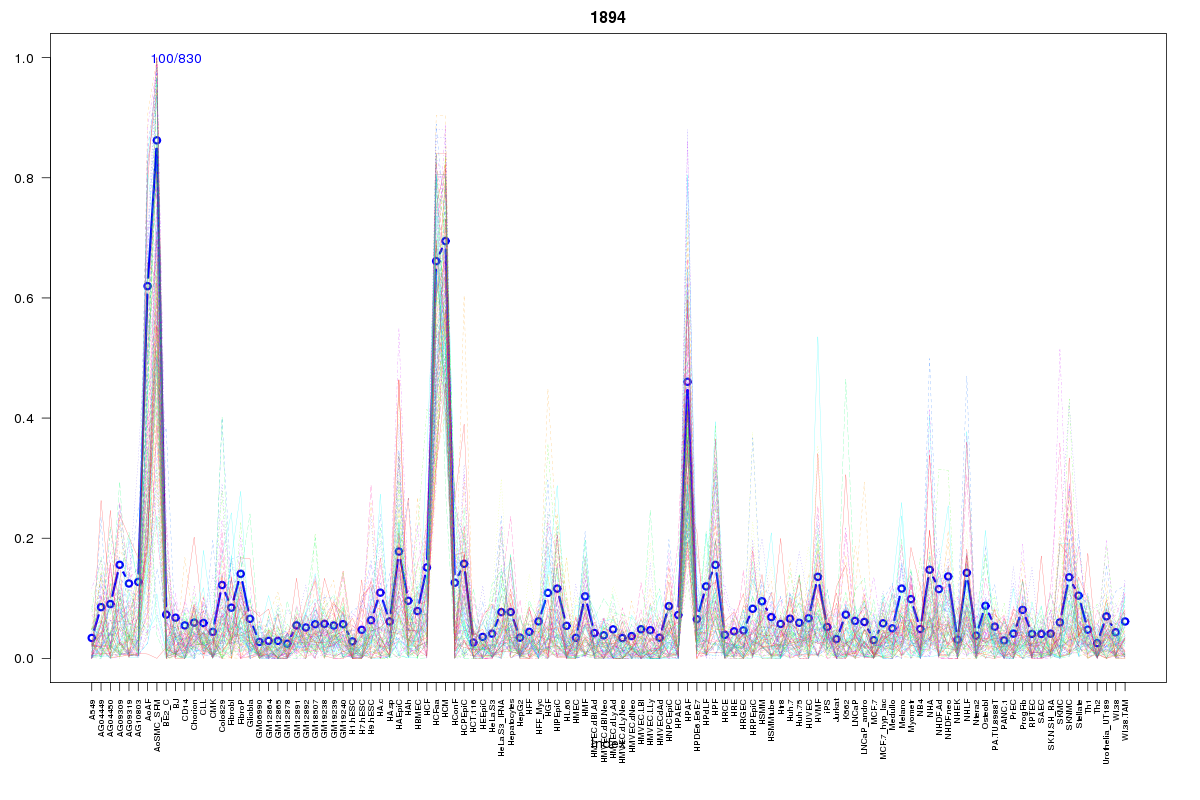 | 1894 | 1 |
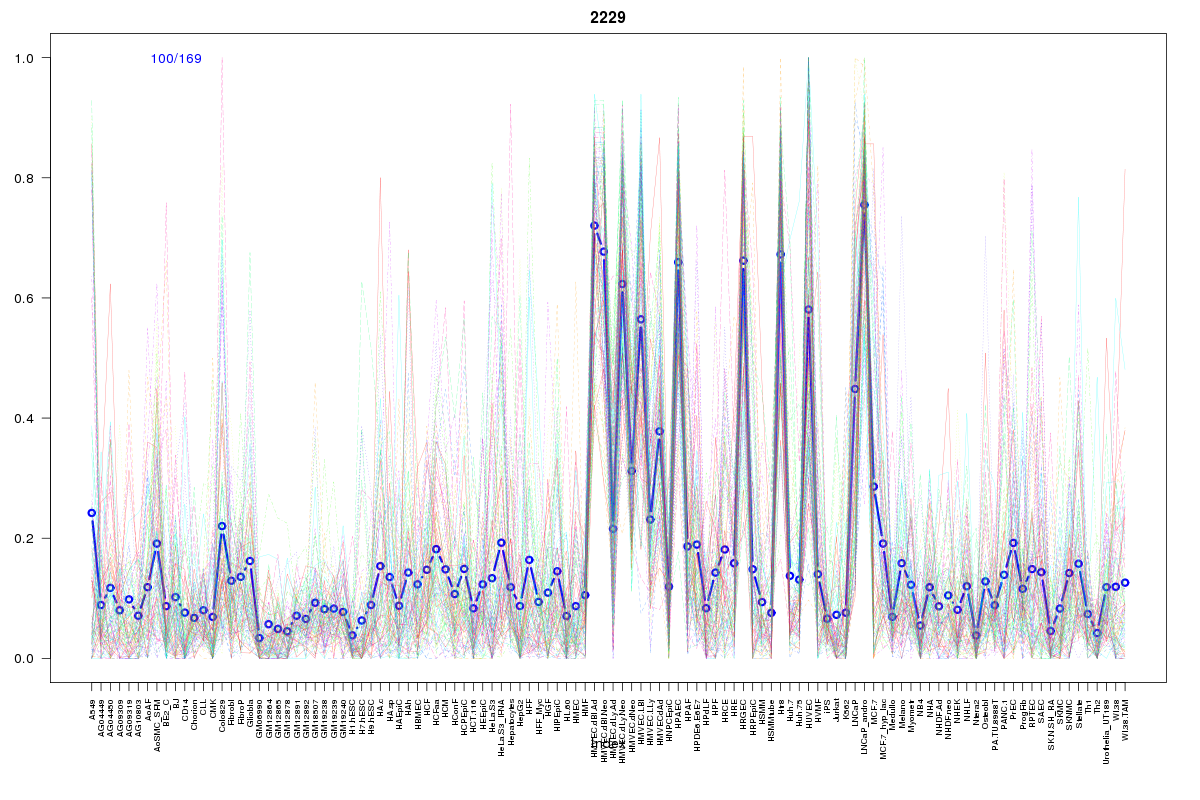 | 2229 | 1 |
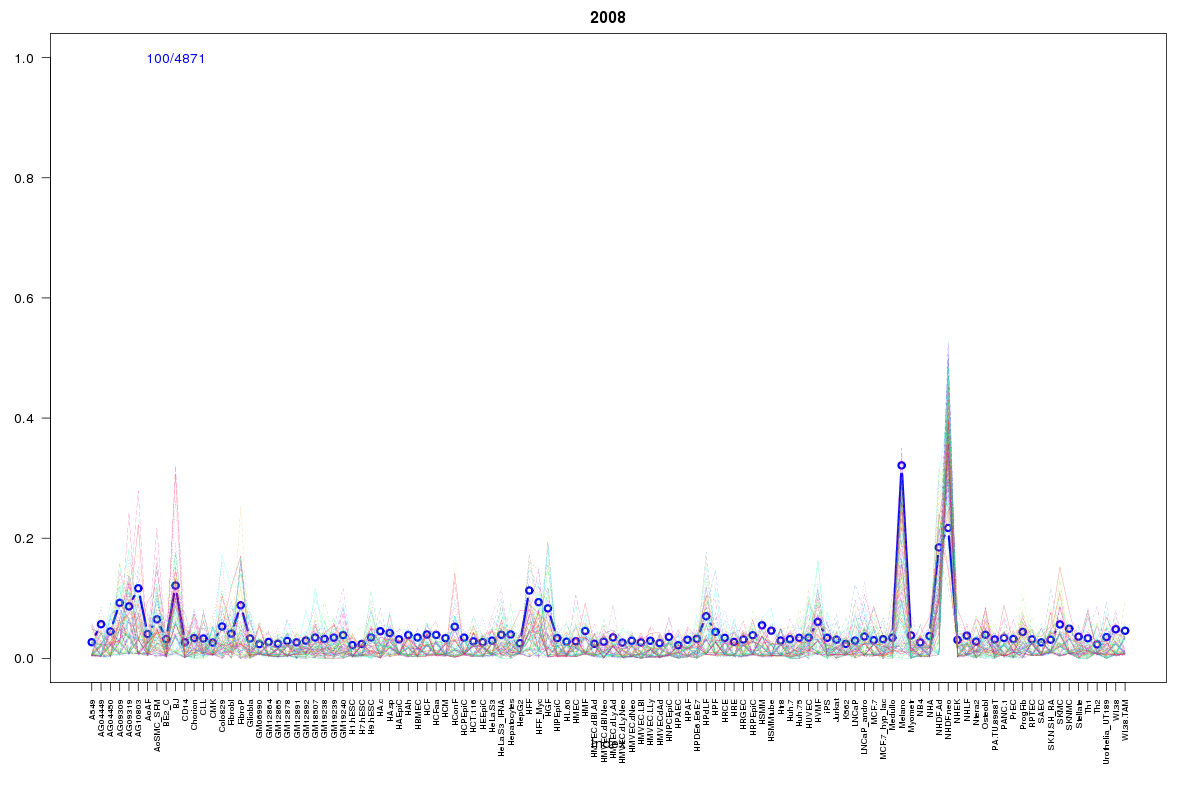 | 2008 | 1 |
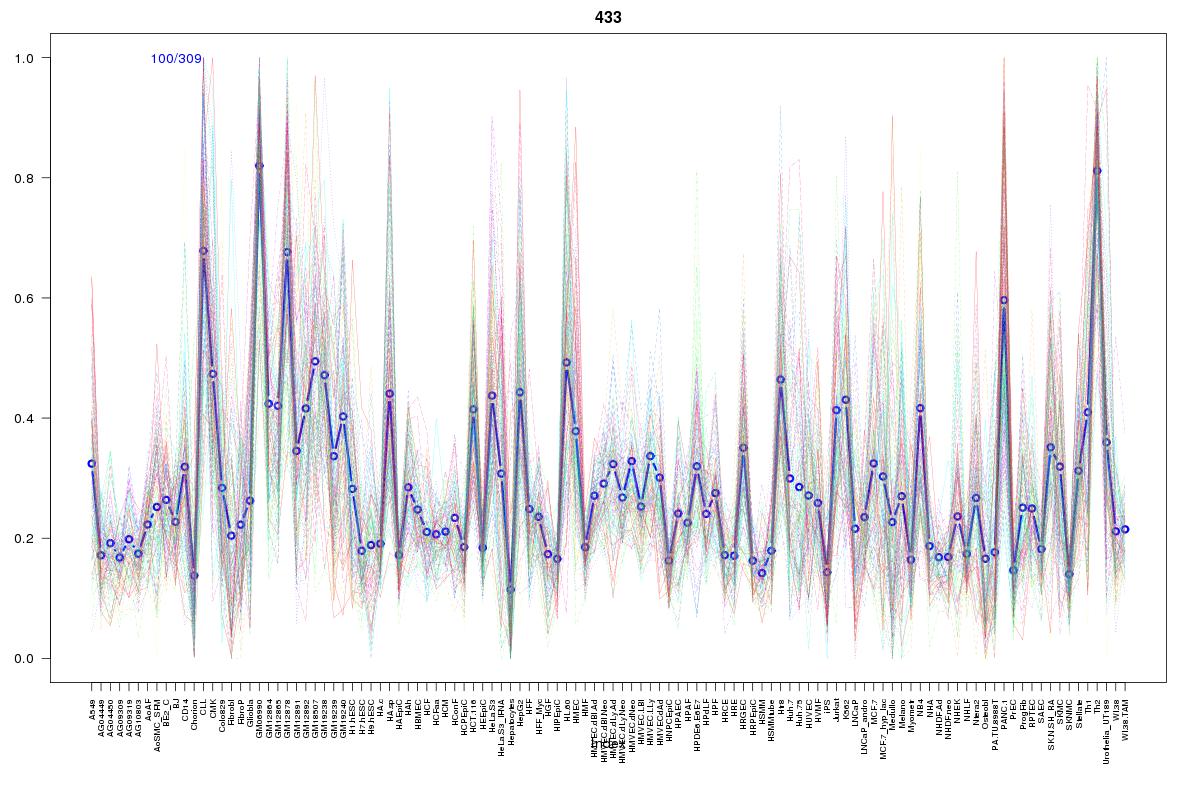 | 433 | 1 |
 | 416 | 1 |
 | 2211 | 1 |
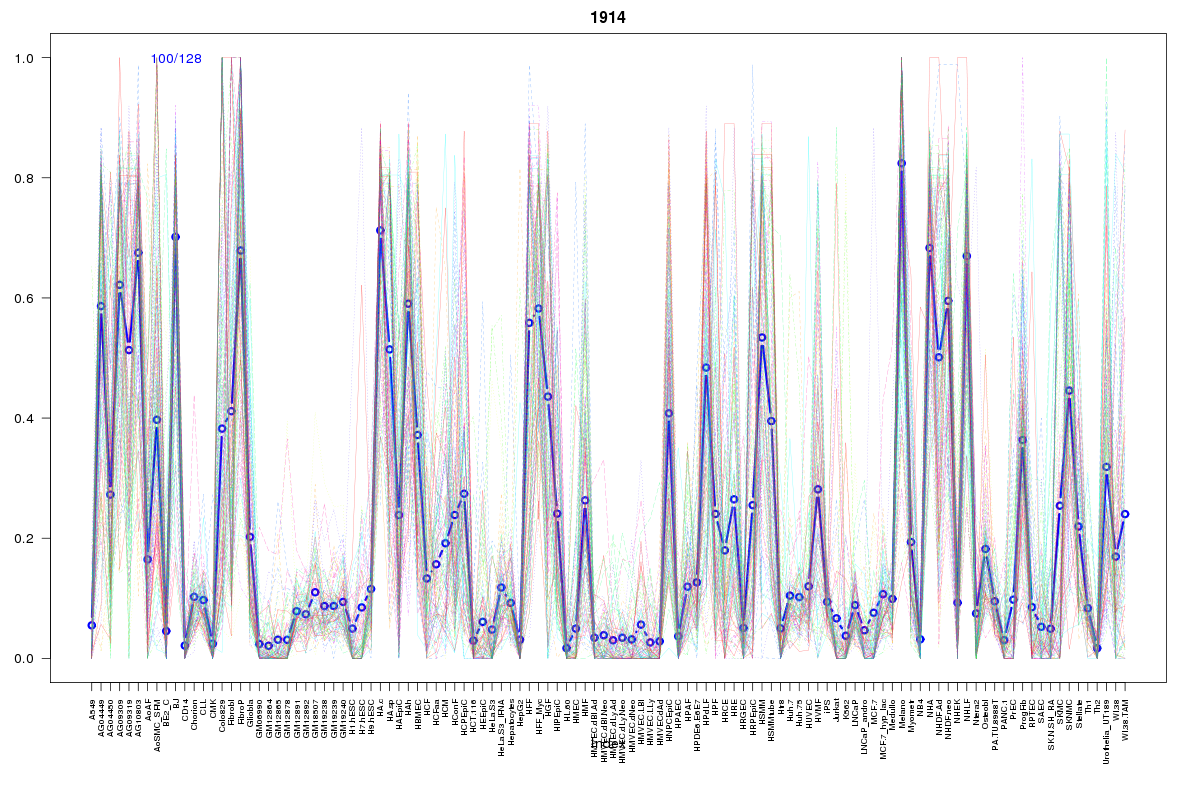 | 1914 | 1 |
 | 2122 | 1 |
Resources
BED file downloads
Connects to 23 DHS sitesTop 10 Correlated DHS Sites
p-values indiciate significant higher or lower correlation| Location | Cluster | P-value |
|---|---|---|
| chr1:231113140-231113290 | 2115 | 0 |
| chr1:231113320-231113470 | 934 | 0.001 |
| chr1:231108640-231108790 | 2170 | 0.001 |
| chr1:231109020-231109170 | 2072 | 0.001 |
| chr1:231053080-231053230 | 289 | 0.002 |
| chr1:231108820-231108970 | 126 | 0.006 |
| chr1:231113580-231113730 | 2229 | 0.007 |
| chr1:231115780-231115930 | 2211 | 0.007 |
| chr1:231114945-231115095 | 433 | 0.01 |
| chr1:231176305-231176455 | 2122 | 0.016 |
| chr1:231206805-231206955 | 934 | 0.021 |
External Databases
UCSCEnsembl (ENSG00000143643)