Gene: GLRA3
chr4: 175558064-175750465Expression Profile
(log scale)
Graphical Connections
Distribution of linked clusters:
You may find it interesting if many of the connected DHS sites belong to the same cluster.| Cluster Profile | Cluster ID | Number of DHS sites in this cluster |
|---|---|---|
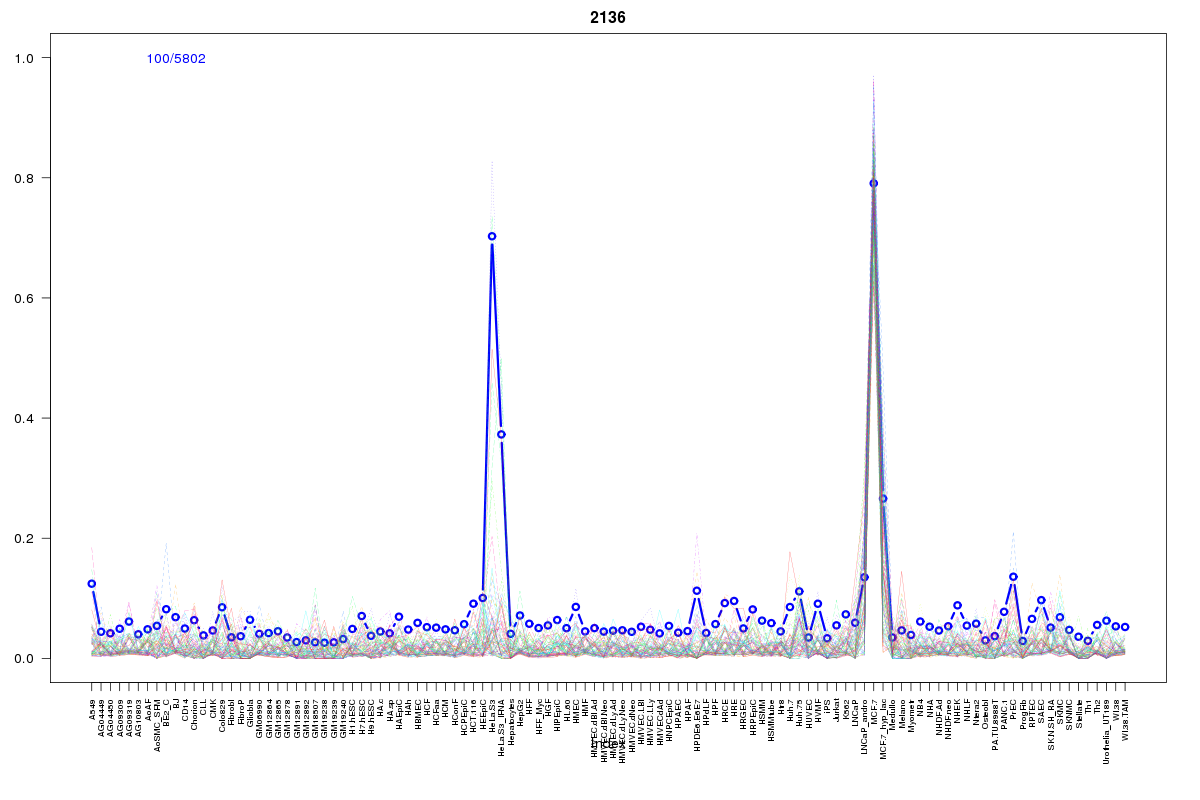 | 2136 | 2 |
 | 1605 | 2 |
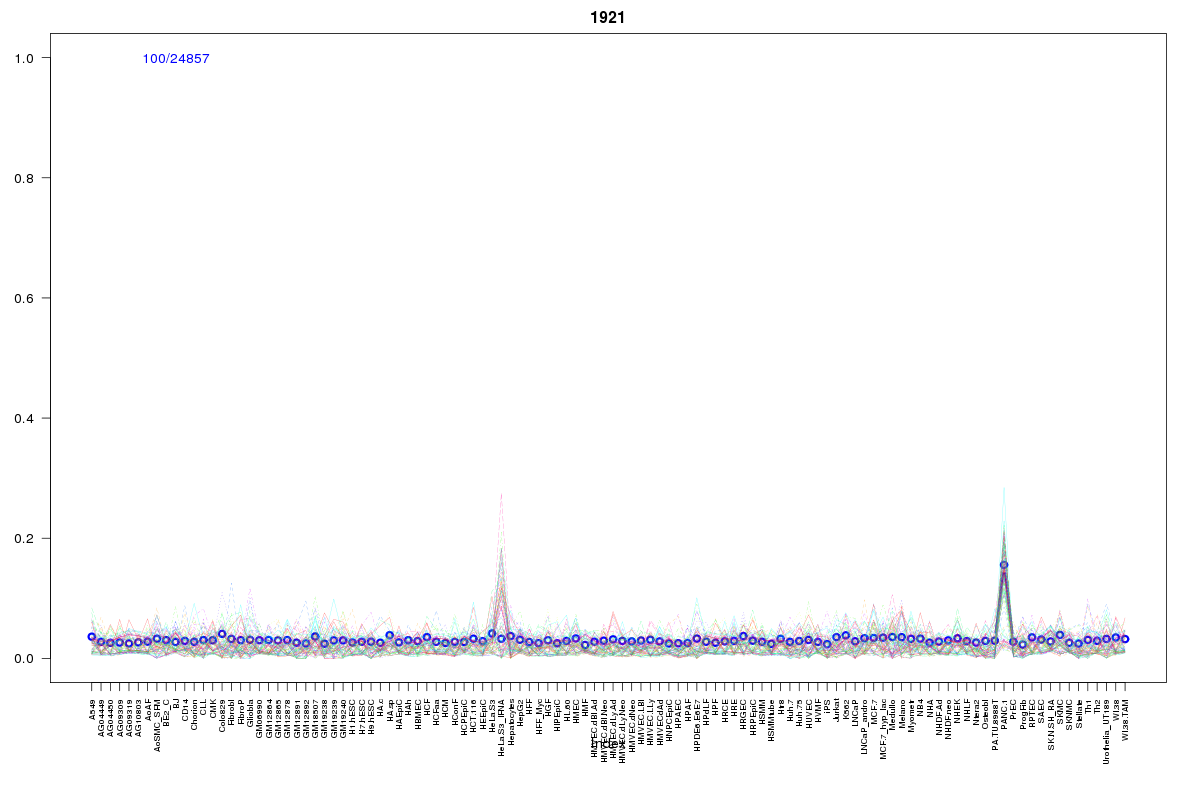 | 1921 | 2 |
 | 2186 | 1 |
 | 1890 | 1 |
 | 2072 | 1 |
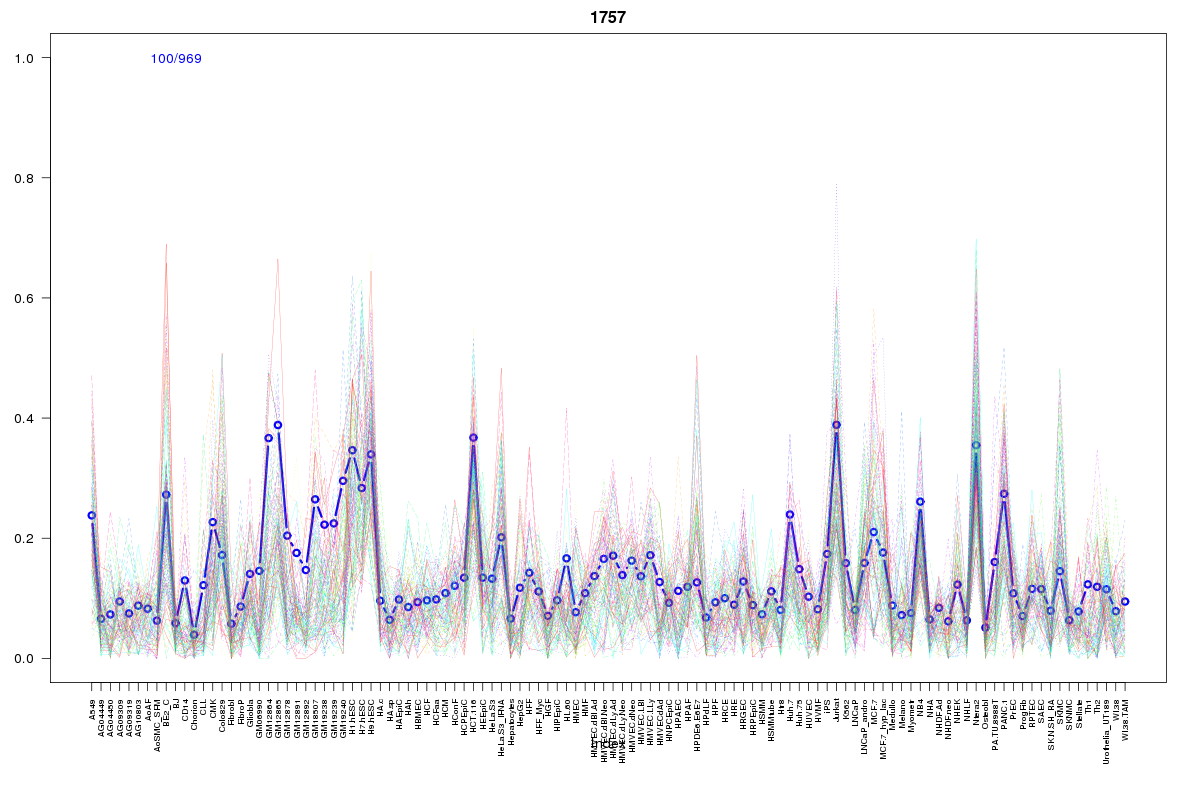 | 1757 | 1 |
 | 1820 | 1 |
Resources
BED file downloads
Connects to 11 DHS sitesTop 10 Correlated DHS Sites
p-values indiciate significant higher or lower correlation| Location | Cluster | P-value |
|---|---|---|
| chr4:175516820-175516970 | 1605 | 0.004 |
| chr4:175803560-175803710 | 1921 | 0.005 |
| chr4:175797000-175797150 | 1820 | 0.005 |
| chr4:175635820-175635970 | 1921 | 0.005 |
| chr4:175500480-175500630 | 2186 | 0.005 |
| chr4:175628580-175628730 | 2072 | 0.012 |
| chr4:175500740-175500890 | 1890 | 0.012 |
| chr4:175472620-175472770 | 2136 | 0.015 |
| chr4:175795220-175795370 | 1757 | 0.017 |
| chr4:175689220-175689370 | 1605 | 0.022 |
| chr4:175792060-175792210 | 2136 | 0.023 |
External Databases
UCSCEnsembl (ENSG00000145451)