Gene: ITGB1
chr10: 33189246-33224486Expression Profile
(log scale)
Graphical Connections
Distribution of linked clusters:
You may find it interesting if many of the connected DHS sites belong to the same cluster.| Cluster Profile | Cluster ID | Number of DHS sites in this cluster |
|---|---|---|
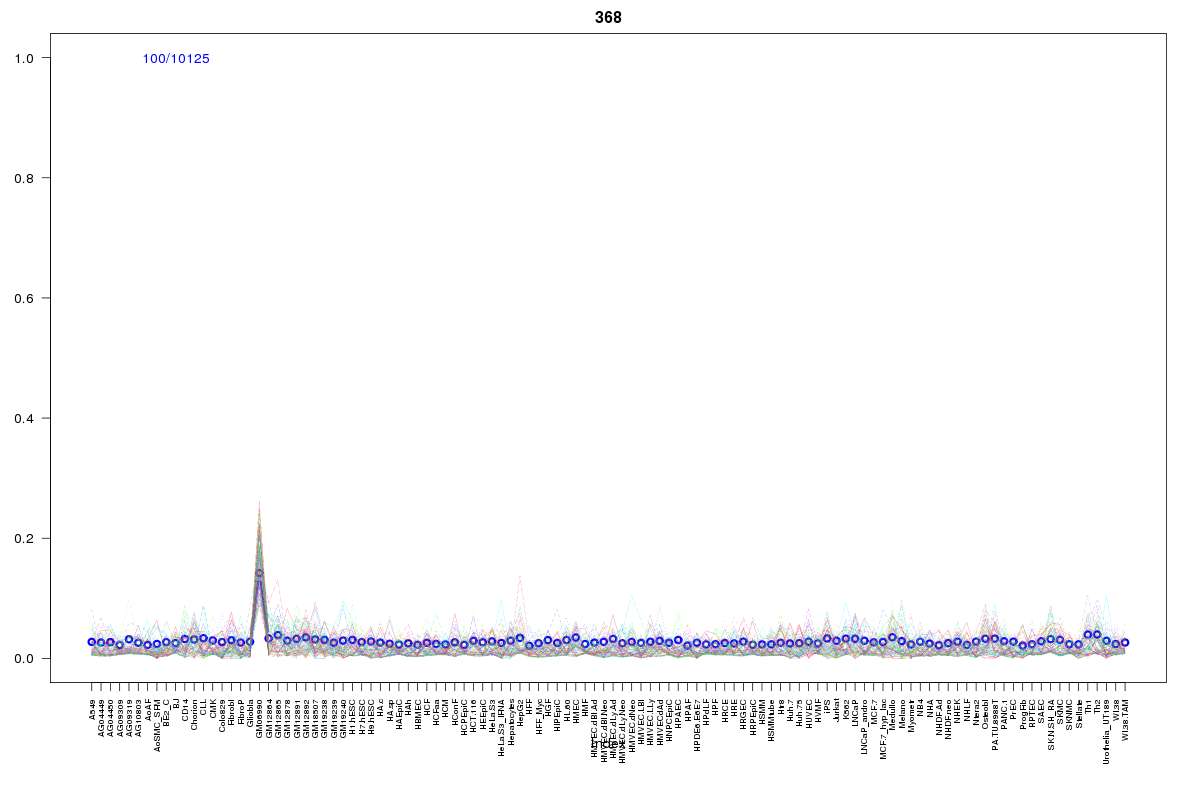 | 368 | 2 |
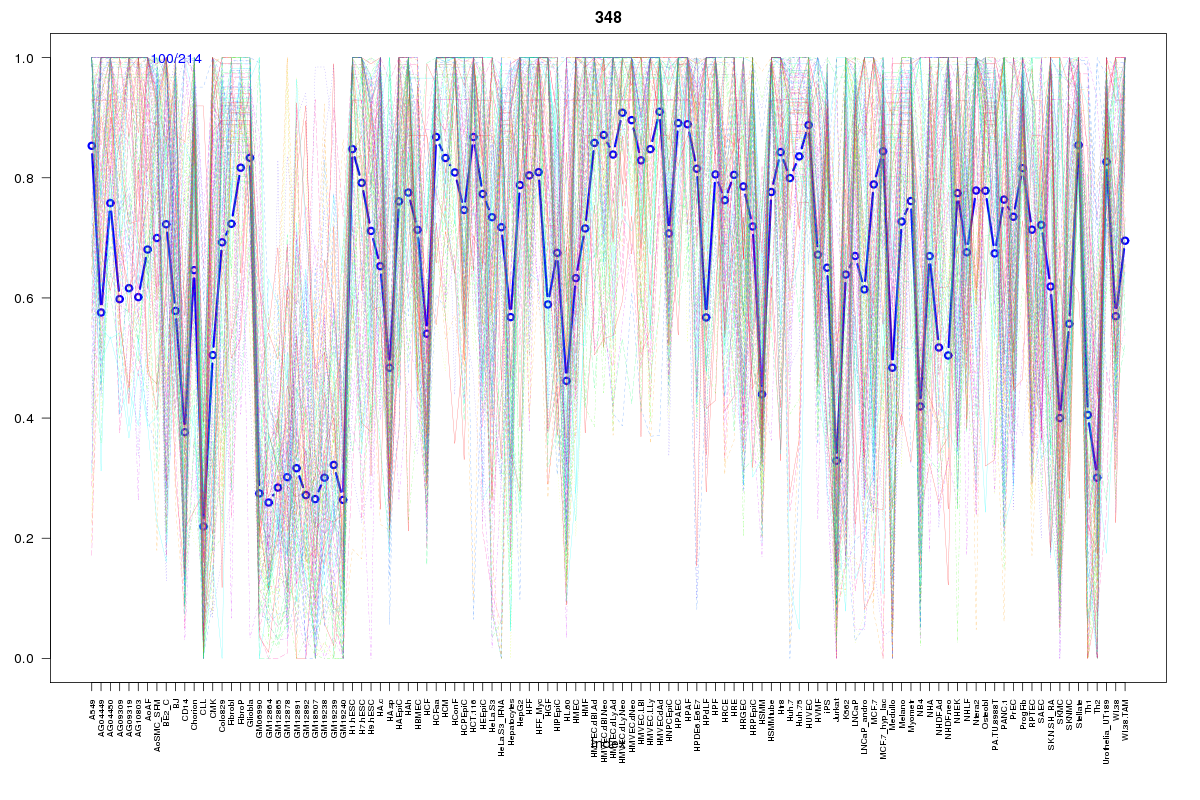 | 348 | 1 |
 | 396 | 1 |
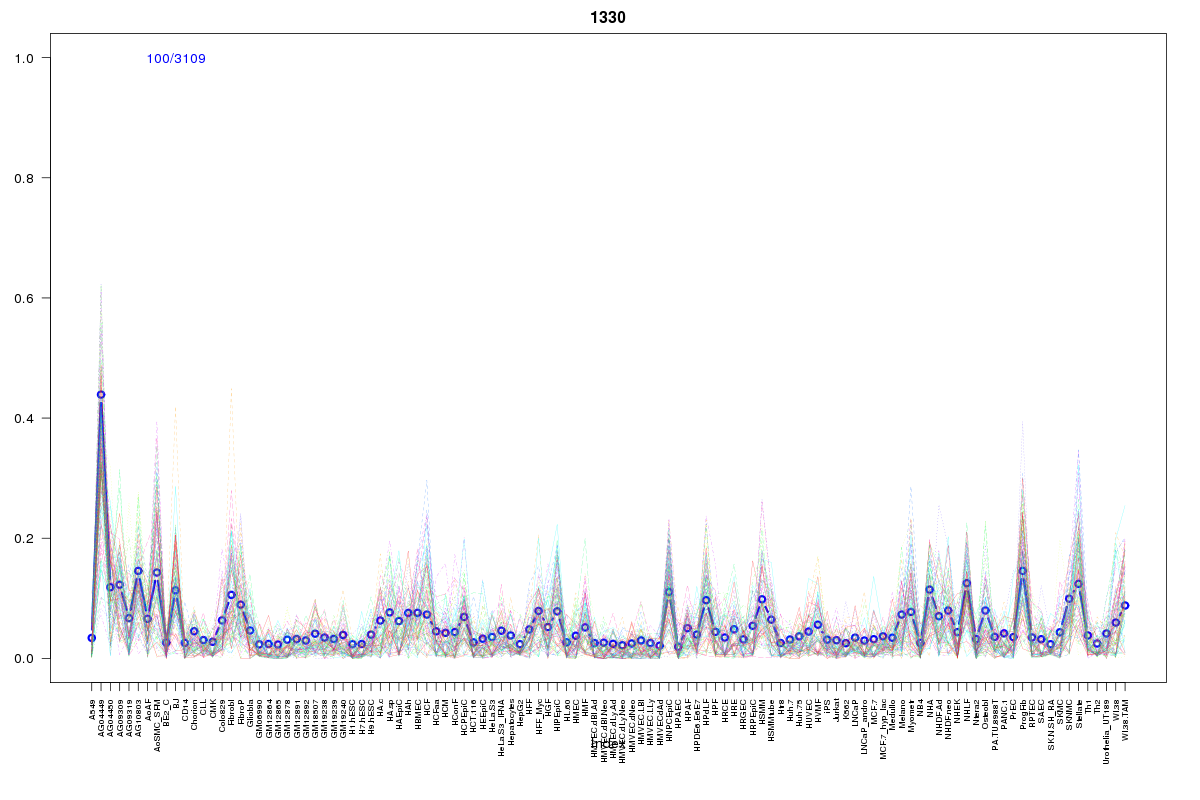 | 1330 | 1 |
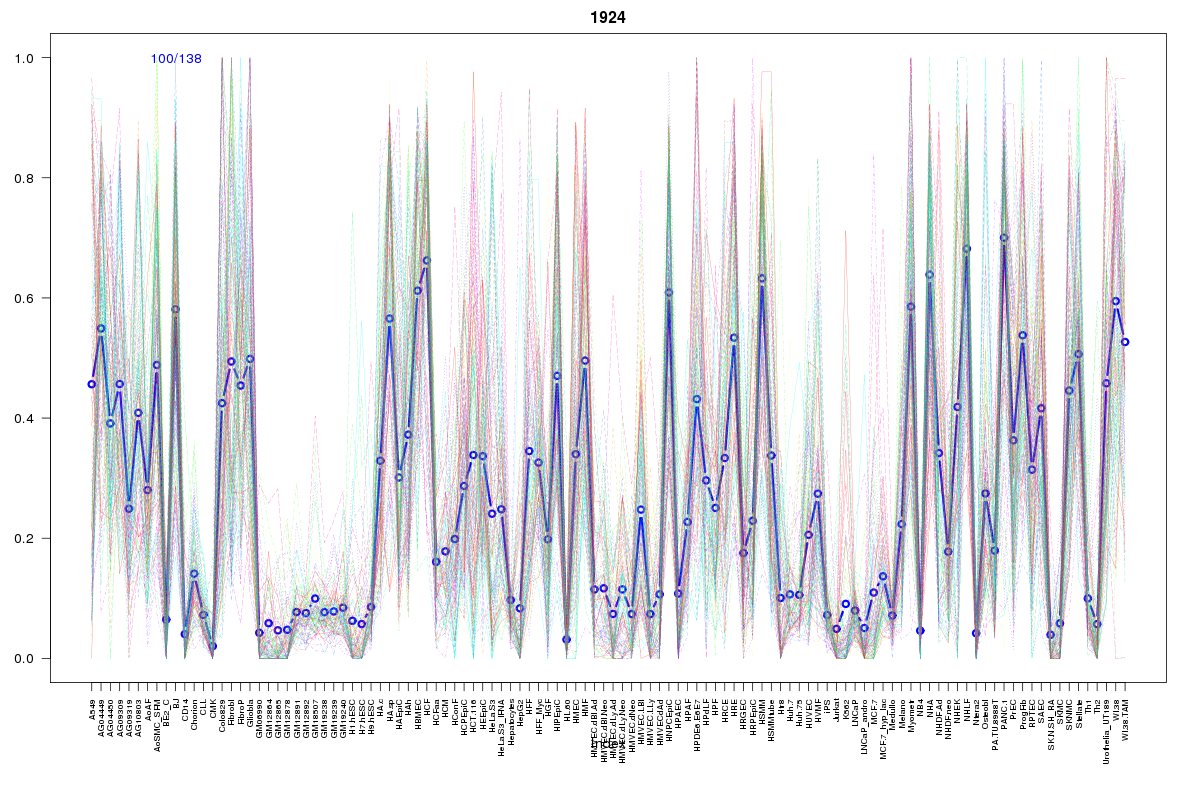 | 1924 | 1 |
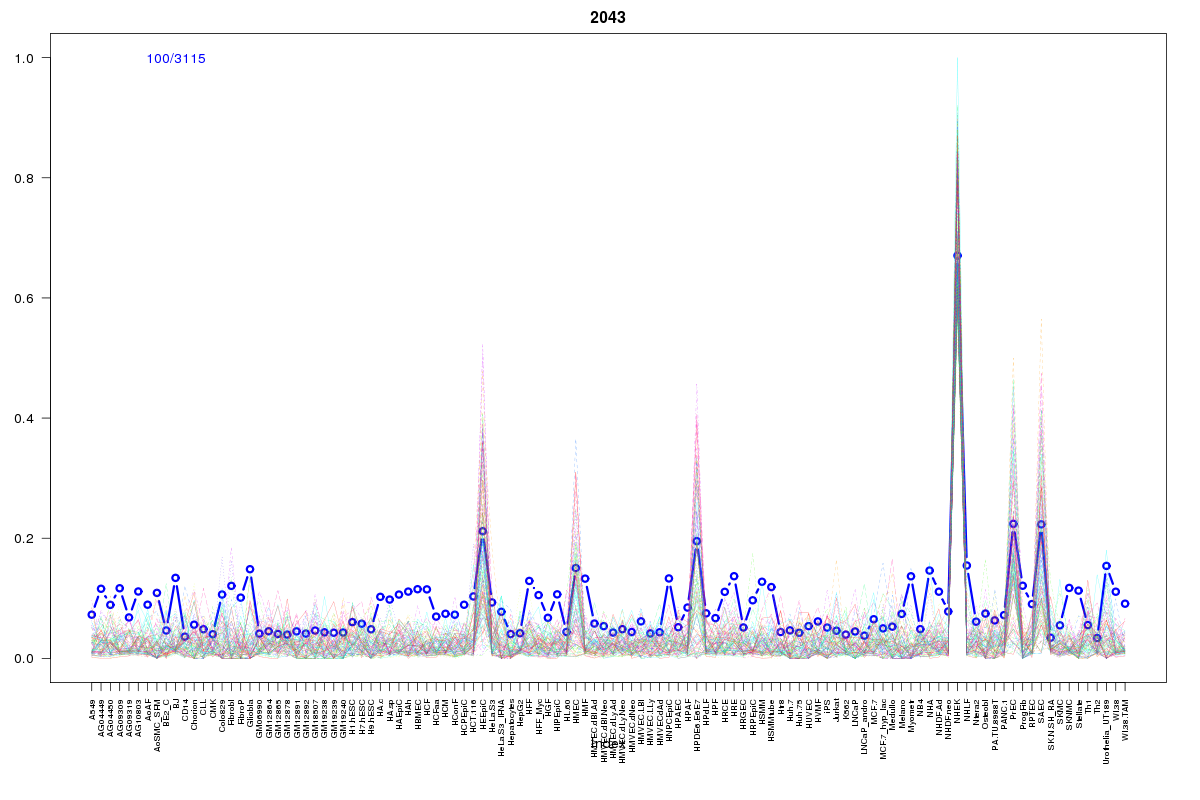 | 2043 | 1 |
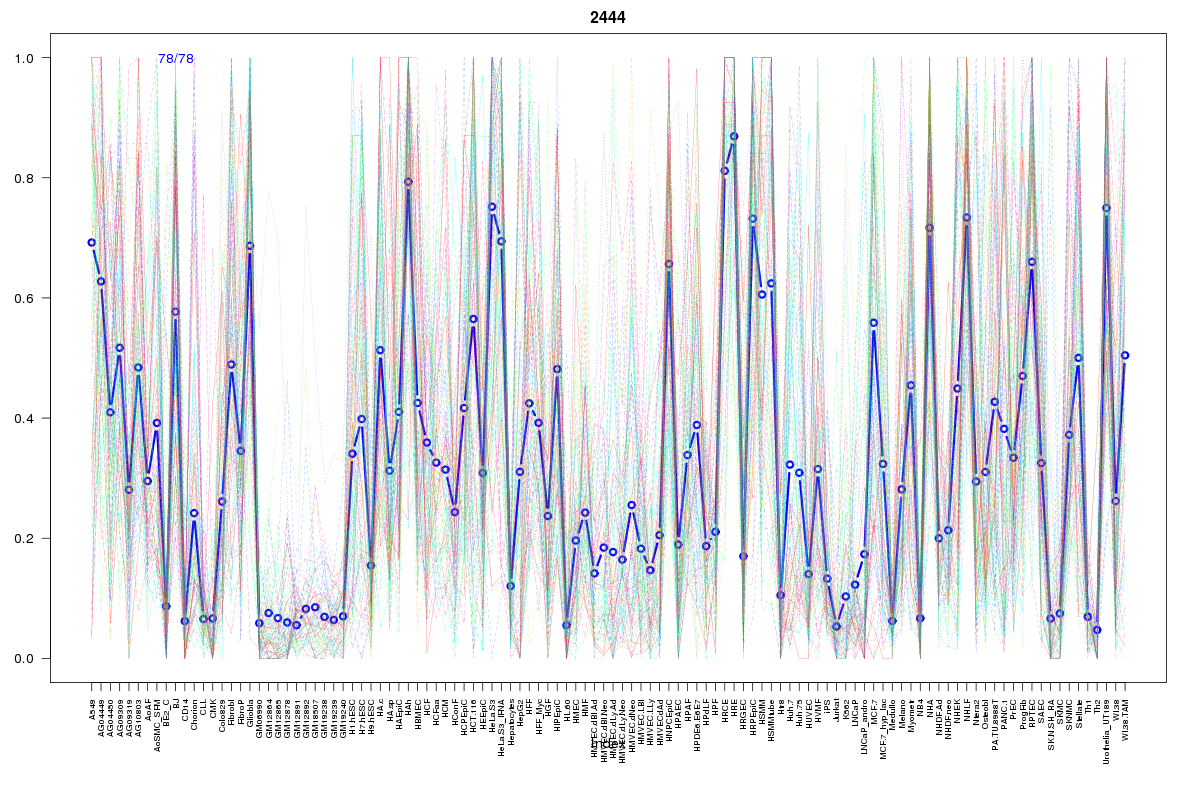 | 2444 | 1 |
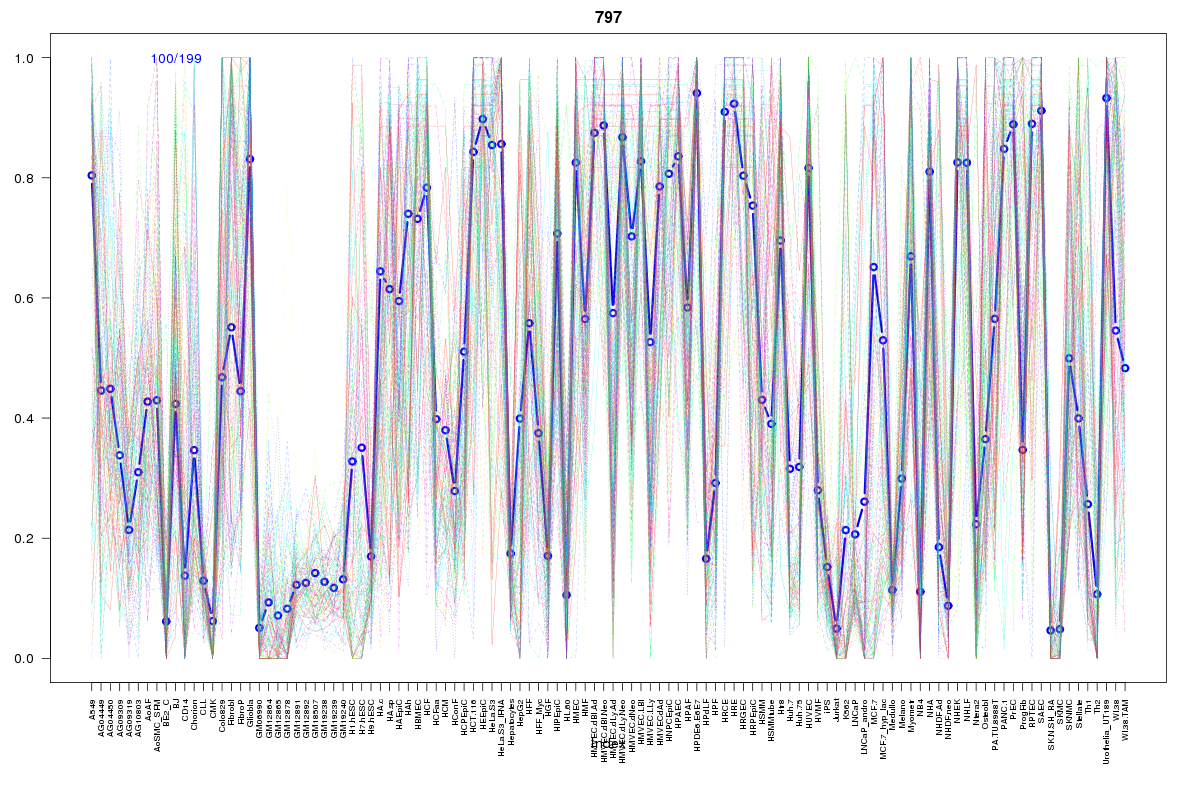 | 797 | 1 |
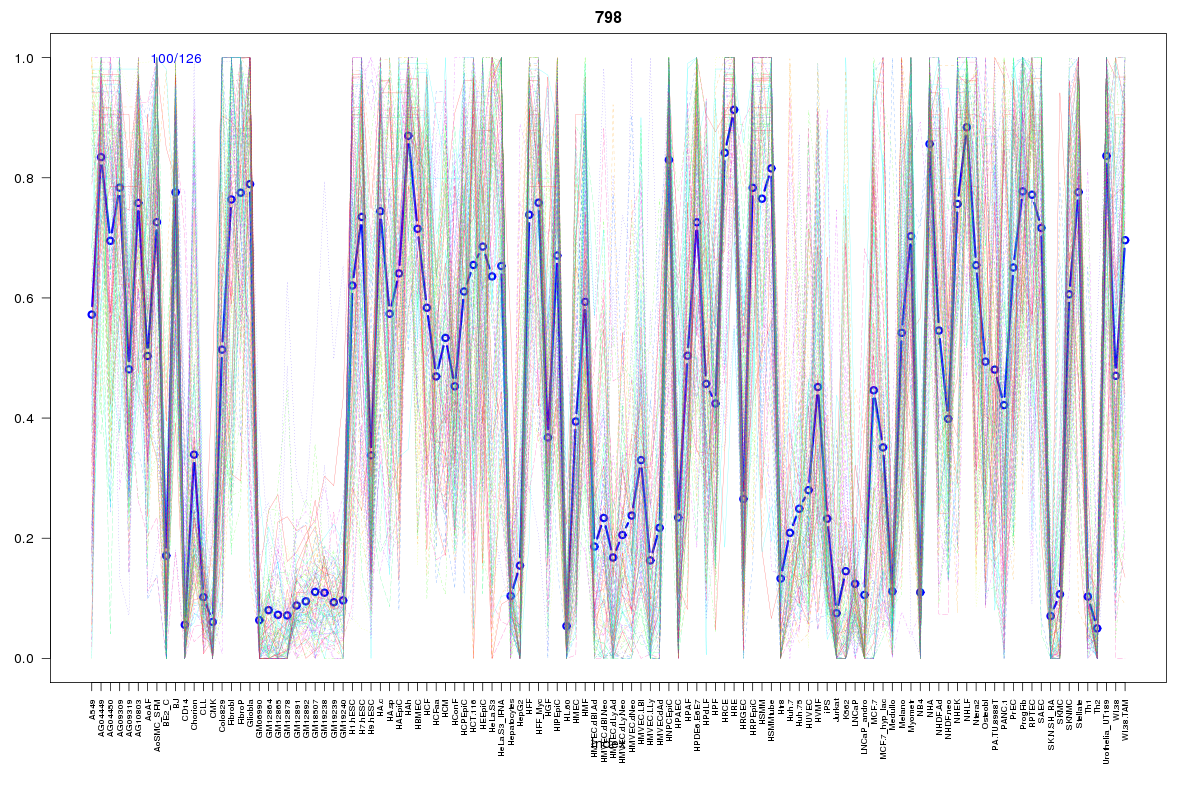 | 798 | 1 |
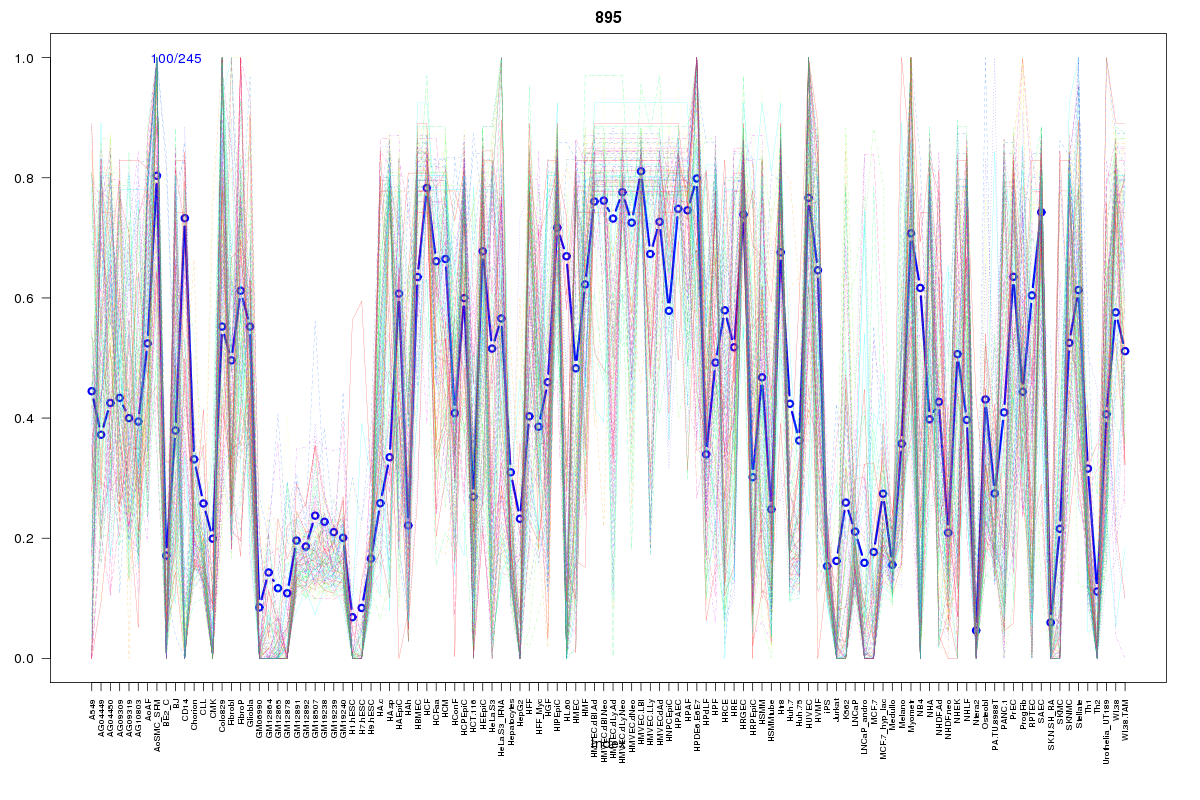 | 895 | 1 |
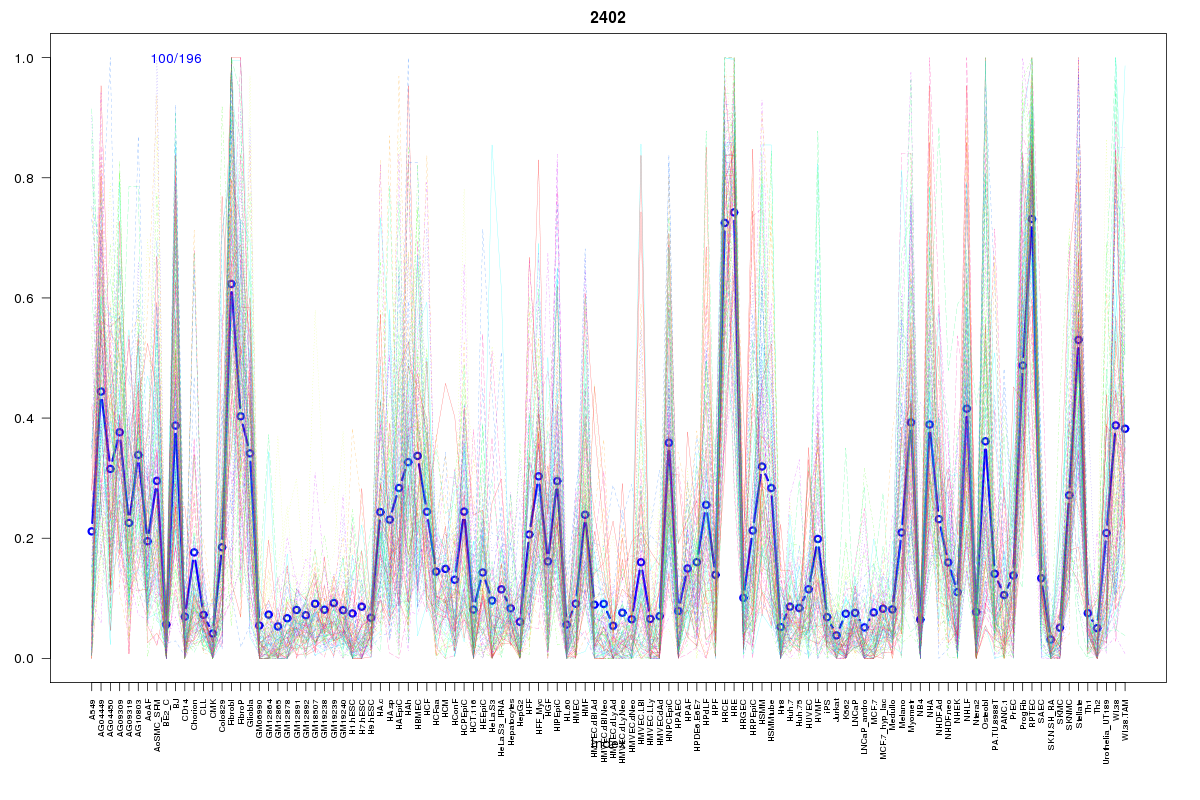 | 2402 | 1 |
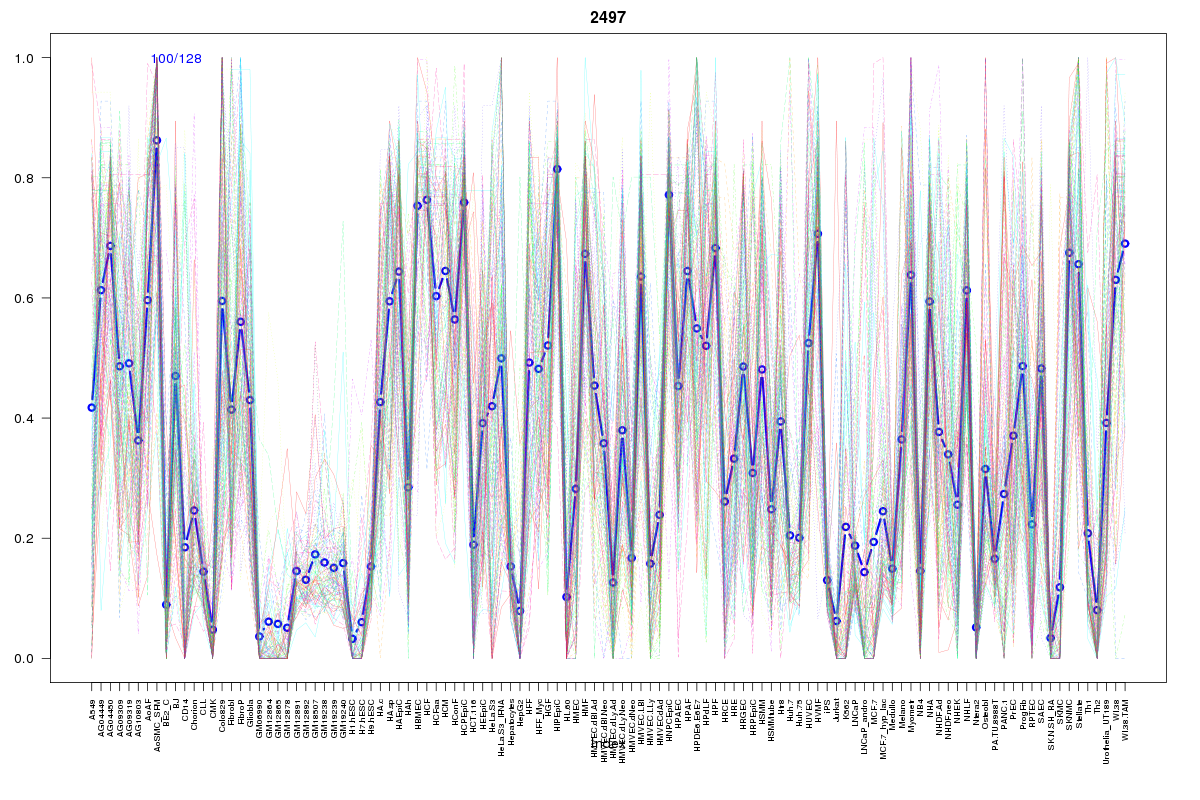 | 2497 | 1 |
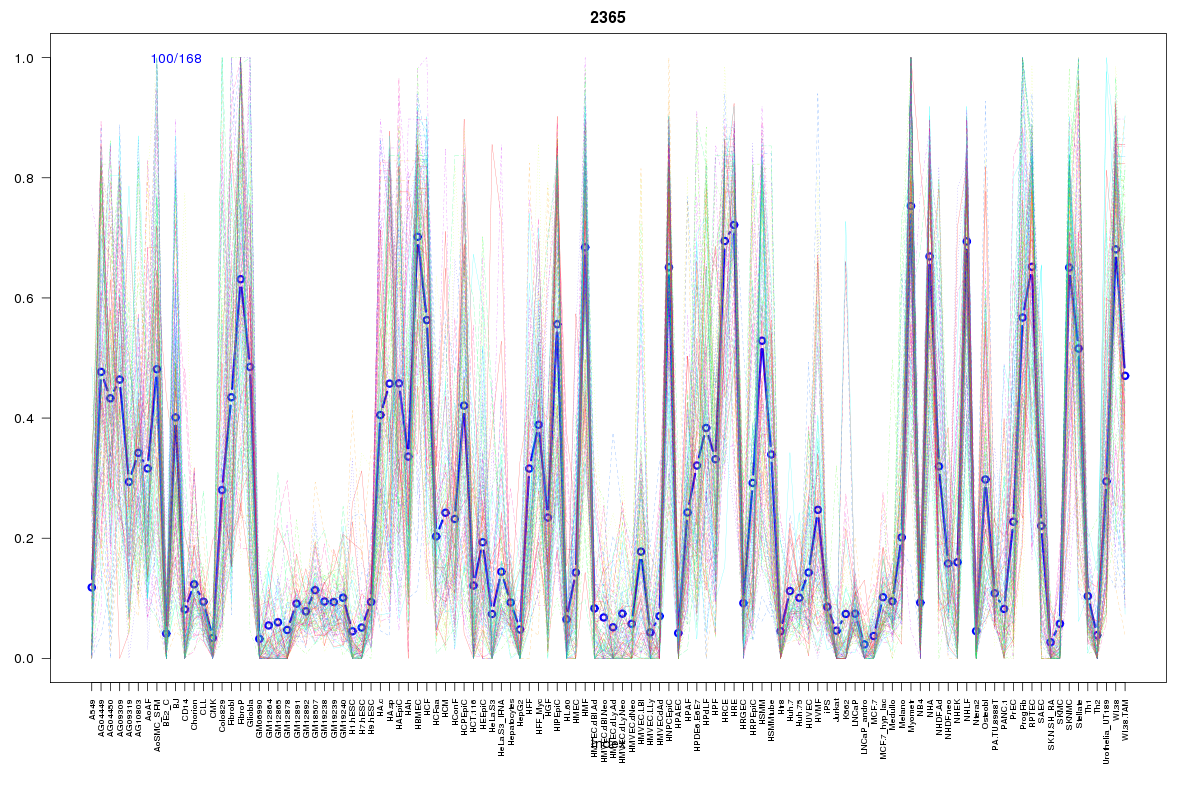 | 2365 | 1 |
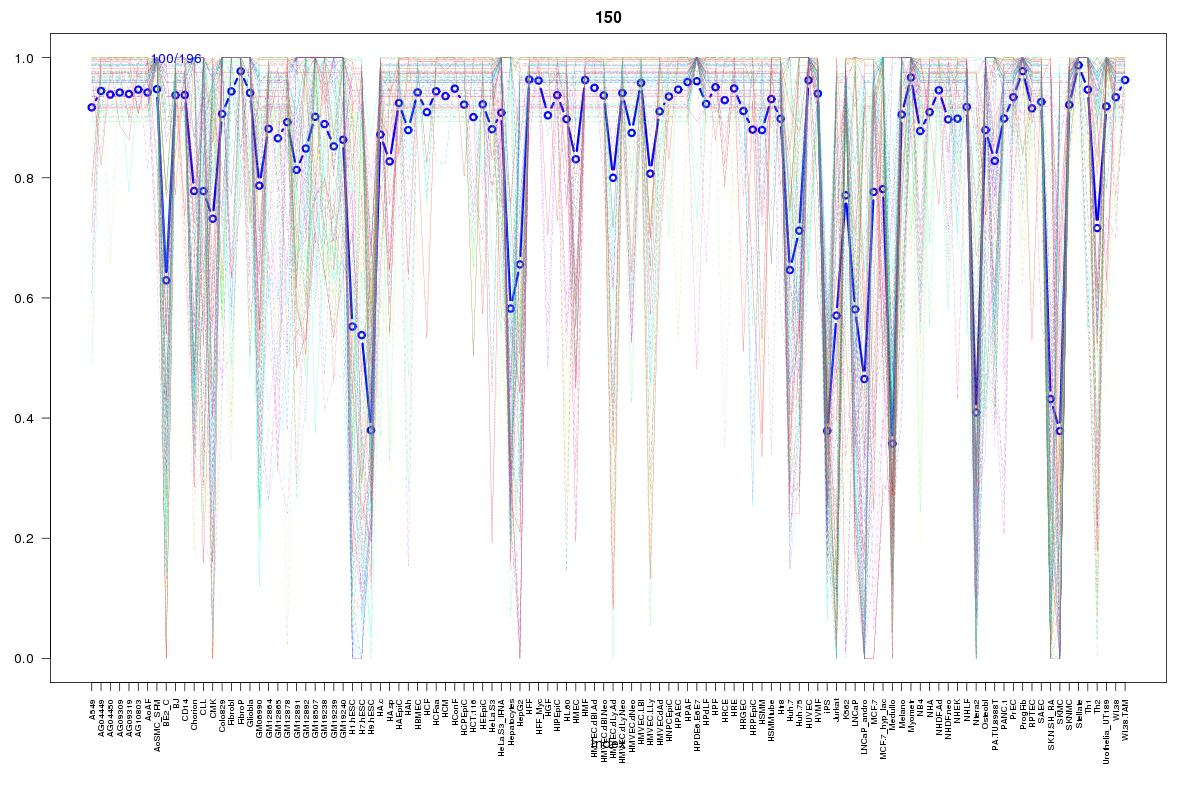 | 150 | 1 |
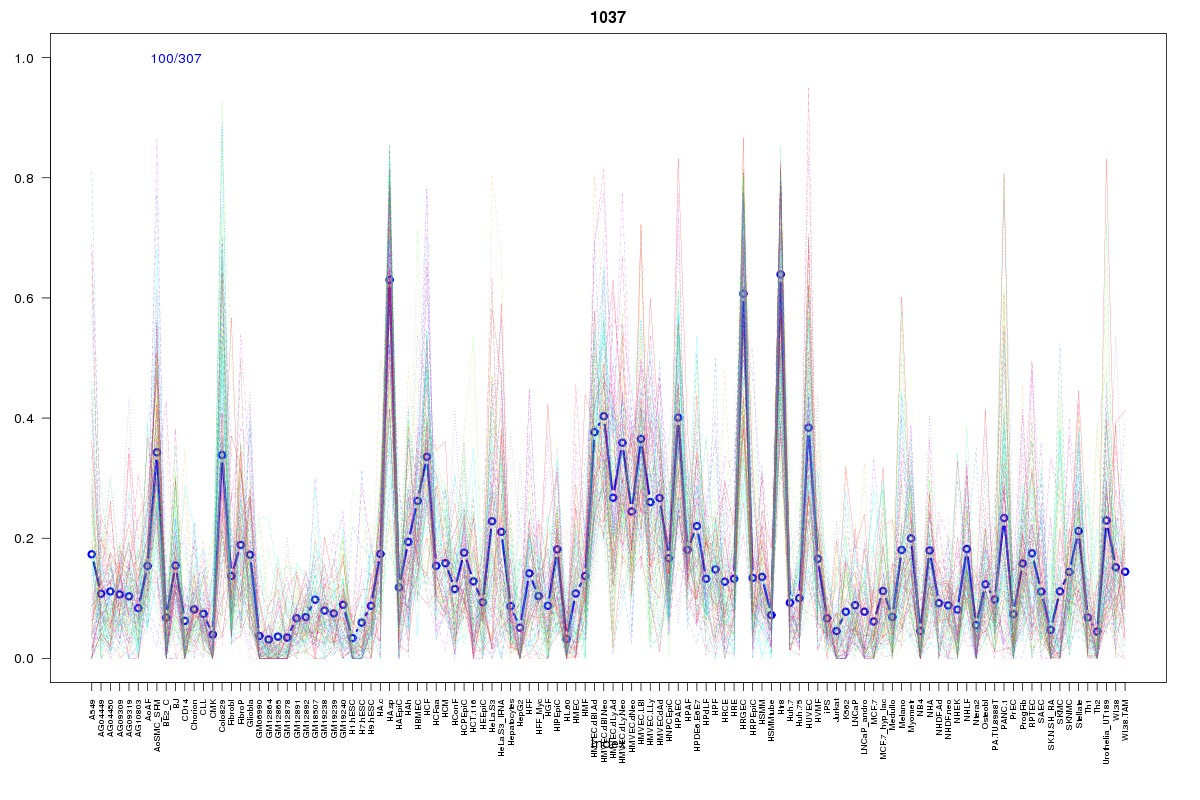 | 1037 | 1 |
 | 445 | 1 |
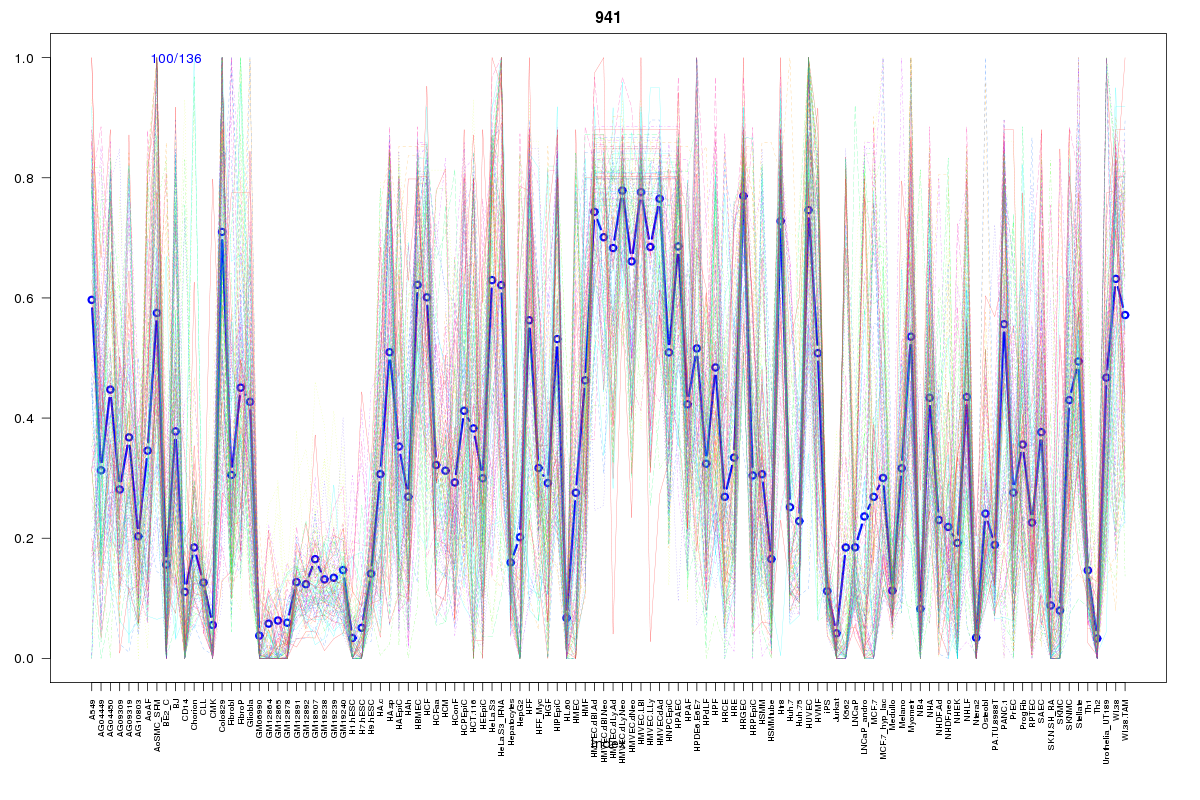 | 941 | 1 |
 | 2227 | 1 |
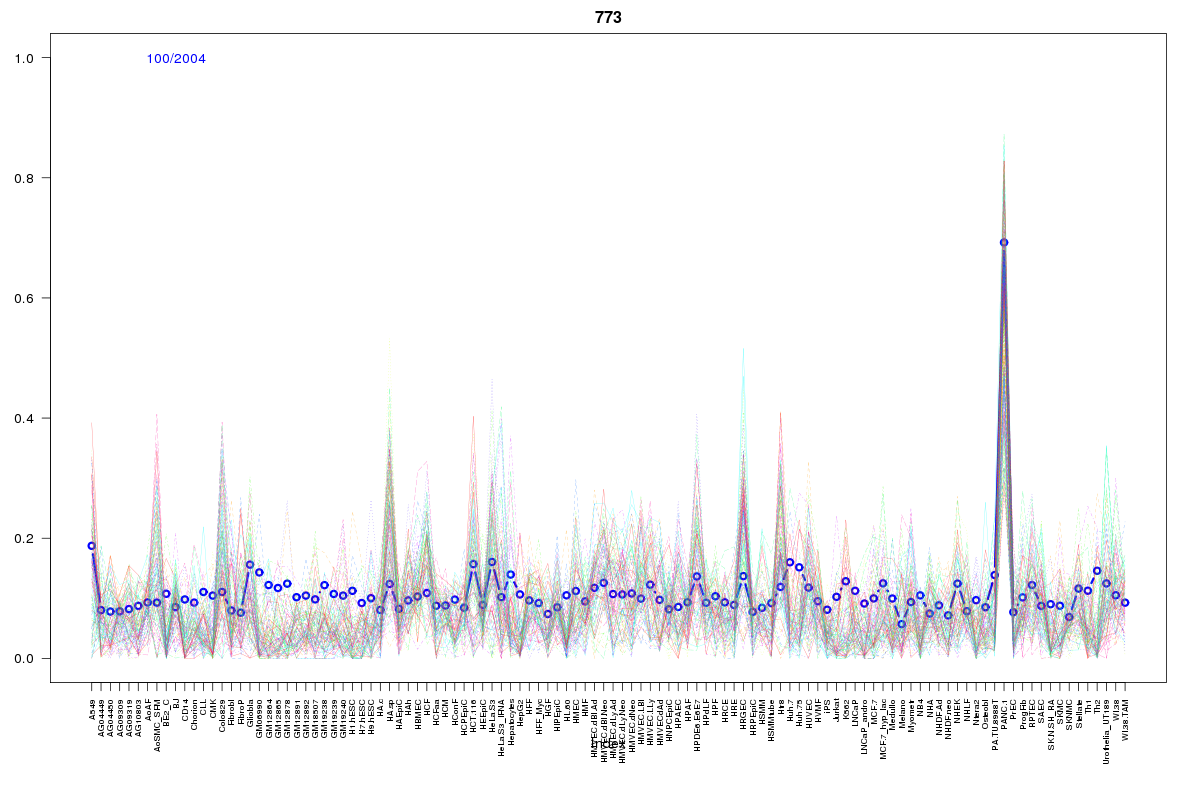 | 773 | 1 |
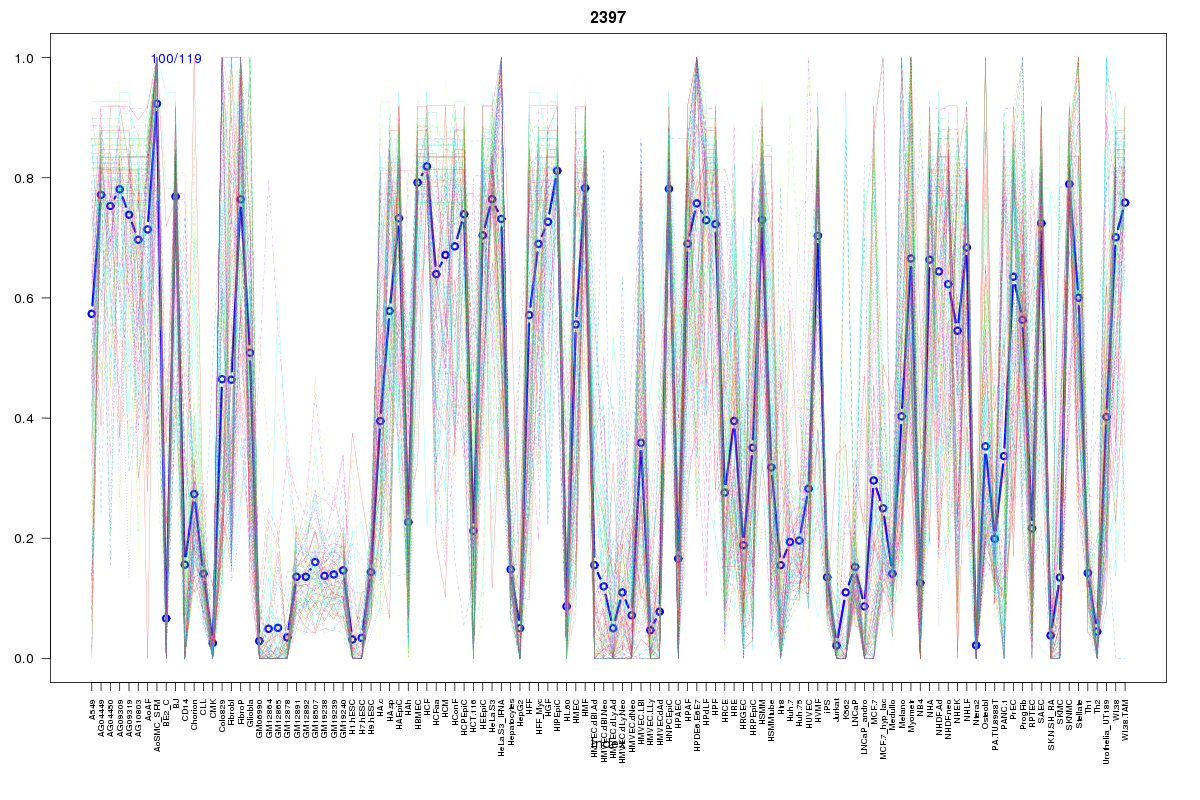 | 2397 | 1 |
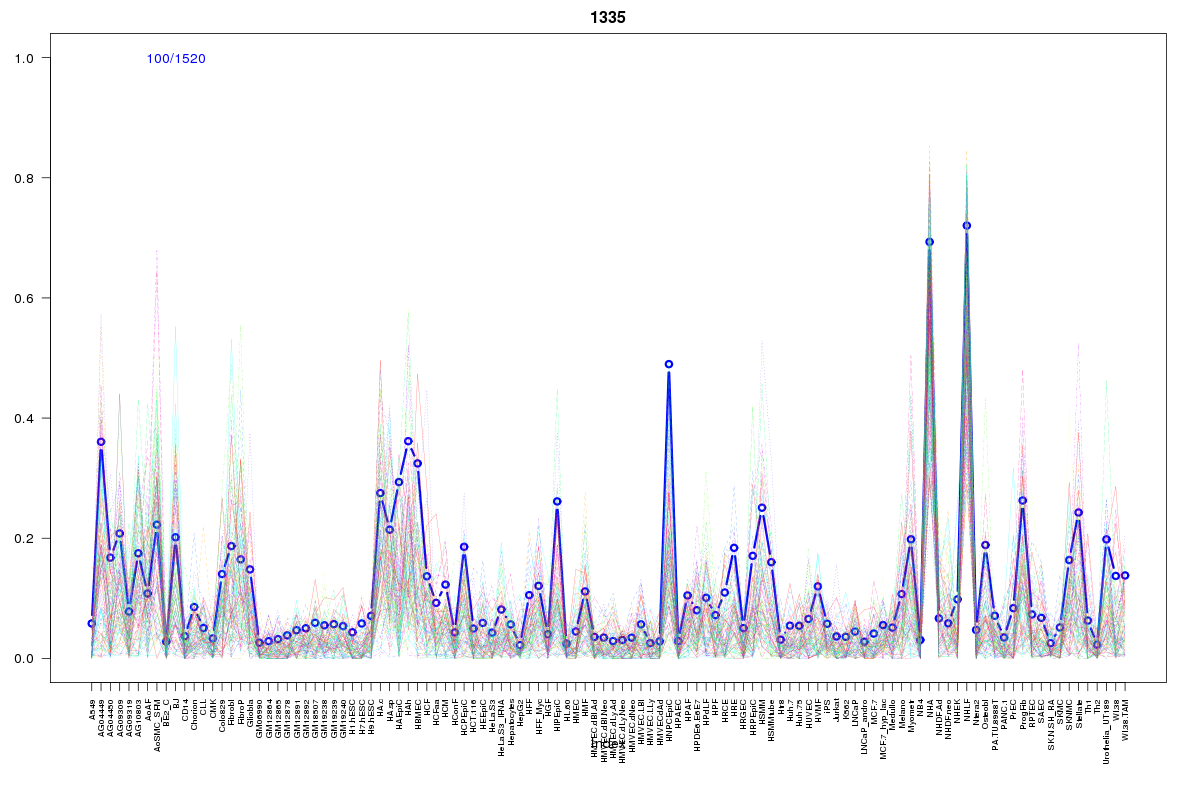 | 1335 | 1 |
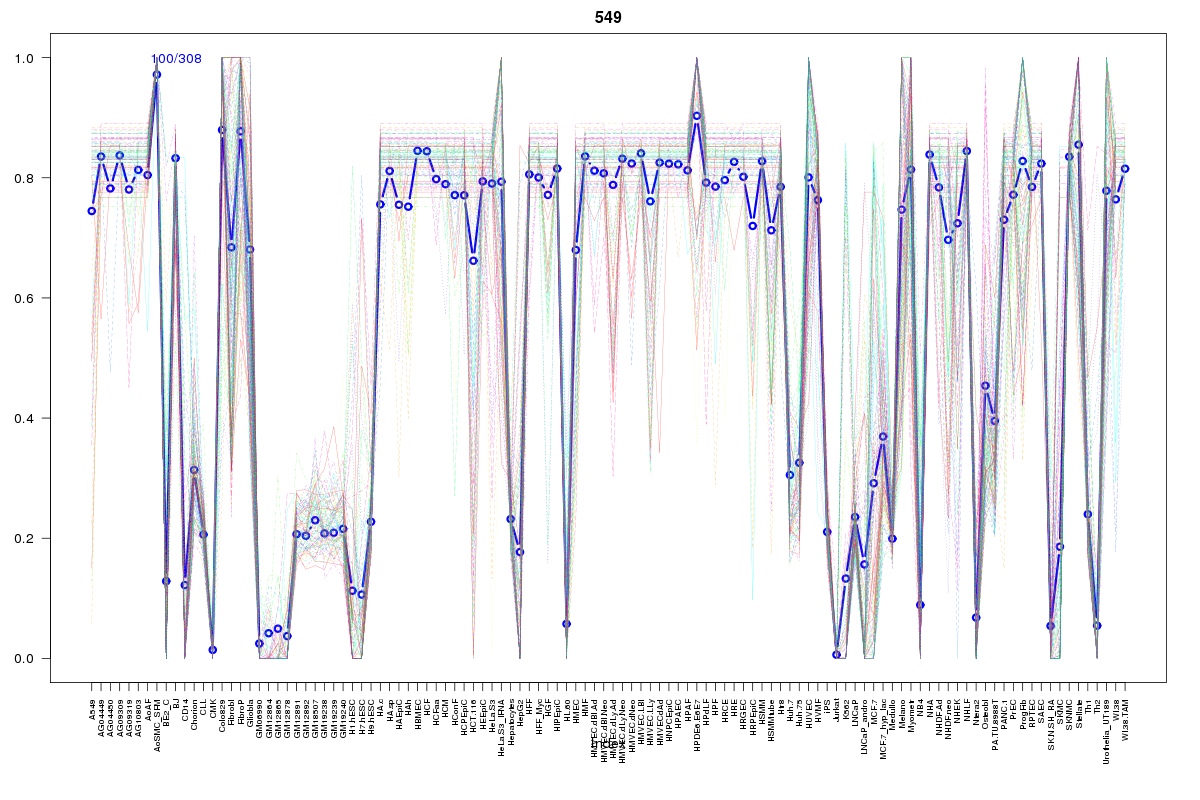 | 549 | 1 |
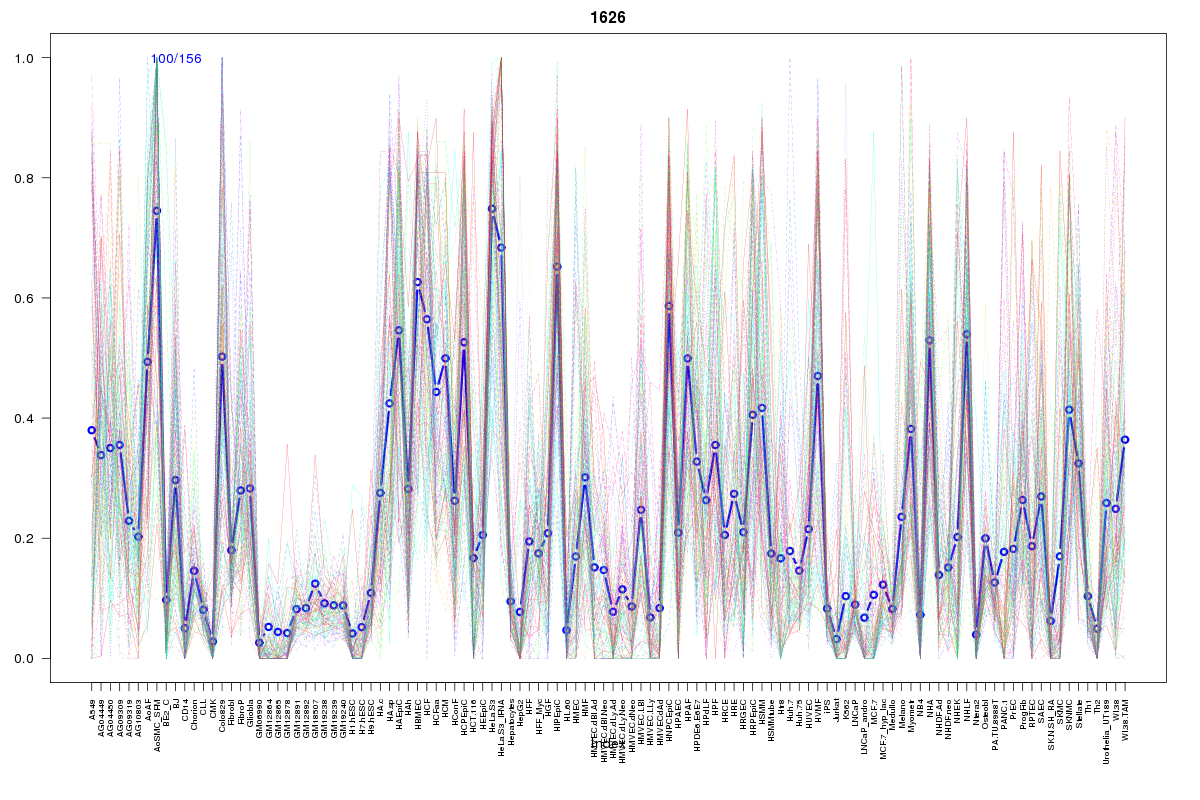 | 1626 | 1 |
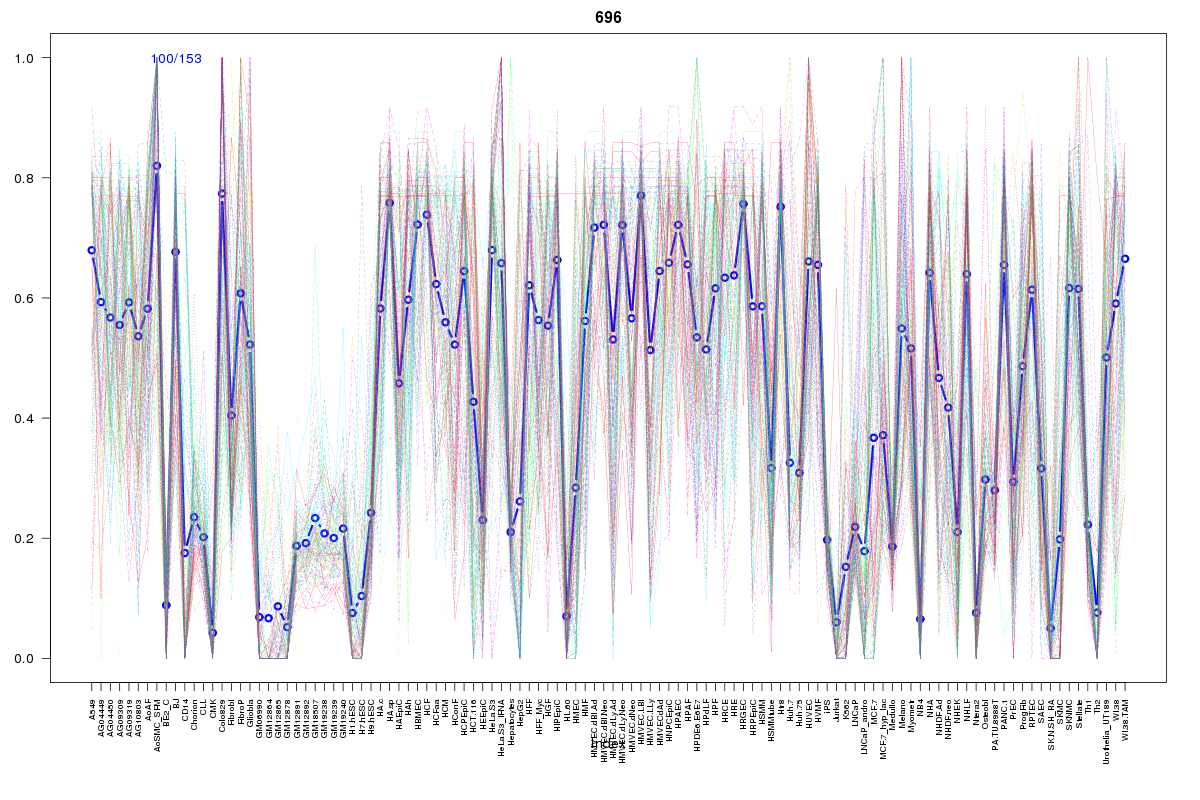 | 696 | 1 |
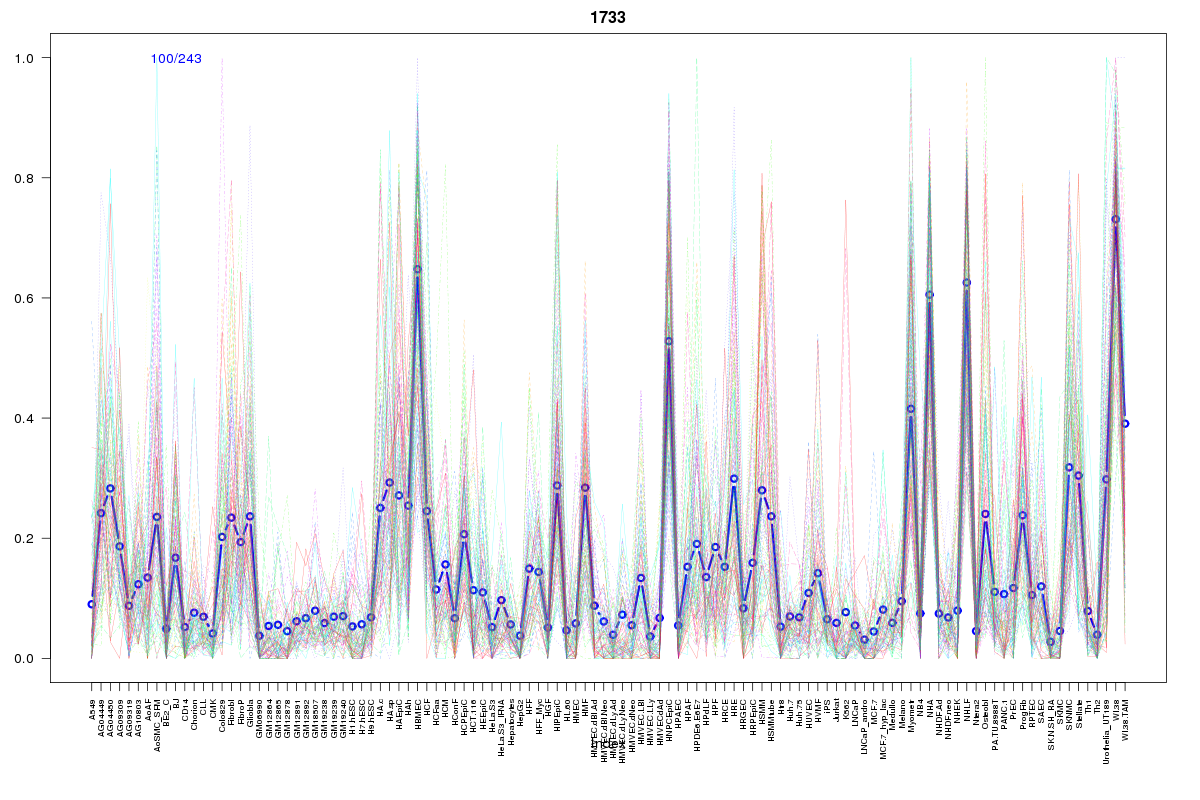 | 1733 | 1 |
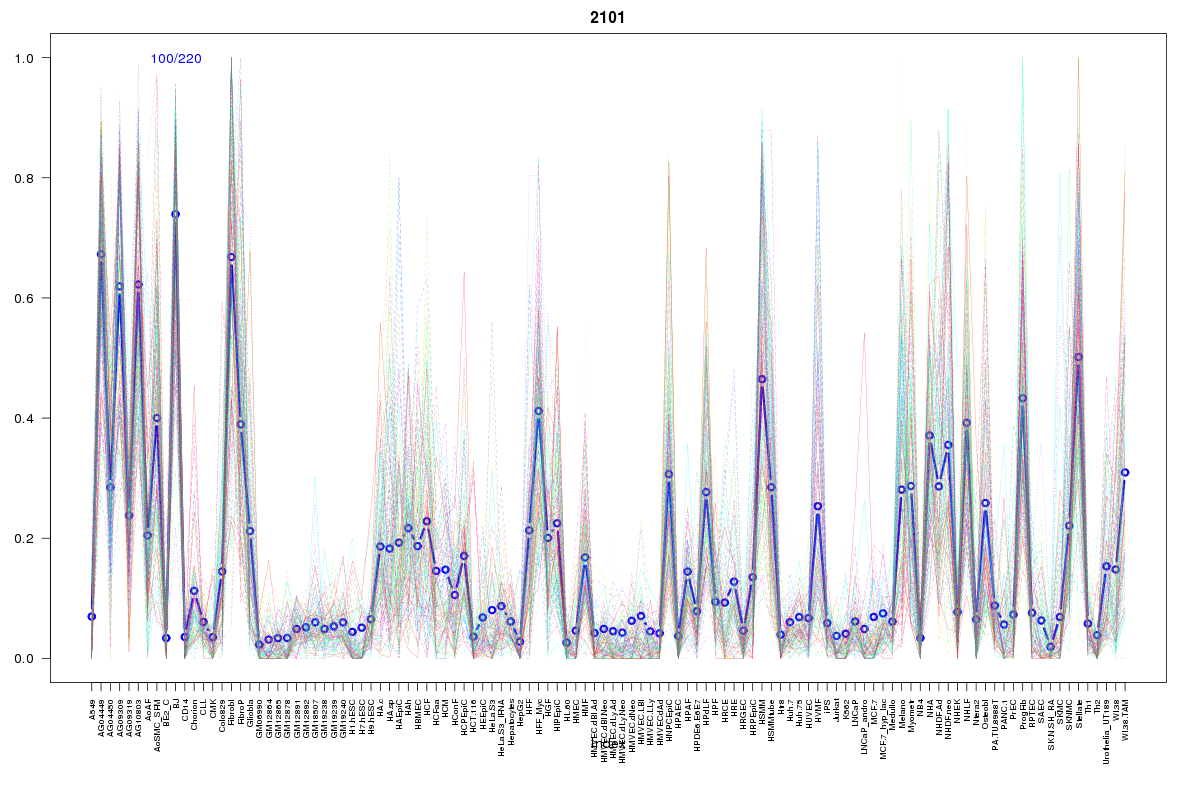 | 2101 | 1 |
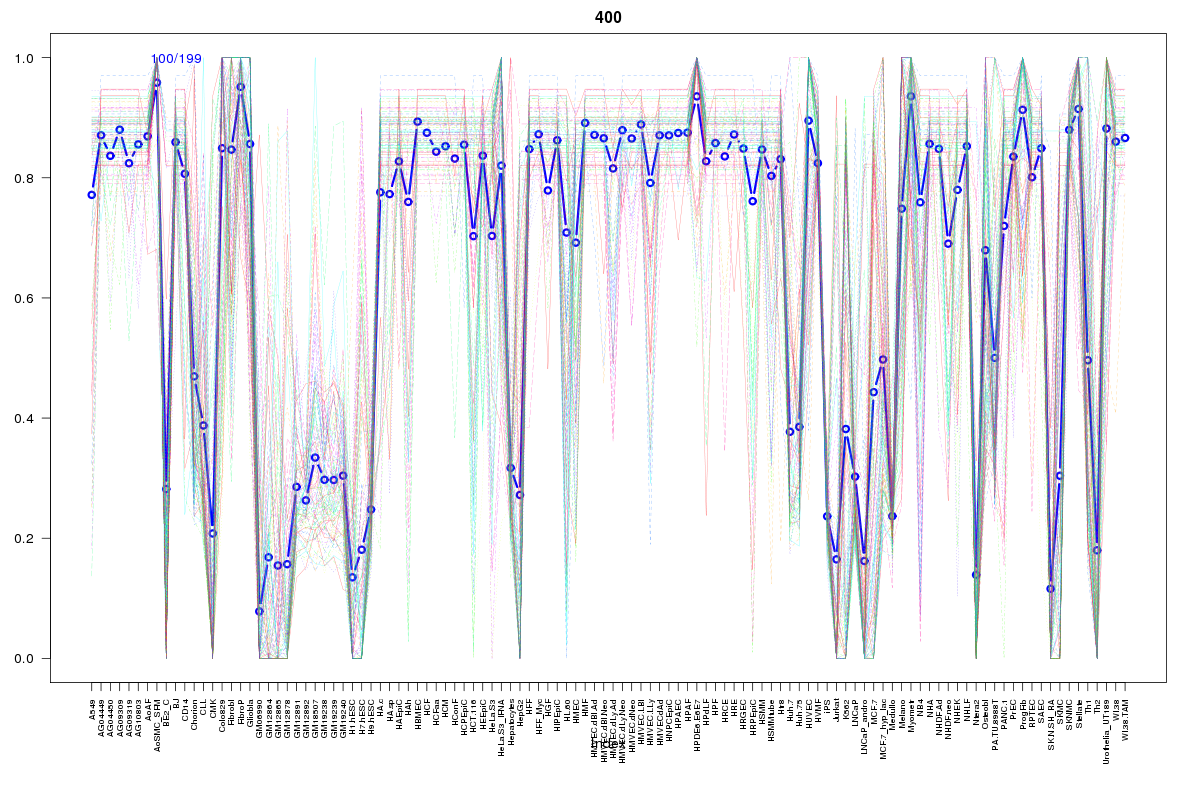 | 400 | 1 |
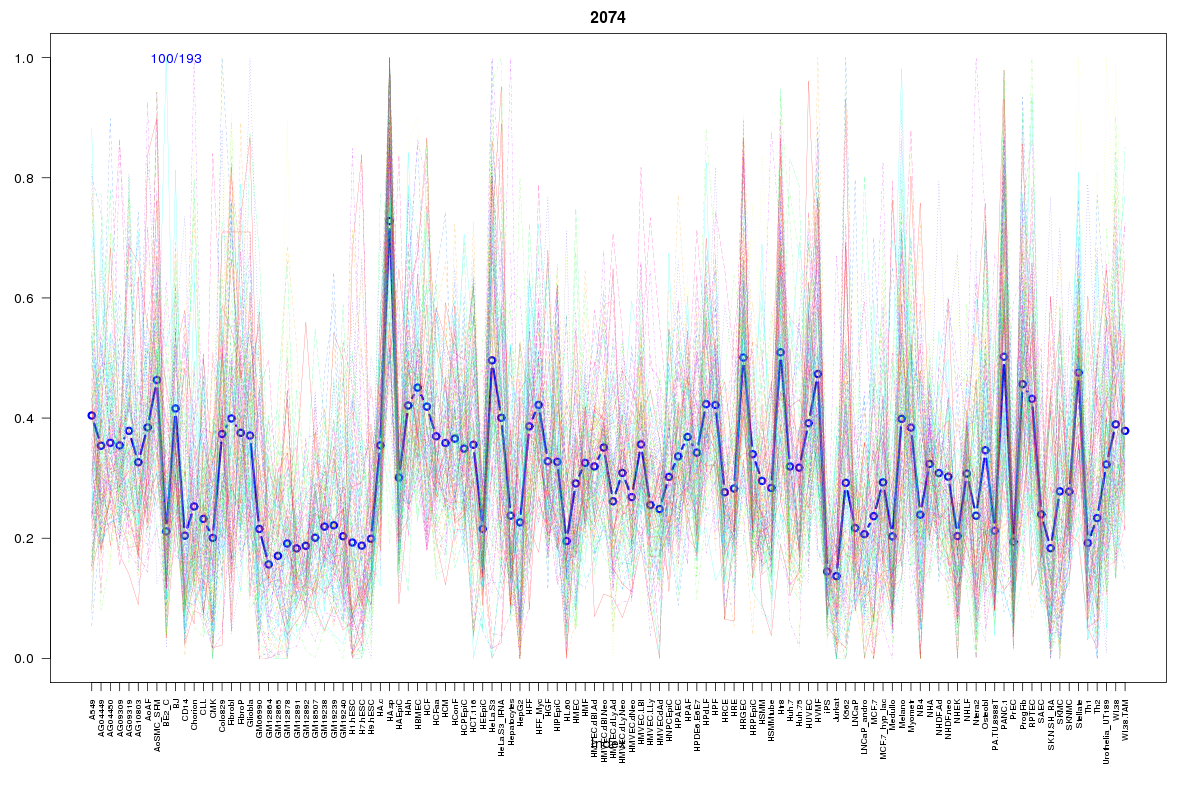 | 2074 | 1 |
Resources
BED file downloads
Connects to 29 DHS sitesTop 10 Correlated DHS Sites
p-values indiciate significant higher or lower correlation| Location | Cluster | P-value |
|---|---|---|
| chr10:33272300-33272450 | 549 | 0 |
| chr10:33294700-33294850 | 348 | 0.001 |
| chr10:33294300-33294450 | 400 | 0.001 |
| chr10:33251080-33251230 | 895 | 0.001 |
| chr10:33271400-33271550 | 2397 | 0.001 |
| chr10:33252160-33252310 | 2497 | 0.002 |
| chr10:33250920-33251070 | 797 | 0.003 |
| chr10:33299500-33299650 | 798 | 0.004 |
| chr10:33274740-33274890 | 696 | 0.005 |
| chr10:33299340-33299490 | 2444 | 0.006 |
| chr10:33269760-33269910 | 445 | 0.007 |
External Databases
UCSCEnsembl (ENSG00000150093)