Gene: TMCO3
chr13: 114145309-114204510Expression Profile
(log scale)
Graphical Connections
Distribution of linked clusters:
You may find it interesting if many of the connected DHS sites belong to the same cluster.| Cluster Profile | Cluster ID | Number of DHS sites in this cluster |
|---|---|---|
 | 1604 | 2 |
 | 570 | 1 |
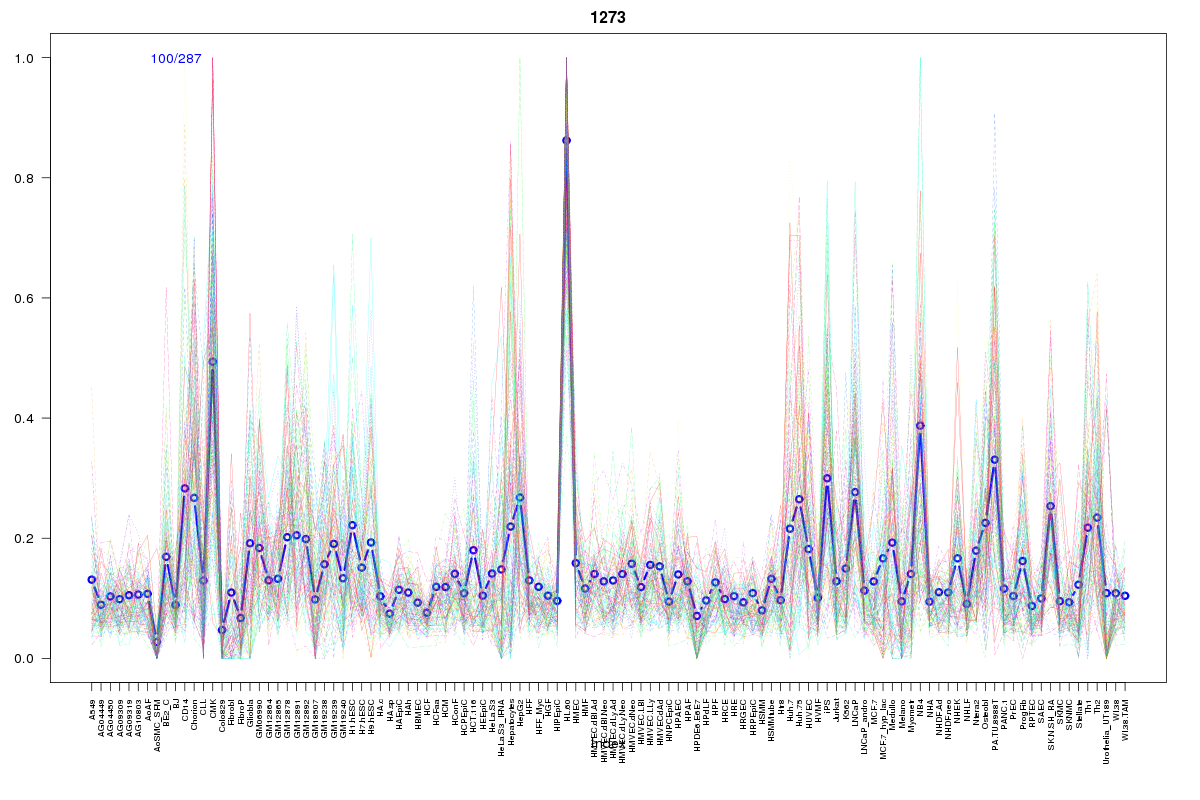 | 1273 | 1 |
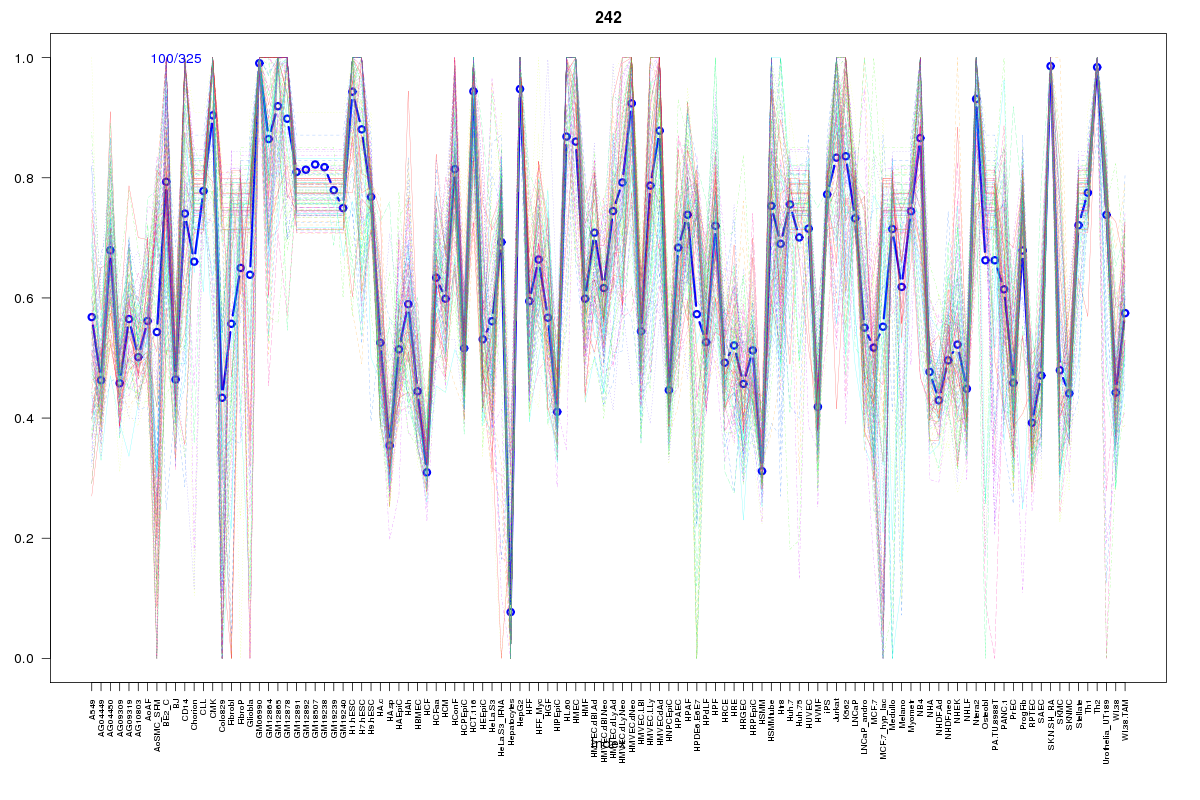 | 242 | 1 |
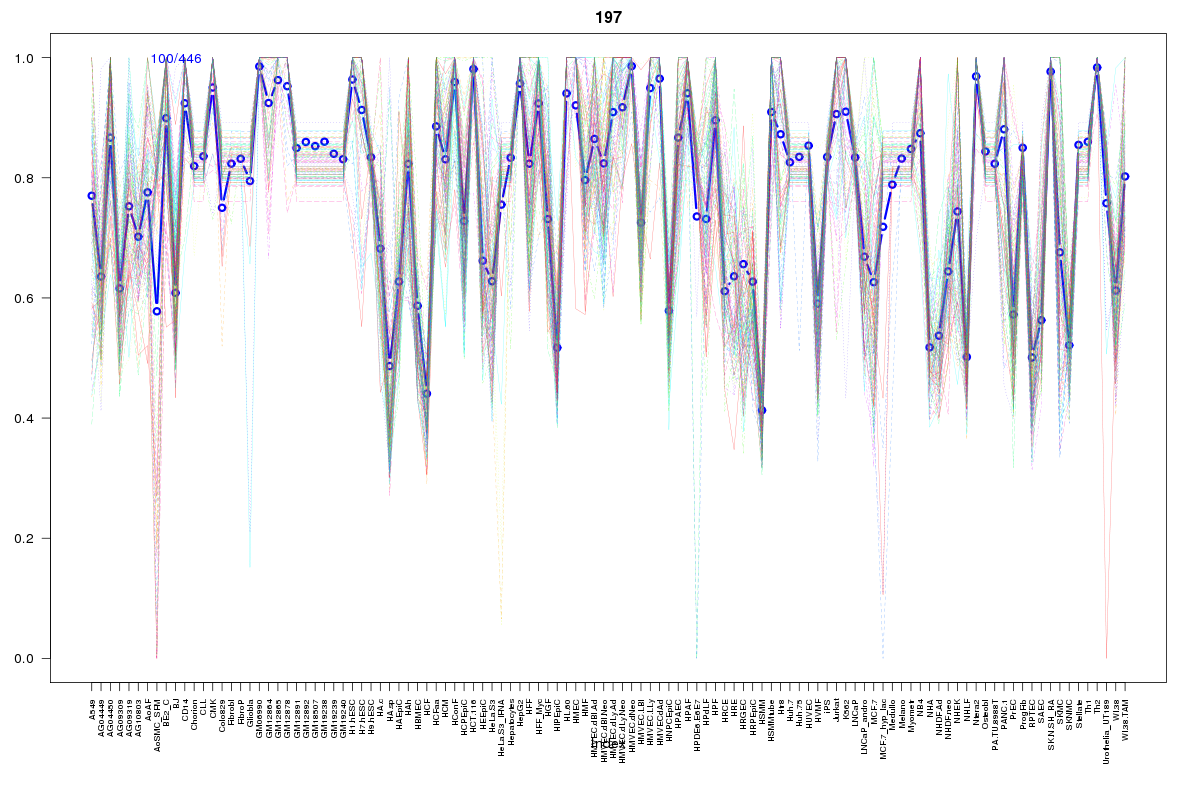 | 197 | 1 |
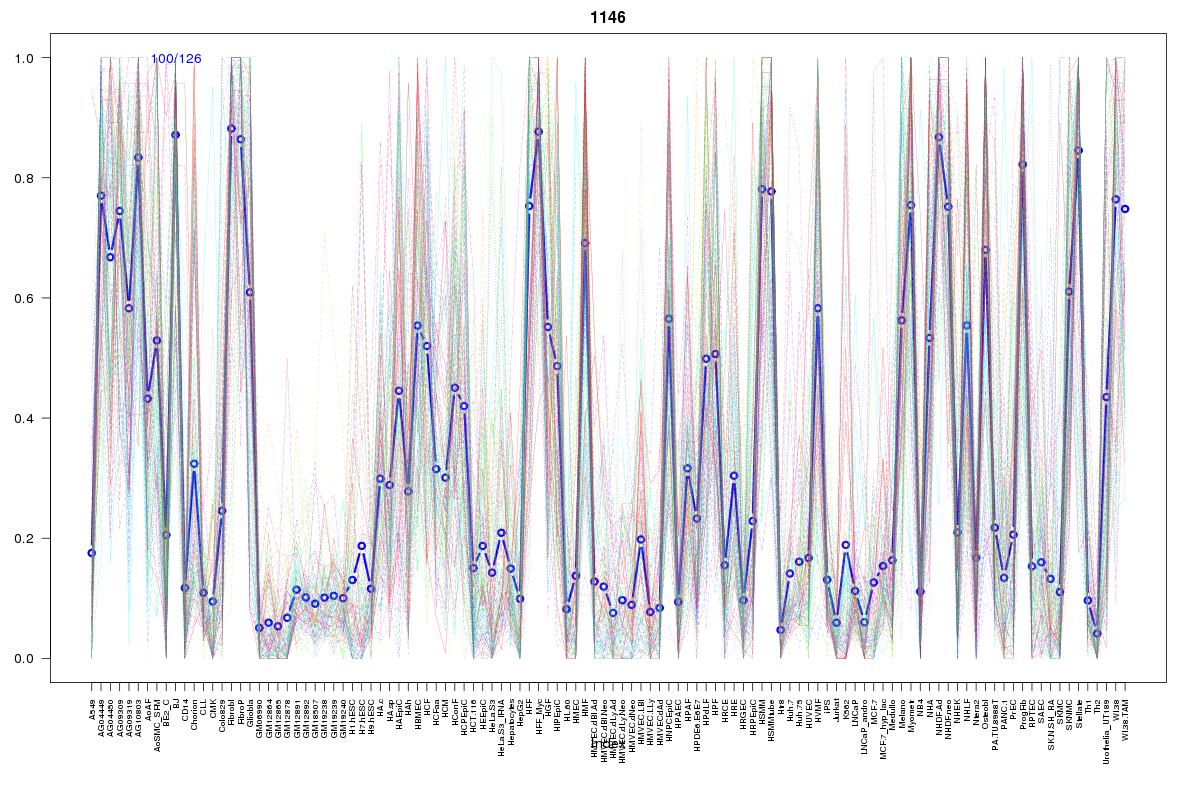 | 1146 | 1 |
 | 186 | 1 |
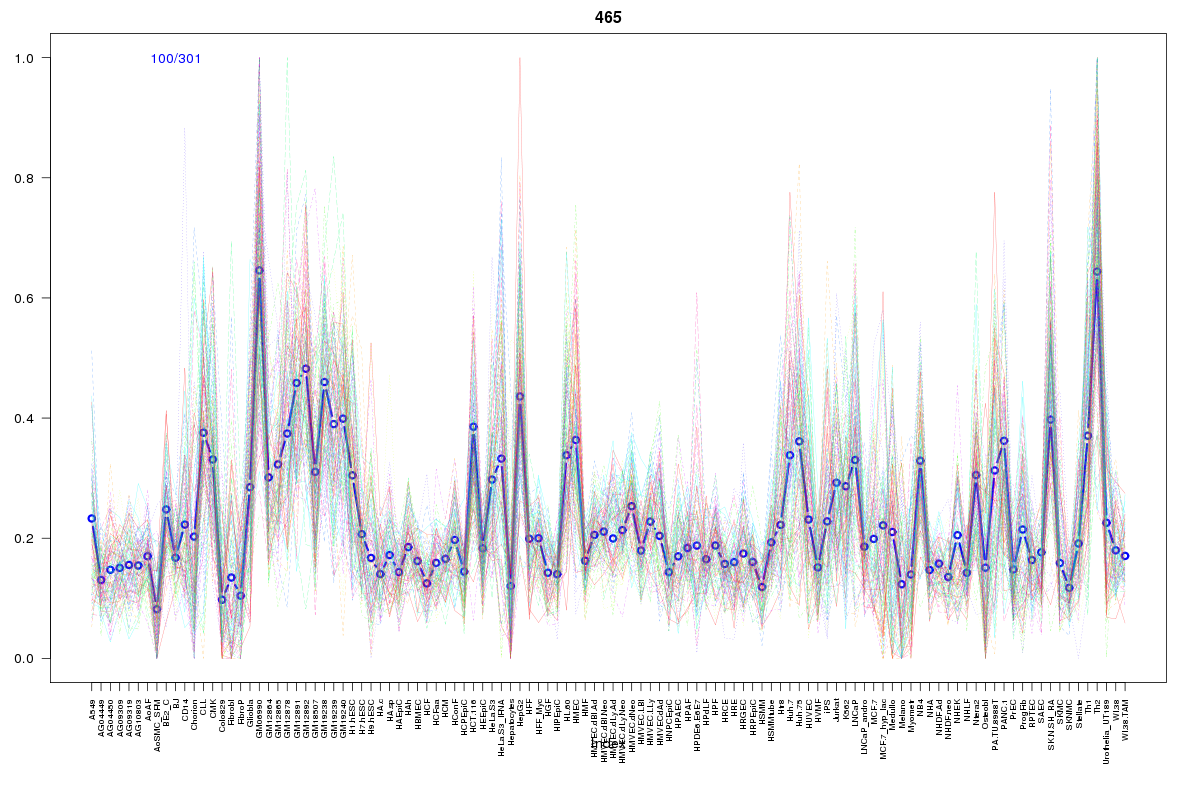 | 465 | 1 |
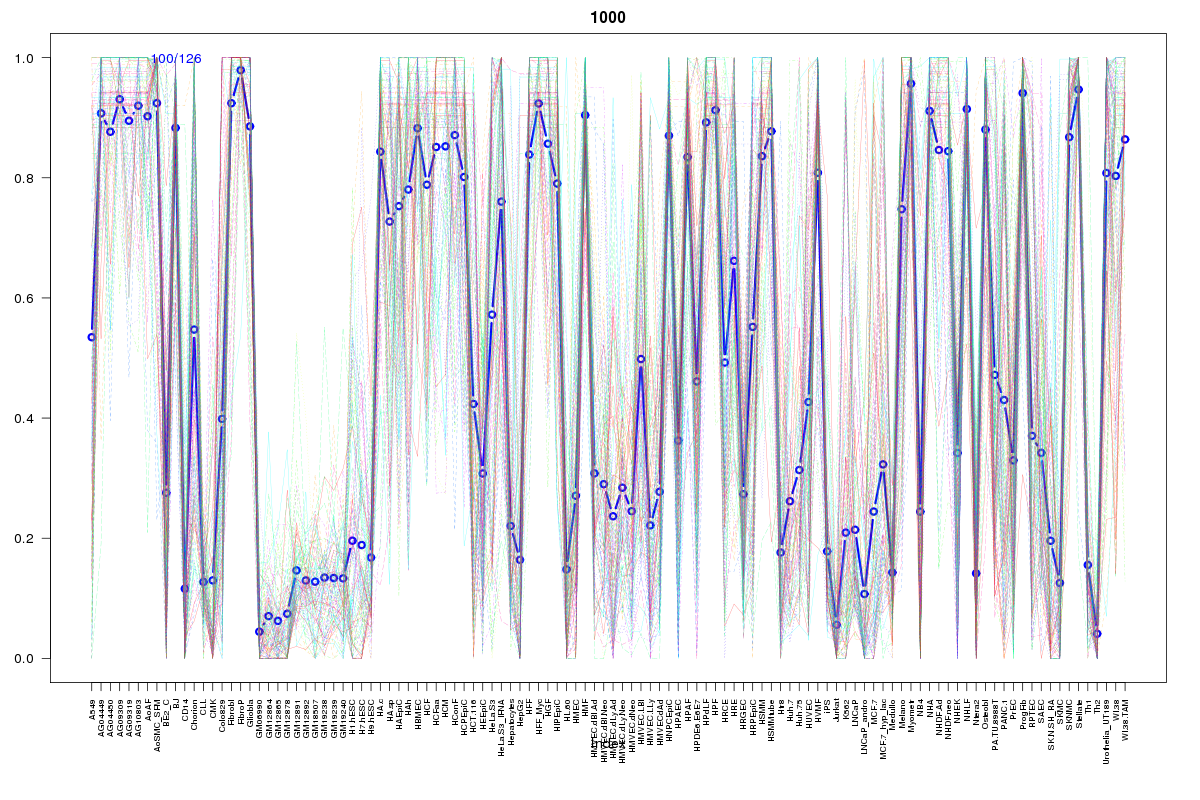 | 1000 | 1 |
 | 629 | 1 |
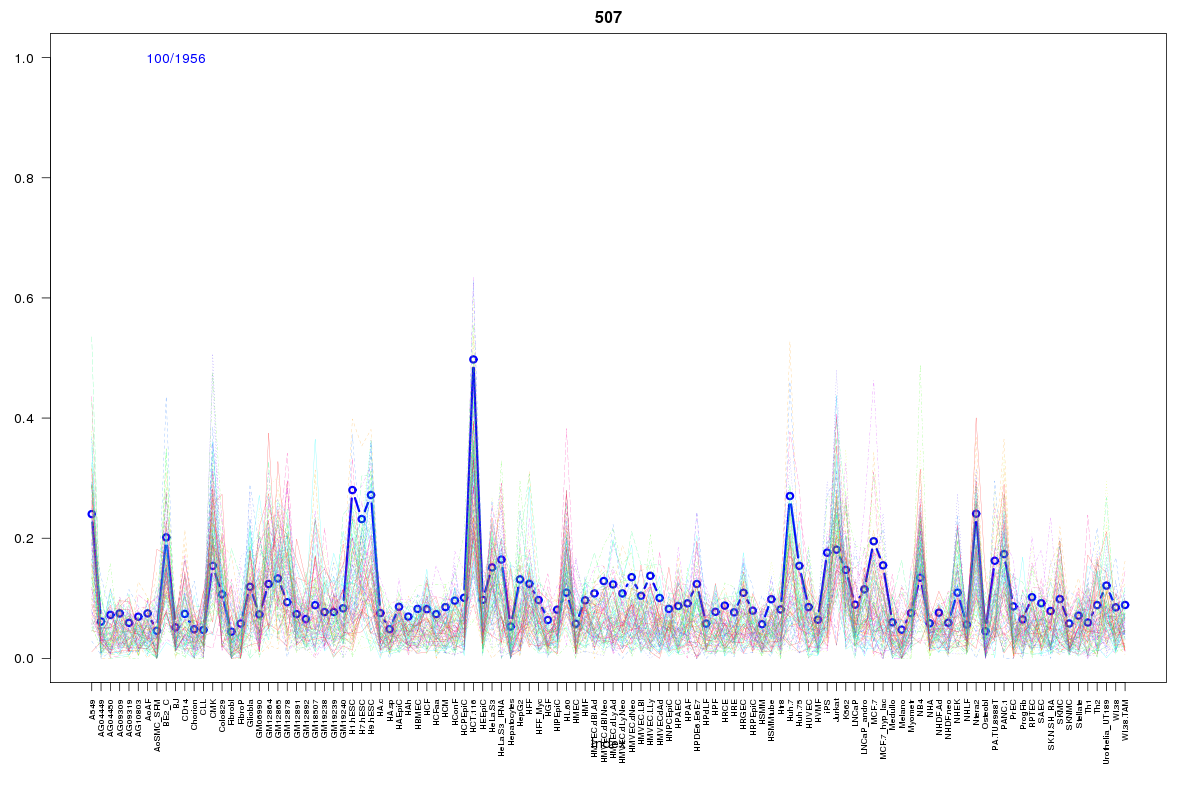 | 507 | 1 |
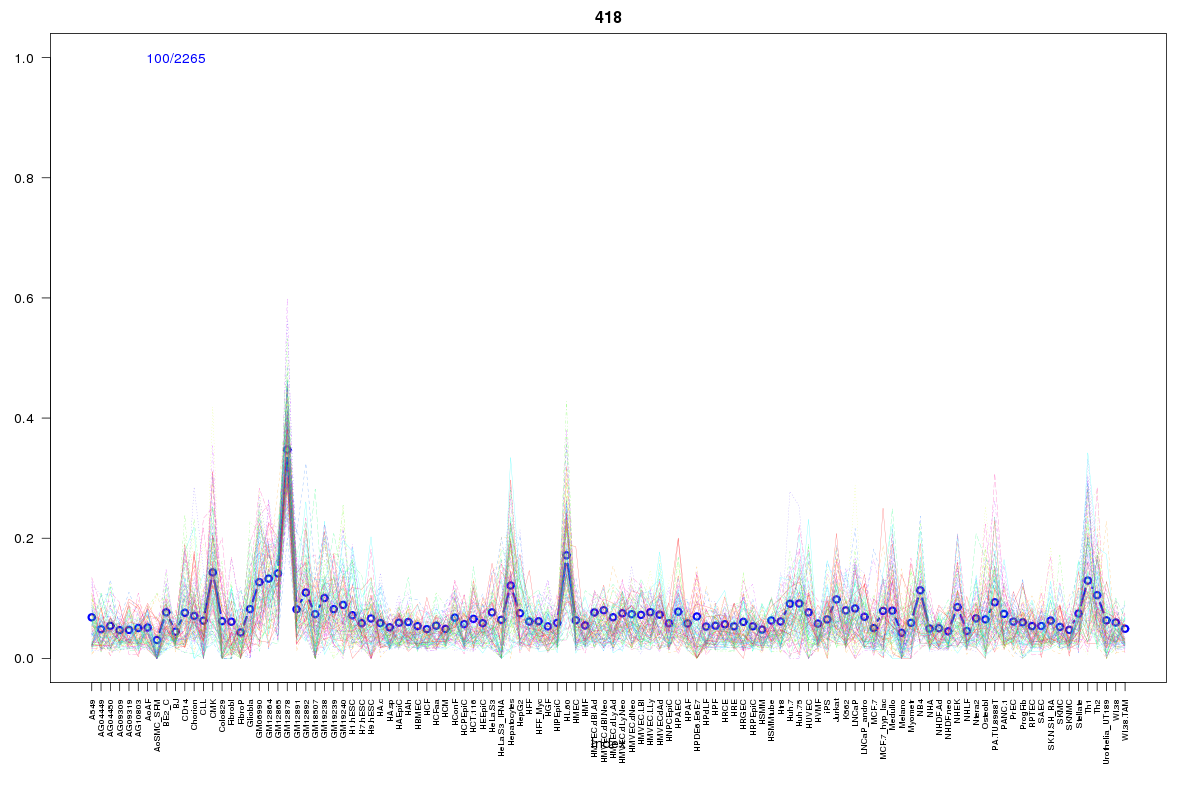 | 418 | 1 |
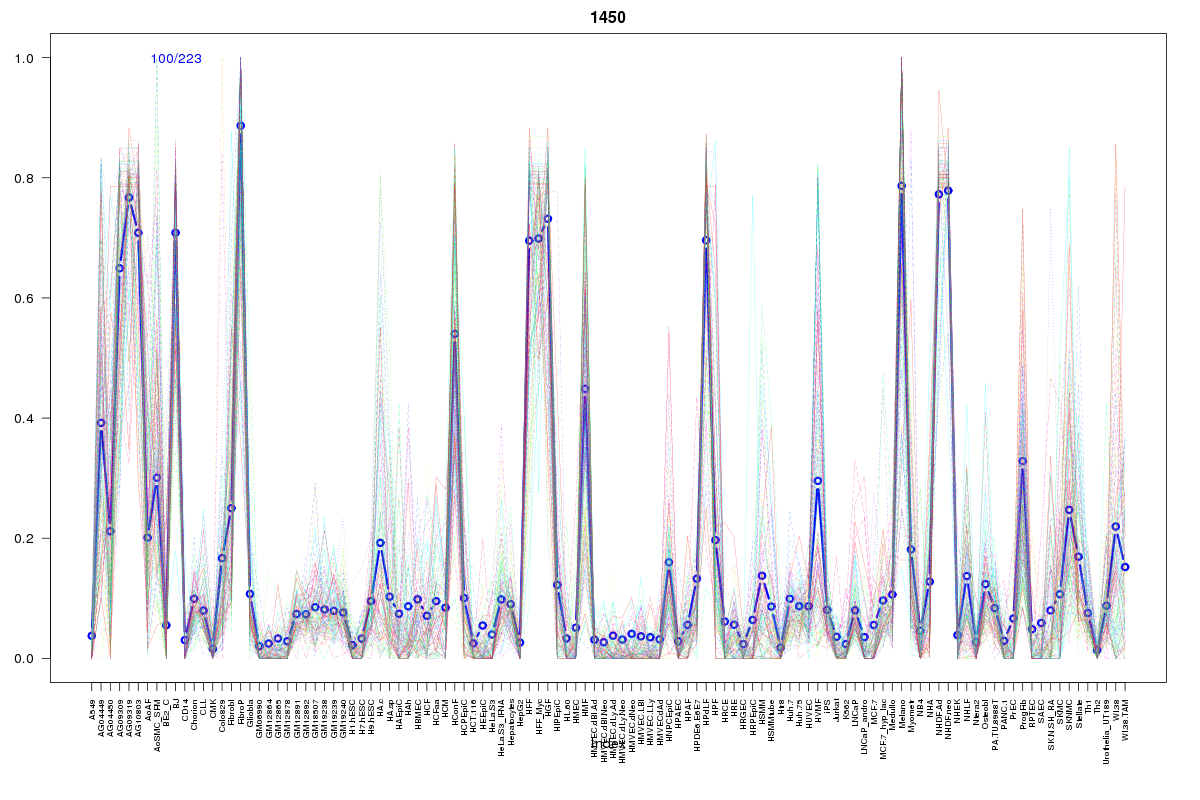 | 1450 | 1 |
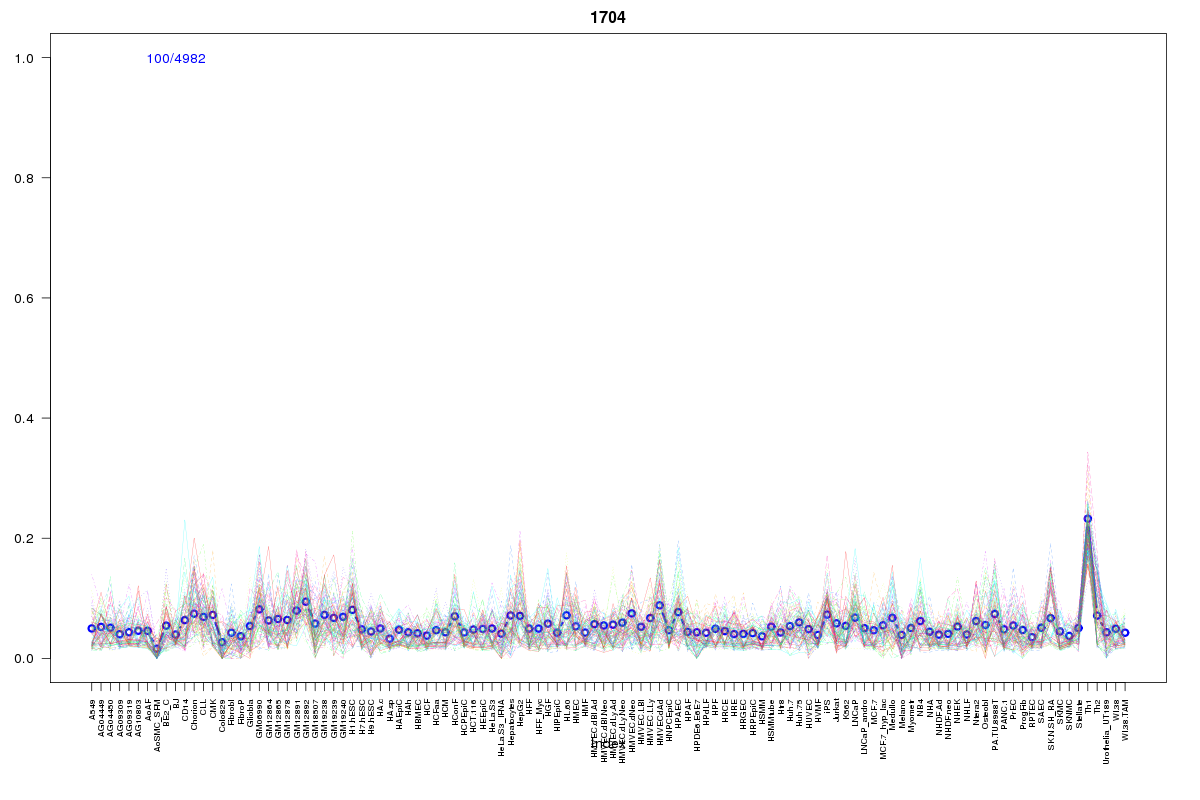 | 1704 | 1 |
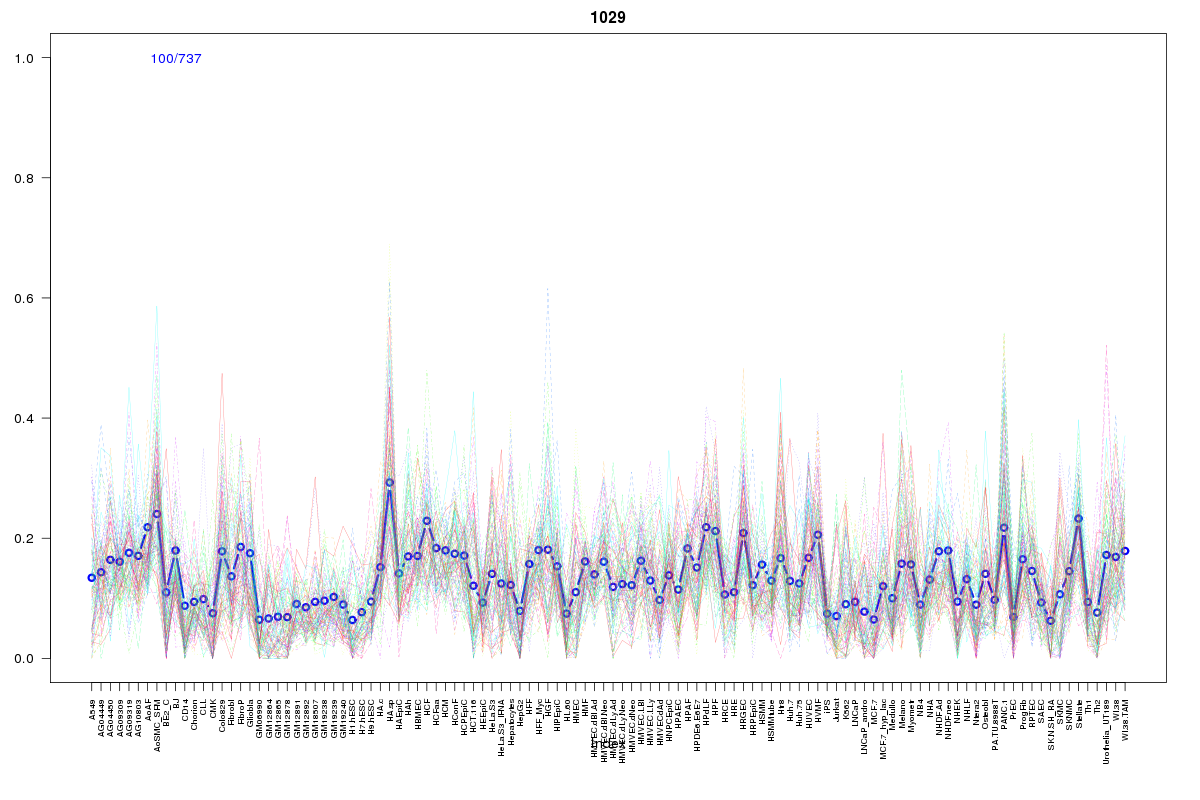 | 1029 | 1 |
 | 527 | 1 |
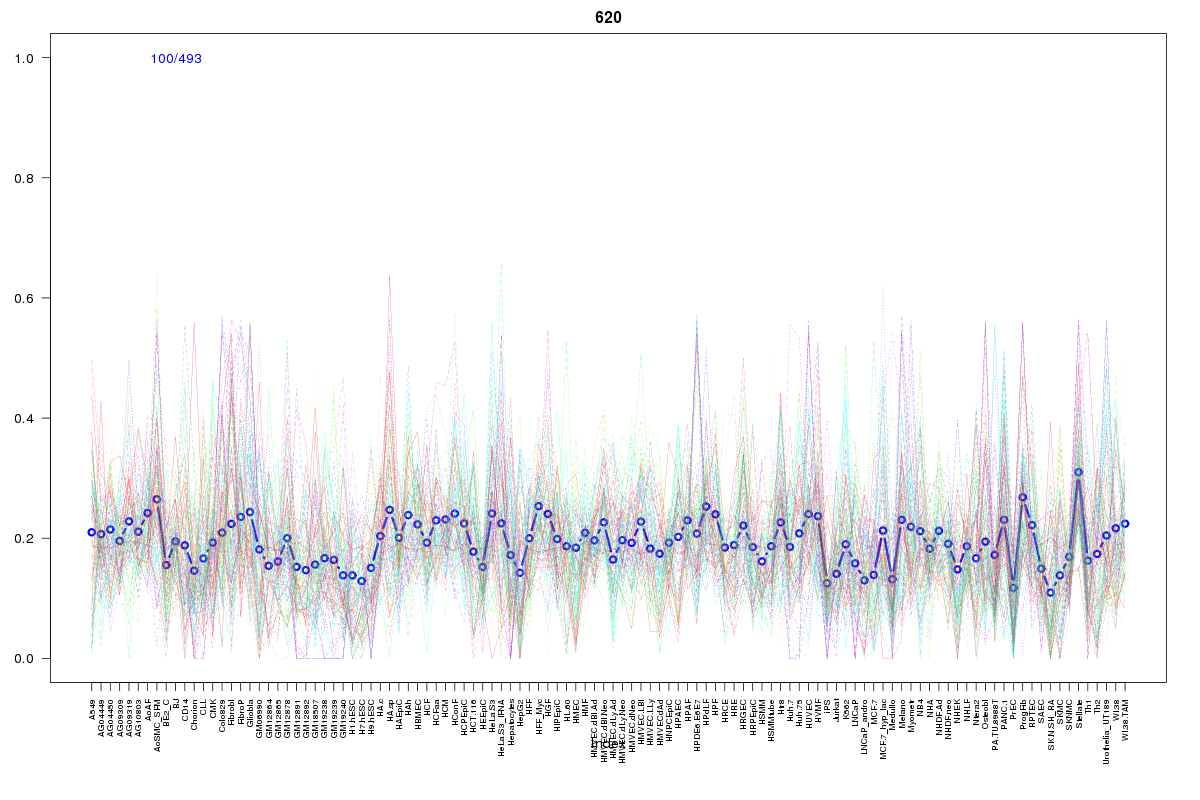 | 620 | 1 |
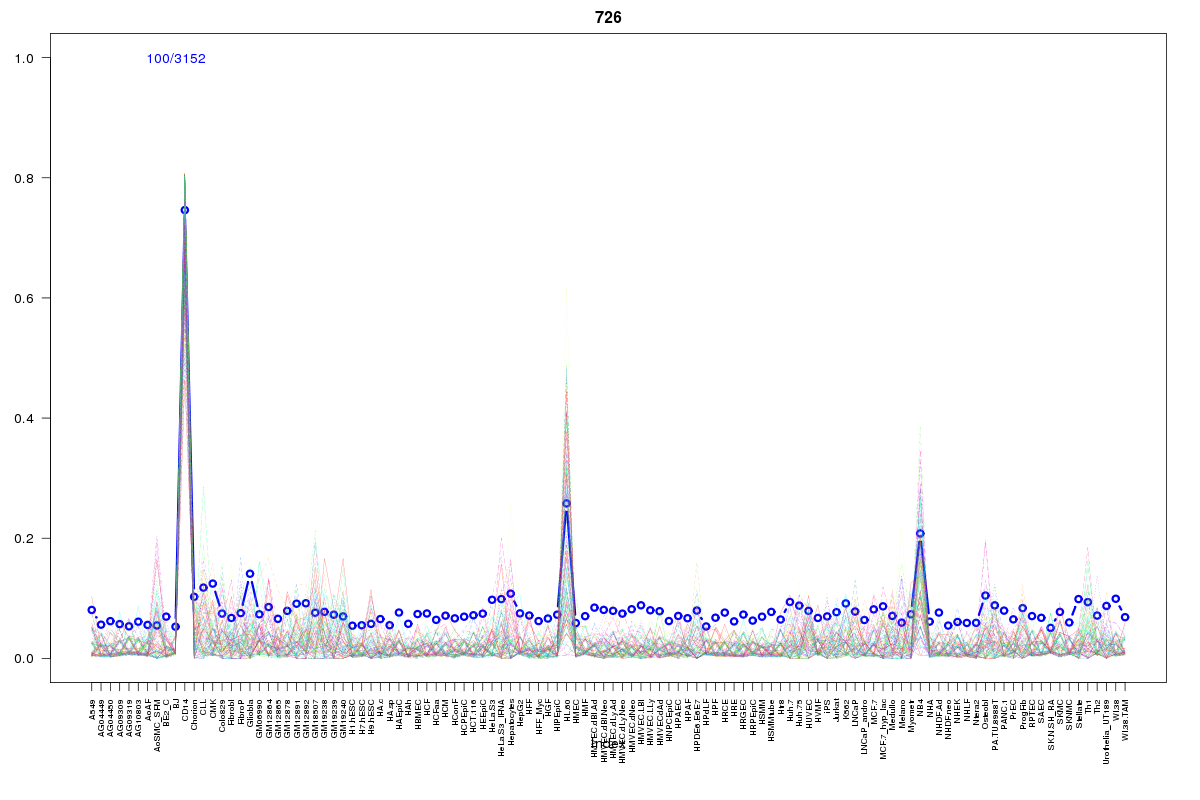 | 726 | 1 |
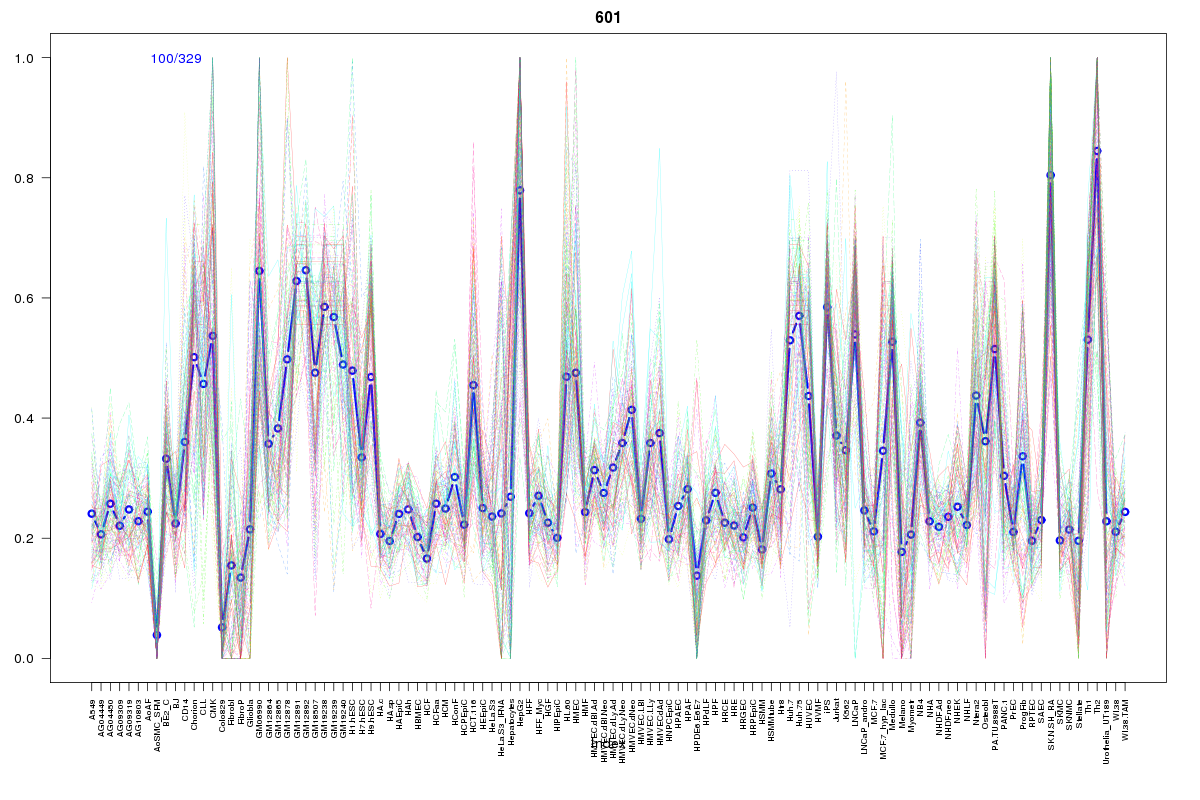 | 601 | 1 |
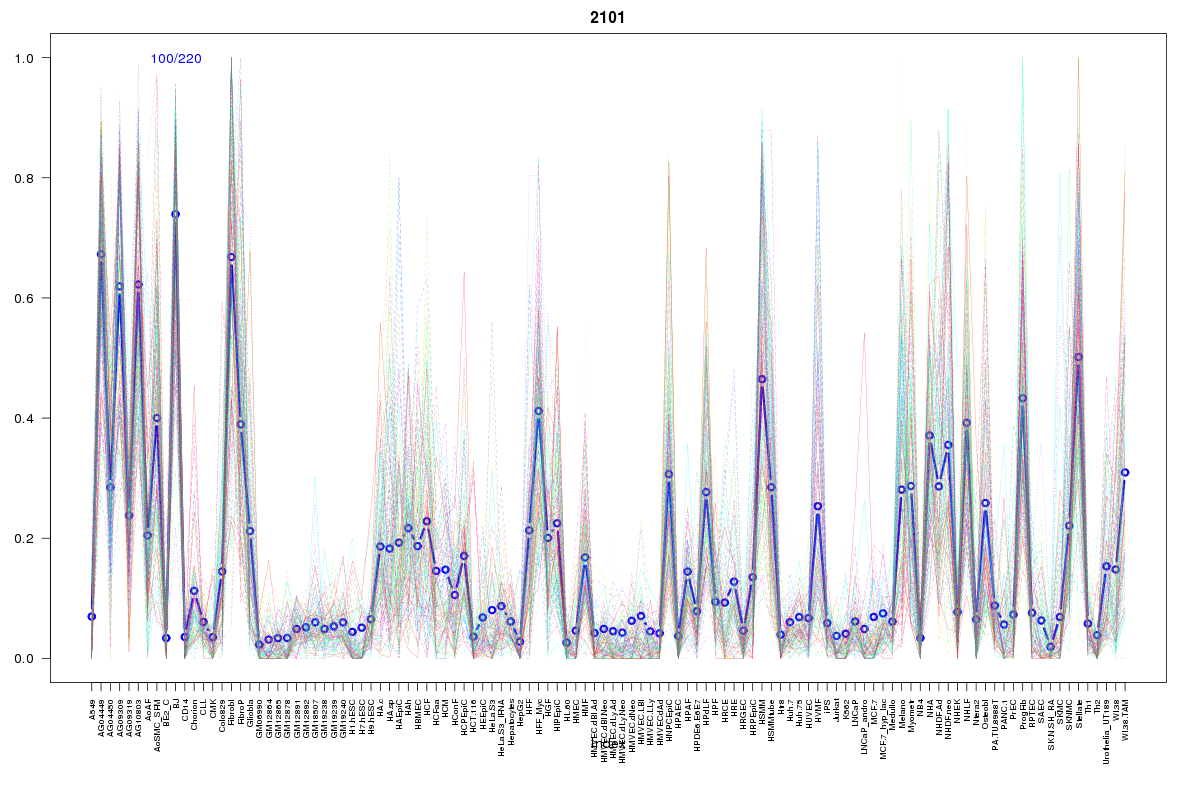 | 2101 | 1 |
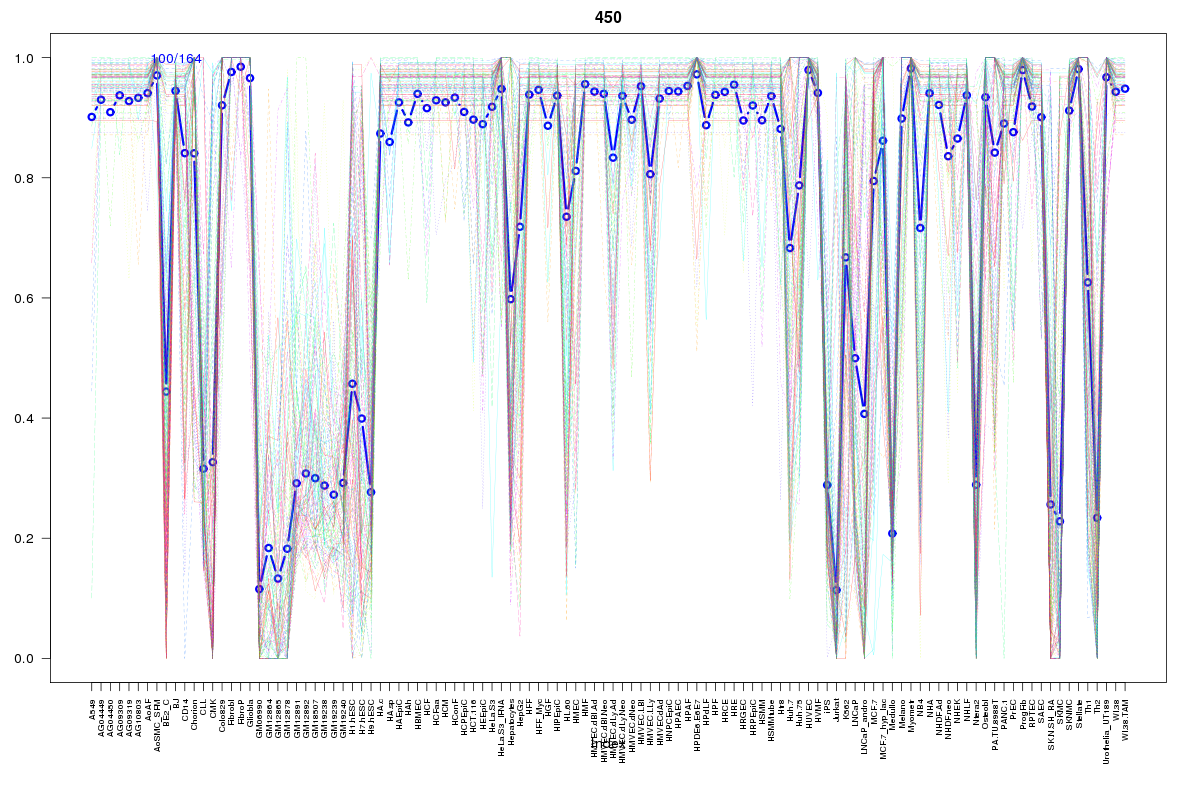 | 450 | 1 |
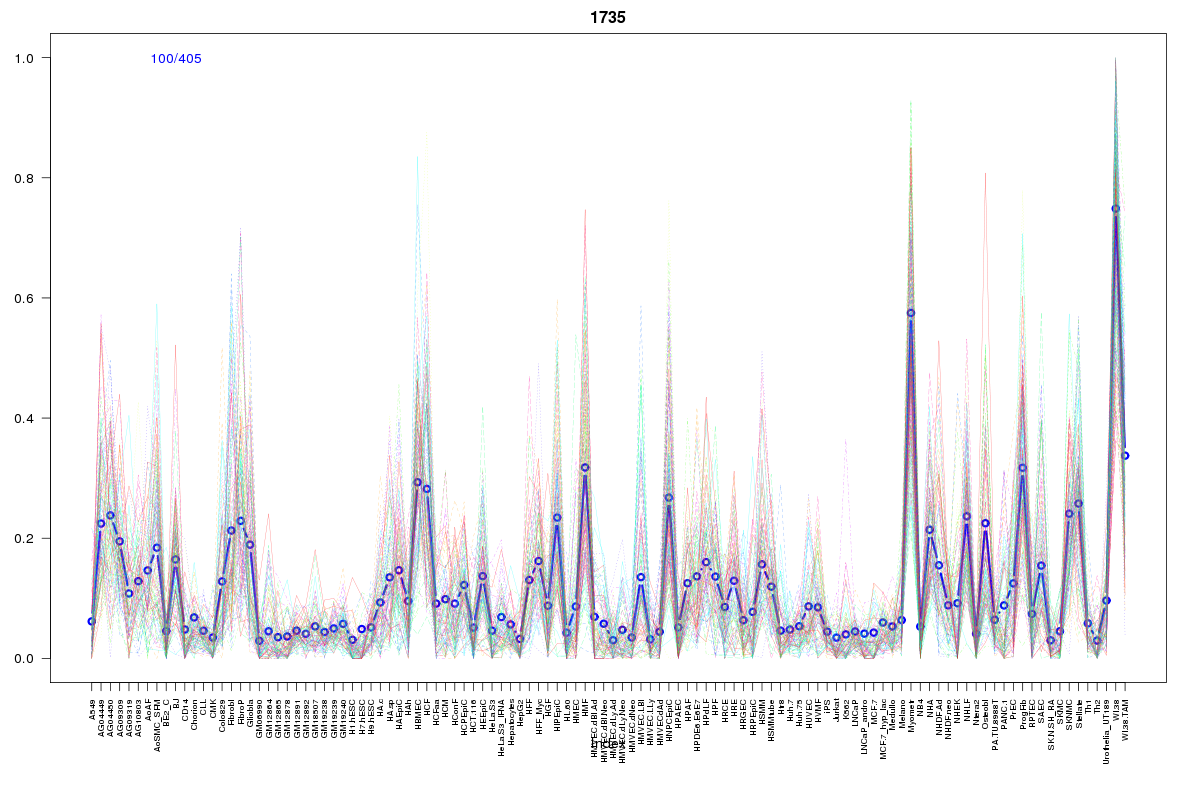 | 1735 | 1 |
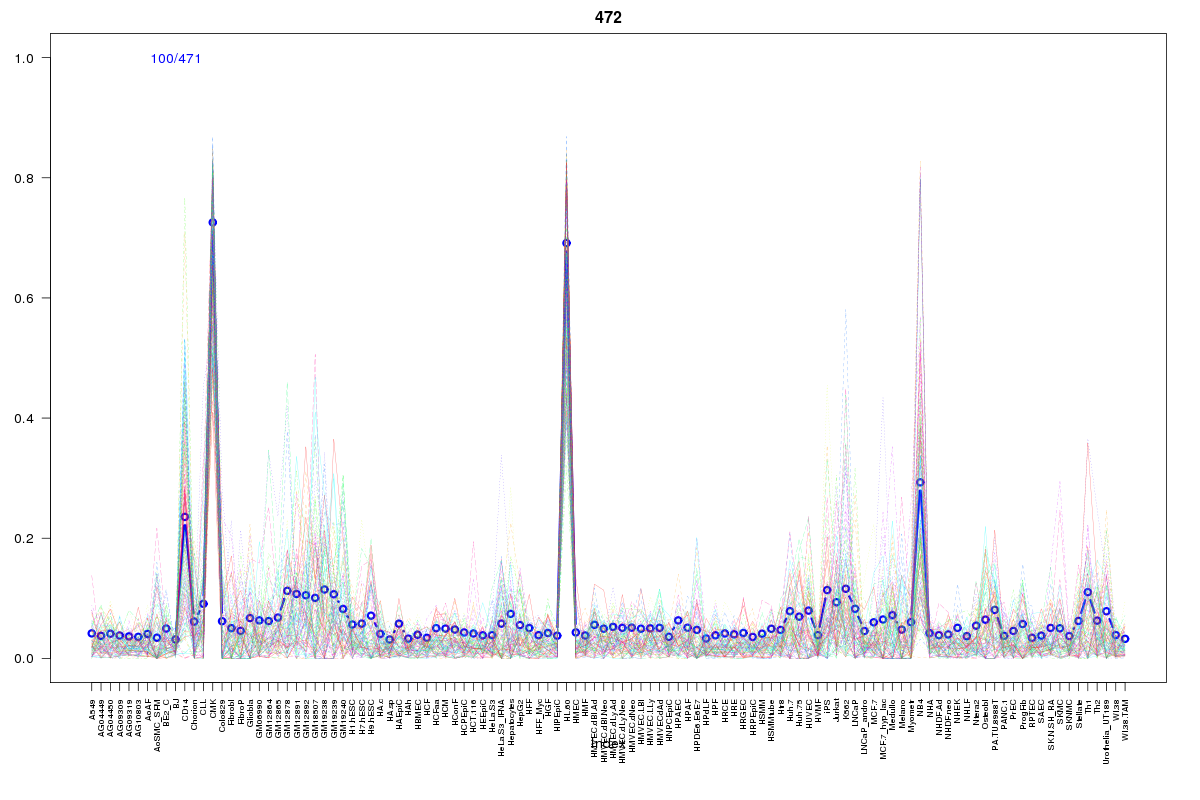 | 472 | 1 |
 | 568 | 1 |
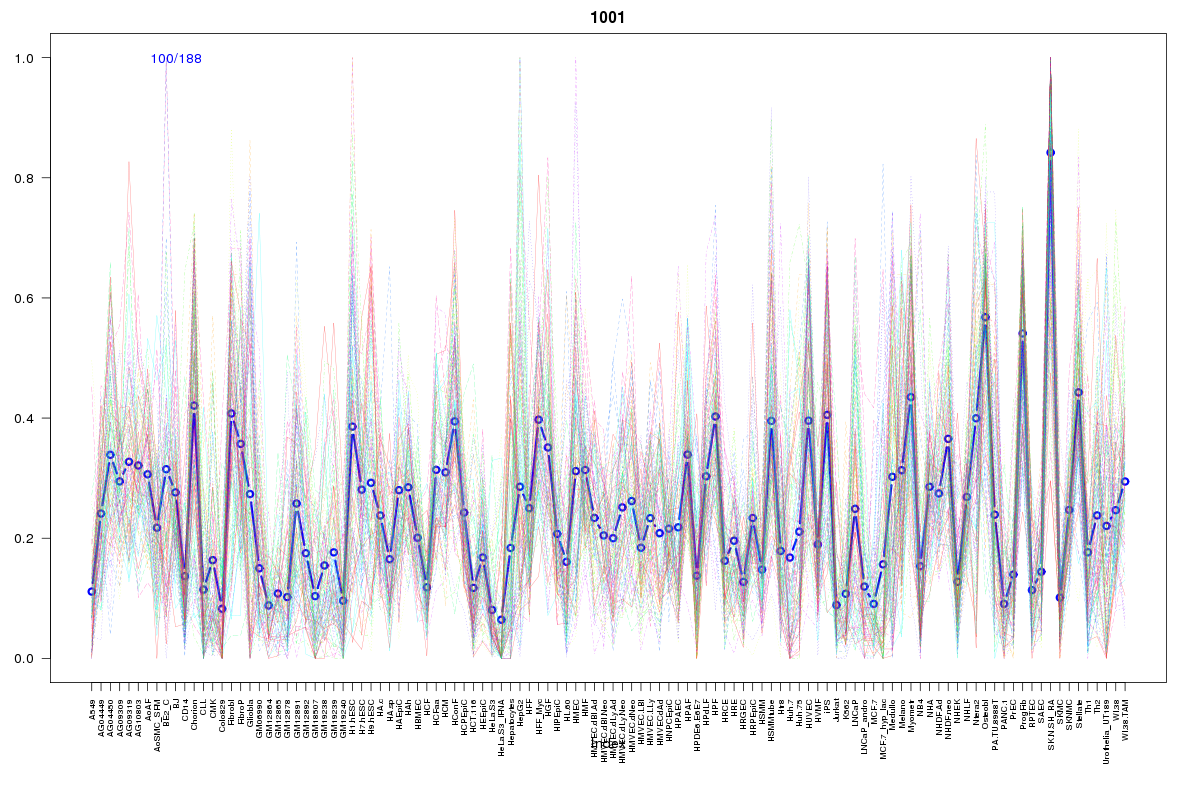 | 1001 | 1 |
Resources
BED file downloads
Connects to 26 DHS sitesTop 10 Correlated DHS Sites
p-values indiciate significant higher or lower correlation| Location | Cluster | P-value |
|---|---|---|
| chr13:114147720-114147870 | 450 | 0.004 |
| chr13:114065720-114065870 | 1000 | 0.004 |
| chr13:114280560-114280710 | 2101 | 0.011 |
| chr13:114199860-114200010 | 1001 | 0.011 |
| chr13:114143825-114143975 | 1029 | 0.014 |
| chr13:114154360-114154510 | 1735 | 0.014 |
| chr13:114065280-114065430 | 186 | 0.015 |
| chr13:114064820-114064970 | 1146 | 0.016 |
| chr13:114144000-114144150 | 620 | 0.023 |
| chr13:114108380-114108530 | 1450 | 0.024 |
| chr13:114105700-114105850 | 507 | 0.023 |
External Databases
UCSCEnsembl (ENSG00000150403)