Gene: CACNA1C
chr12: 2079951-2224550Expression Profile
(log scale)
Graphical Connections
Distribution of linked clusters:
You may find it interesting if many of the connected DHS sites belong to the same cluster.| Cluster Profile | Cluster ID | Number of DHS sites in this cluster |
|---|---|---|
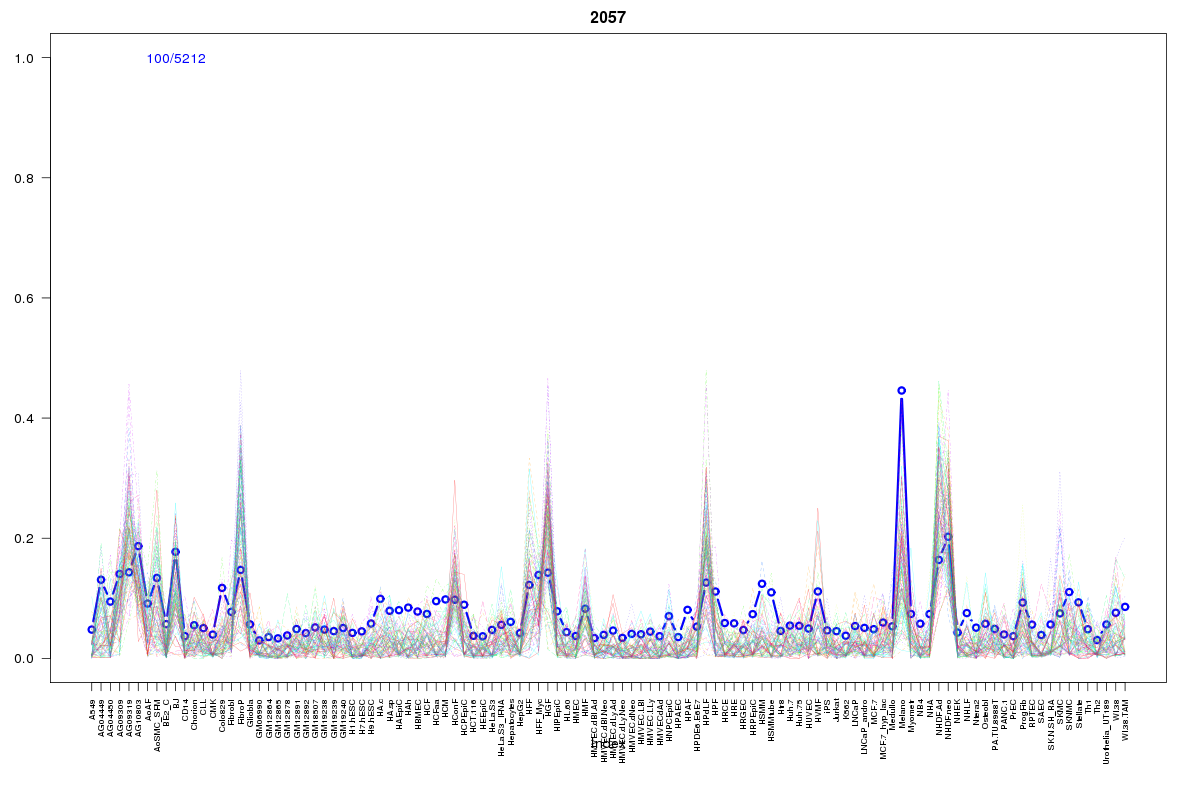 | 2057 | 5 |
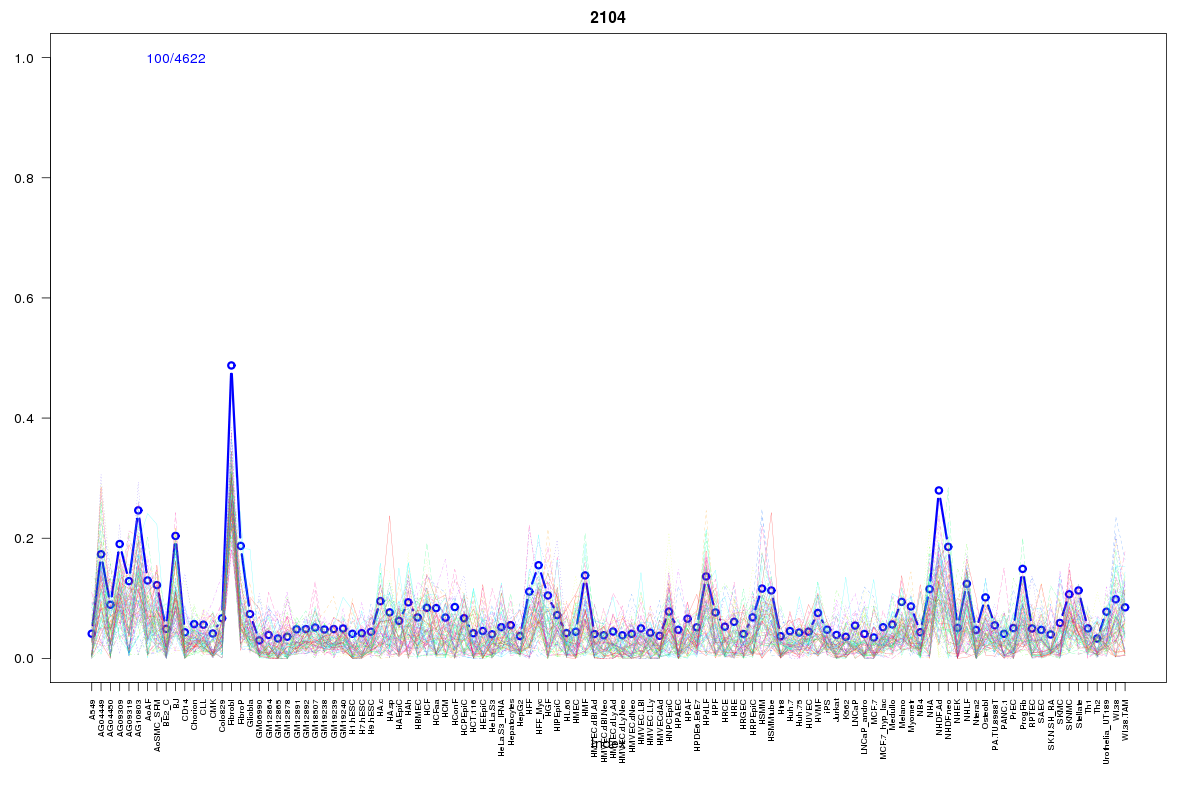 | 2104 | 4 |
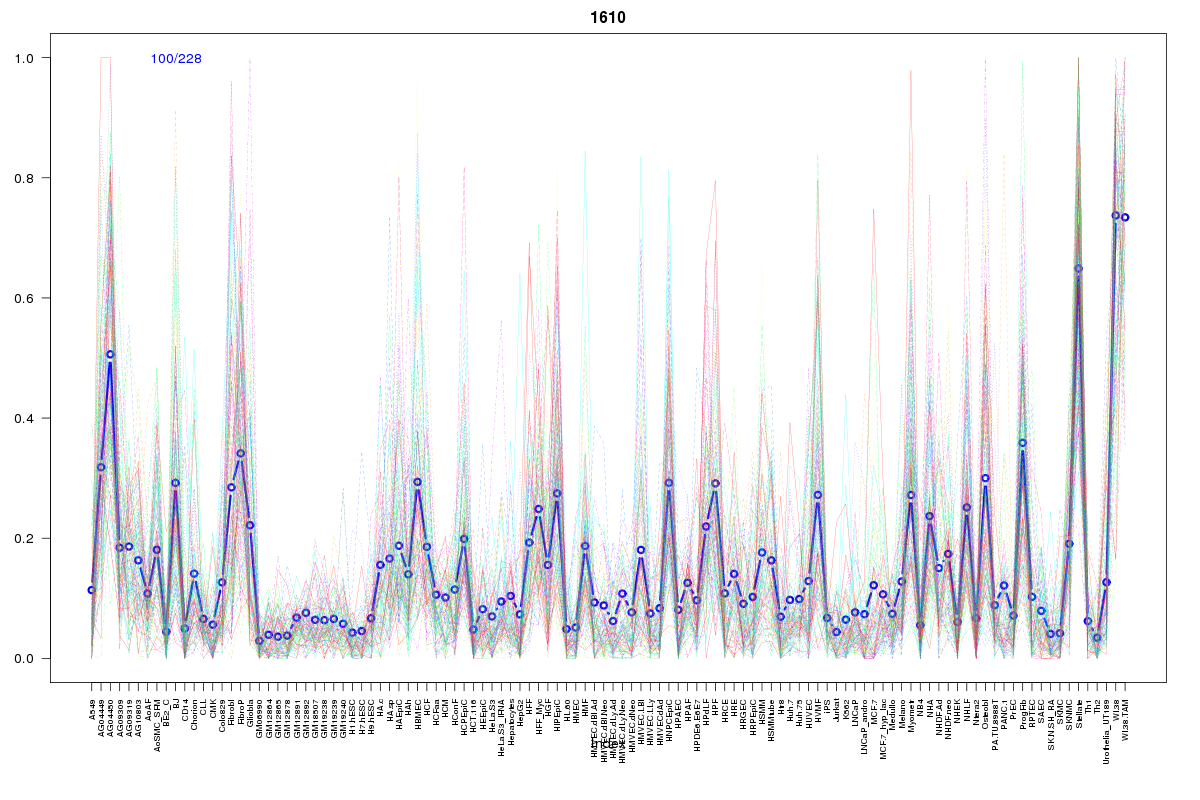 | 1610 | 3 |
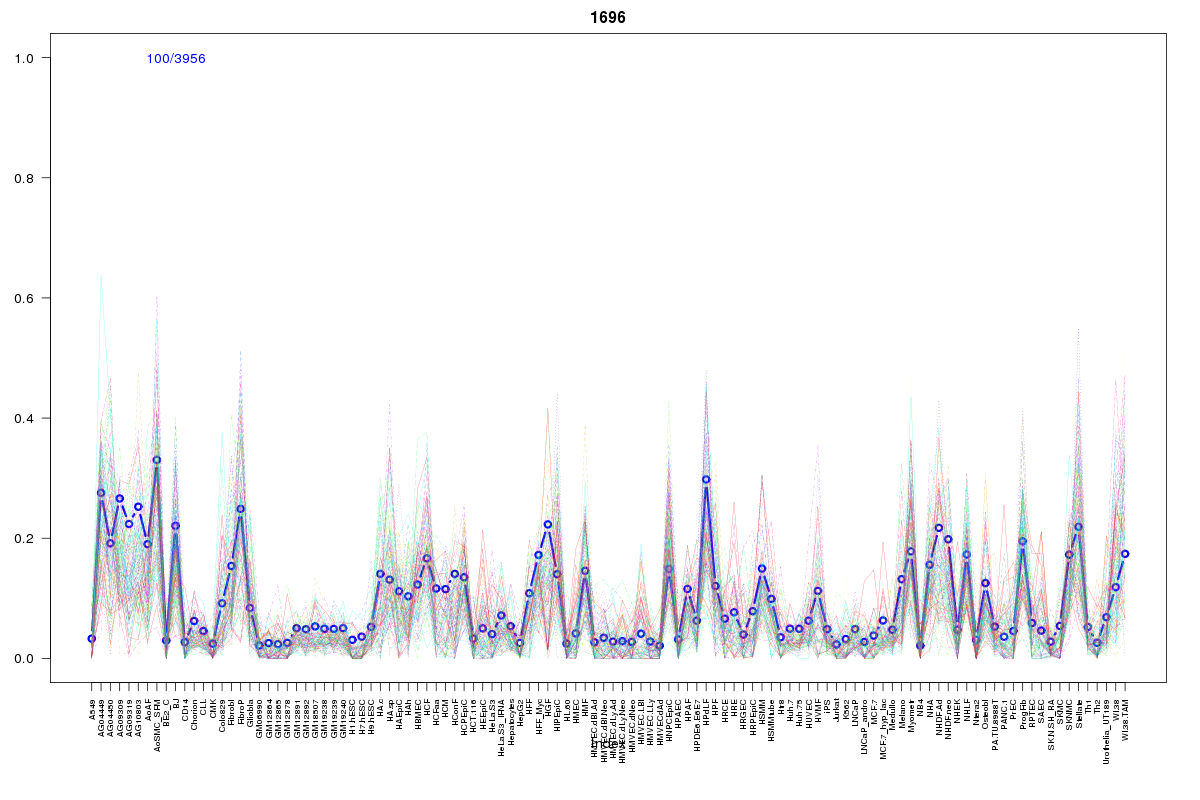 | 1696 | 3 |
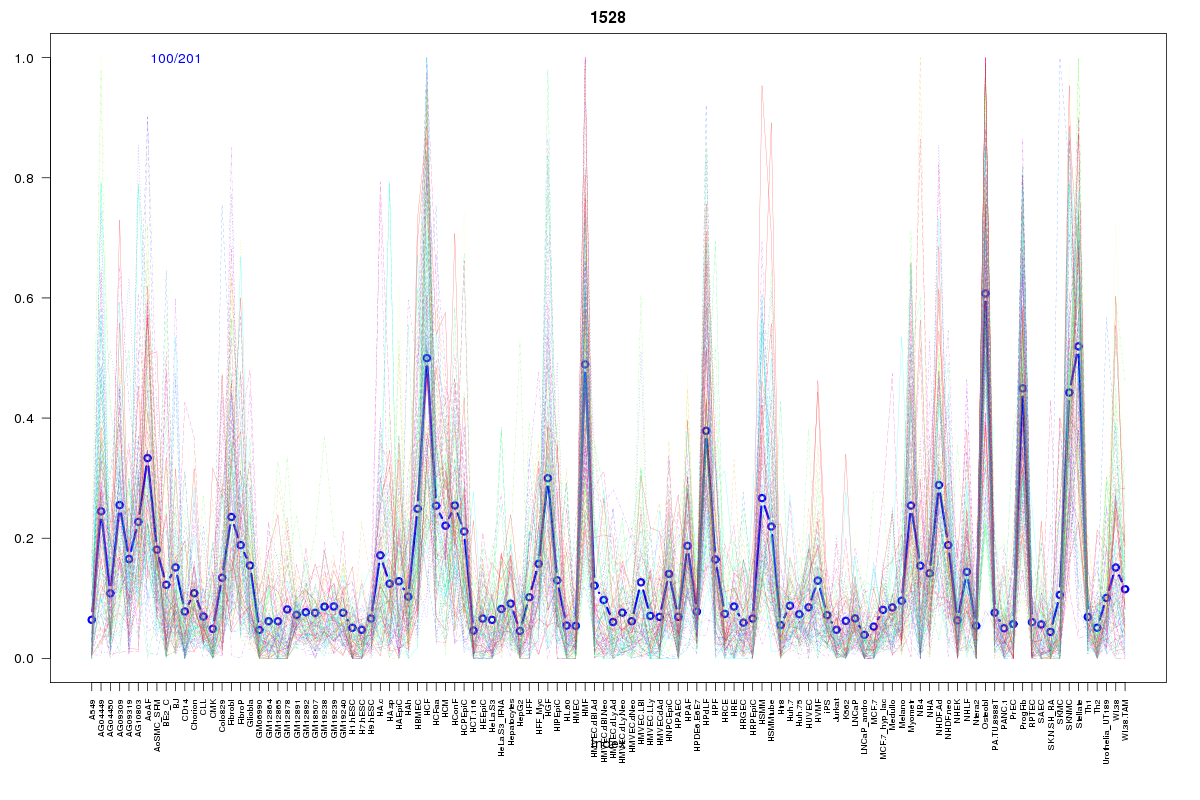 | 1528 | 3 |
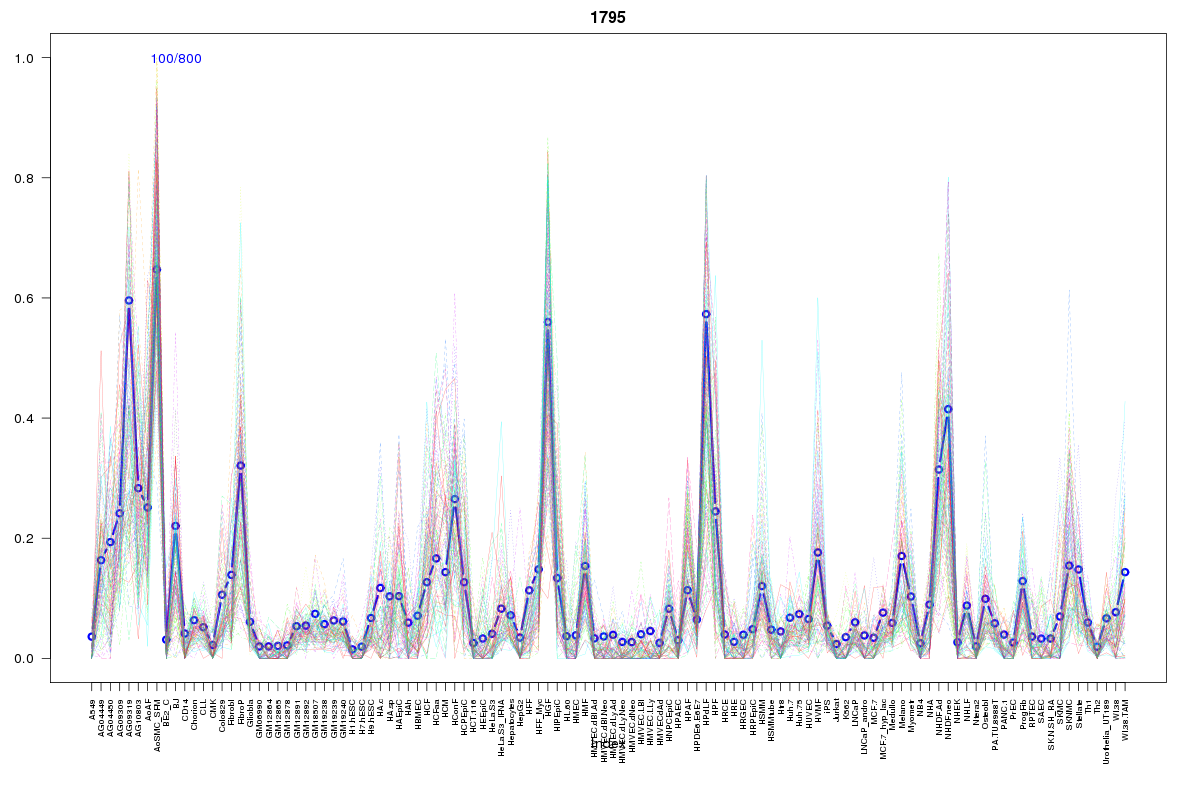 | 1795 | 3 |
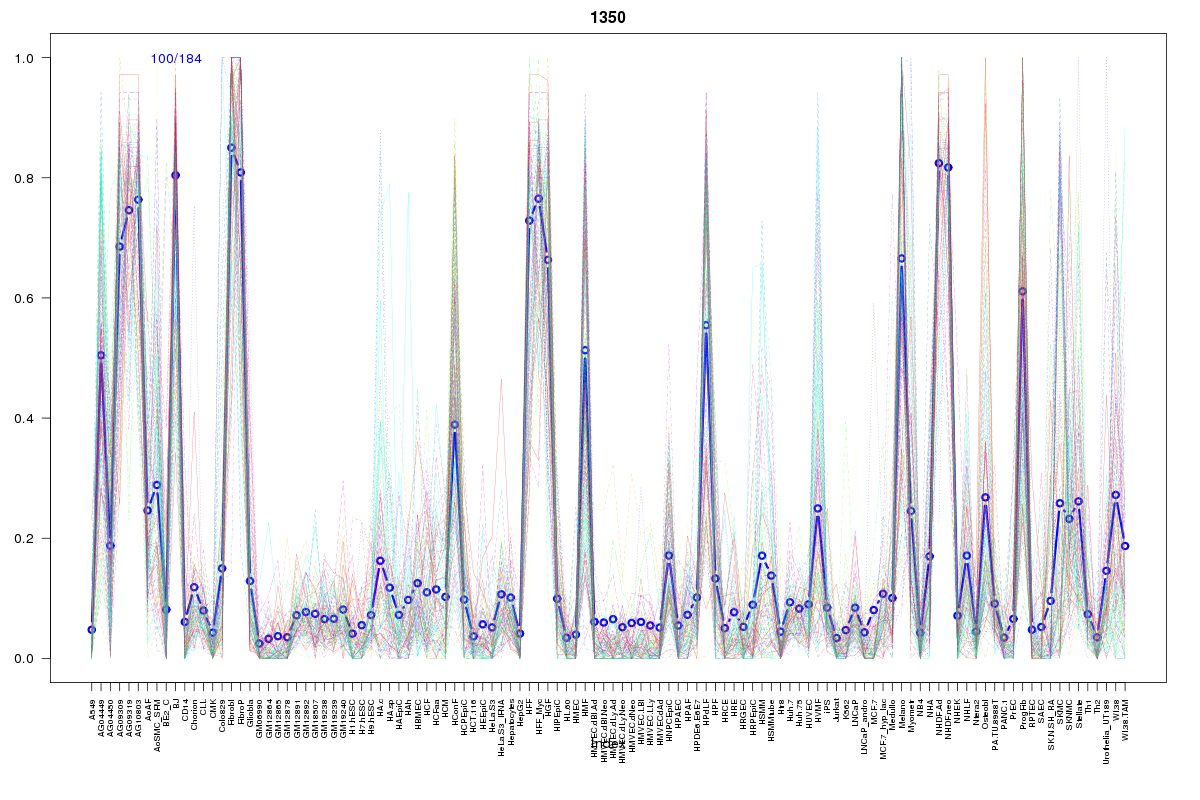 | 1350 | 3 |
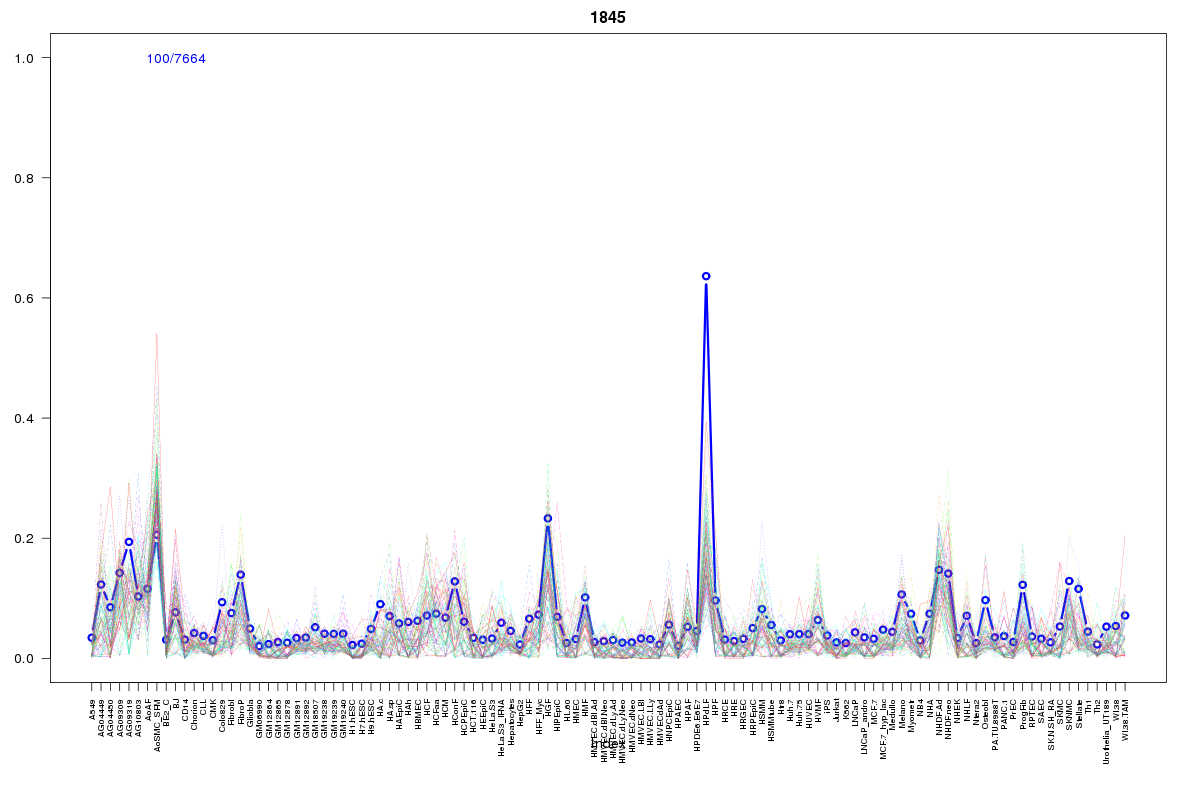 | 1845 | 3 |
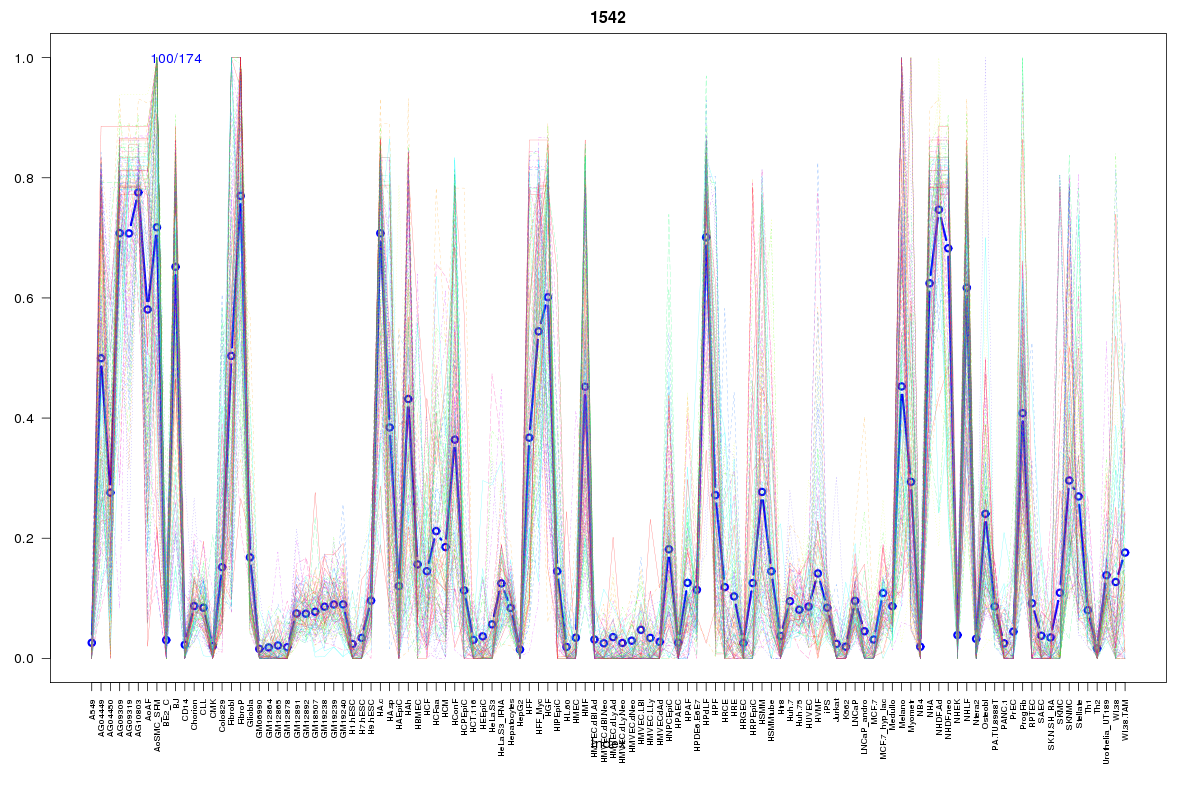 | 1542 | 2 |
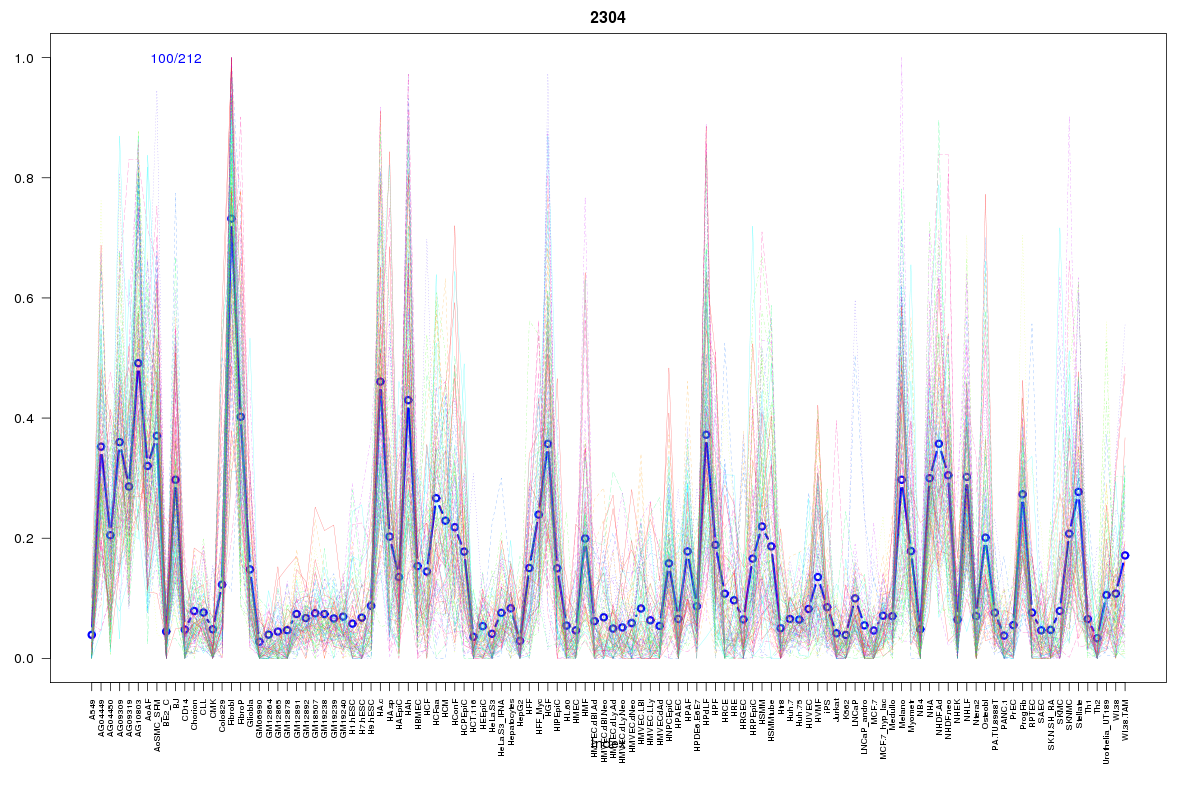 | 2304 | 2 |
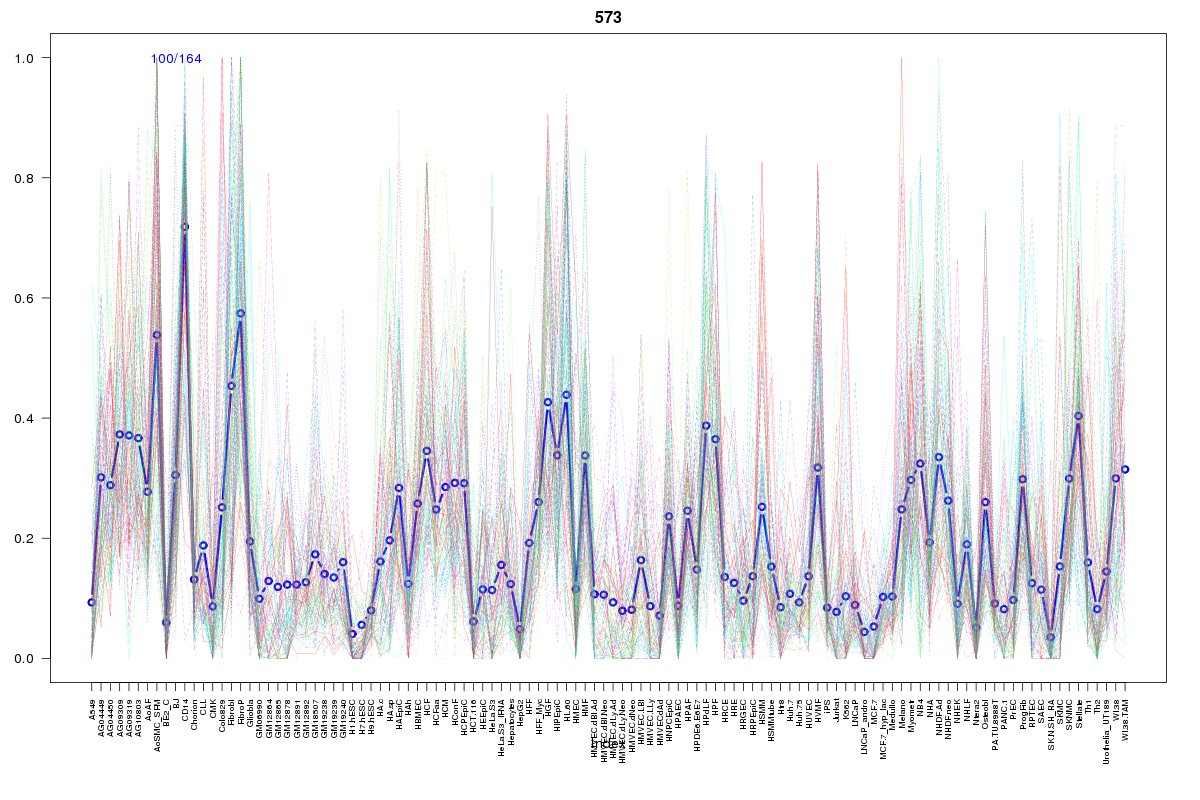 | 573 | 2 |
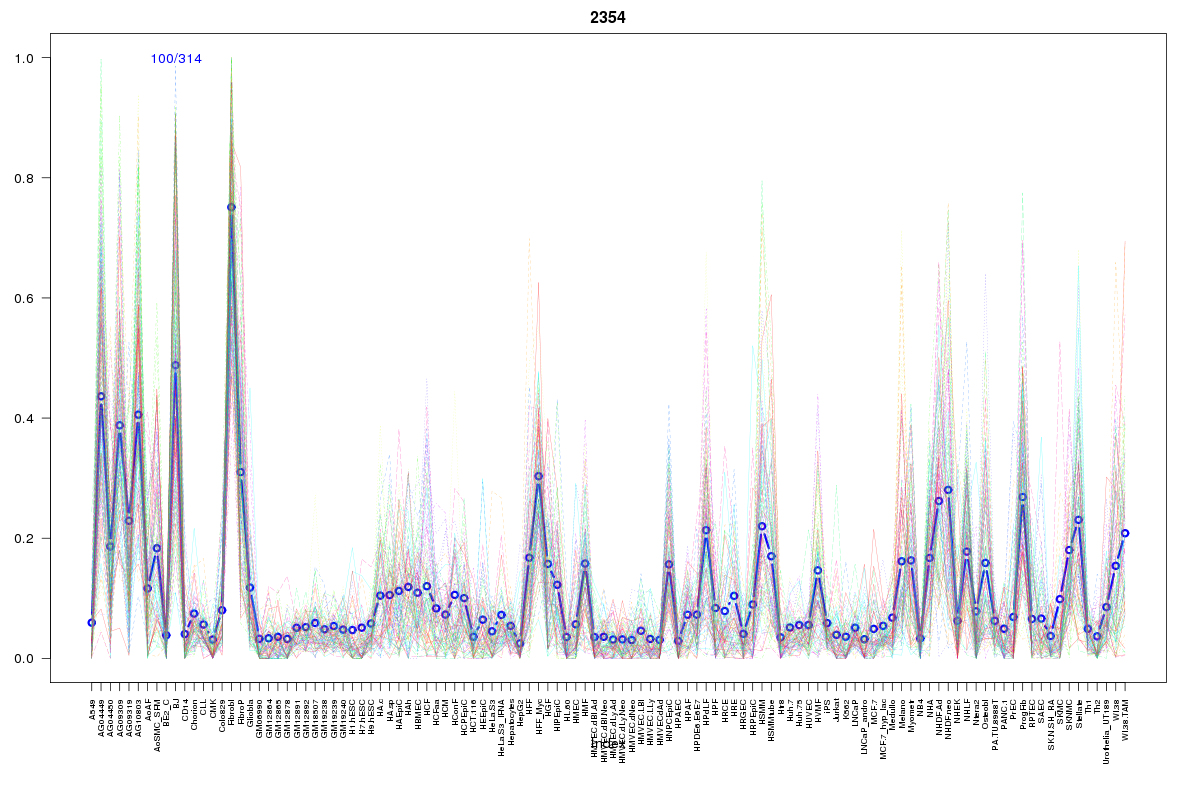 | 2354 | 2 |
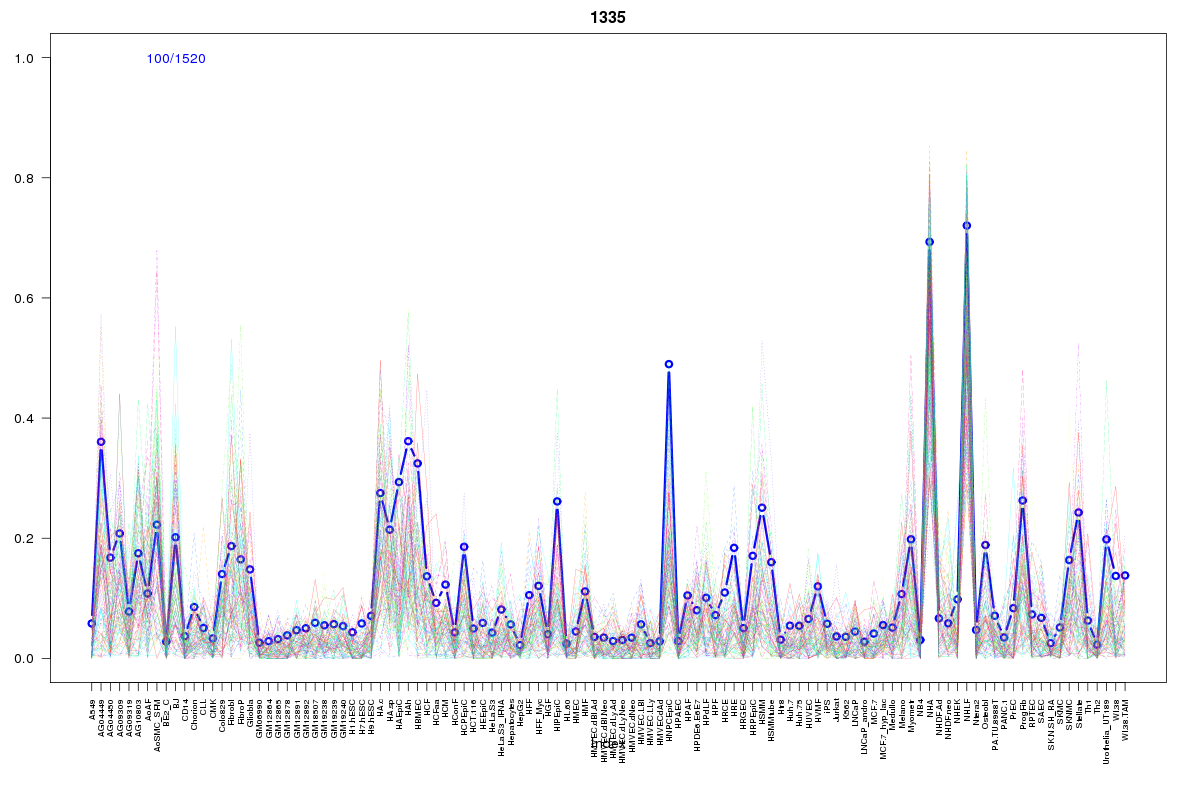 | 1335 | 2 |
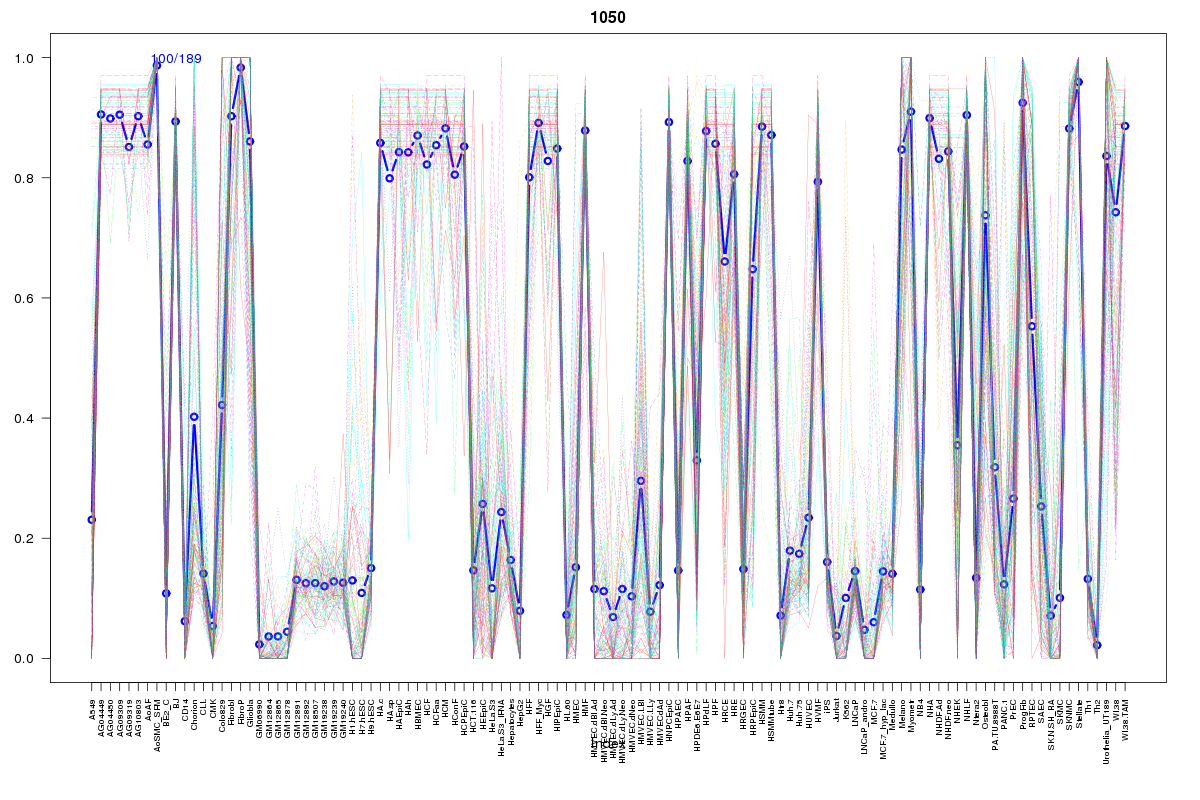 | 1050 | 2 |
 | 1561 | 2 |
 | 1639 | 1 |
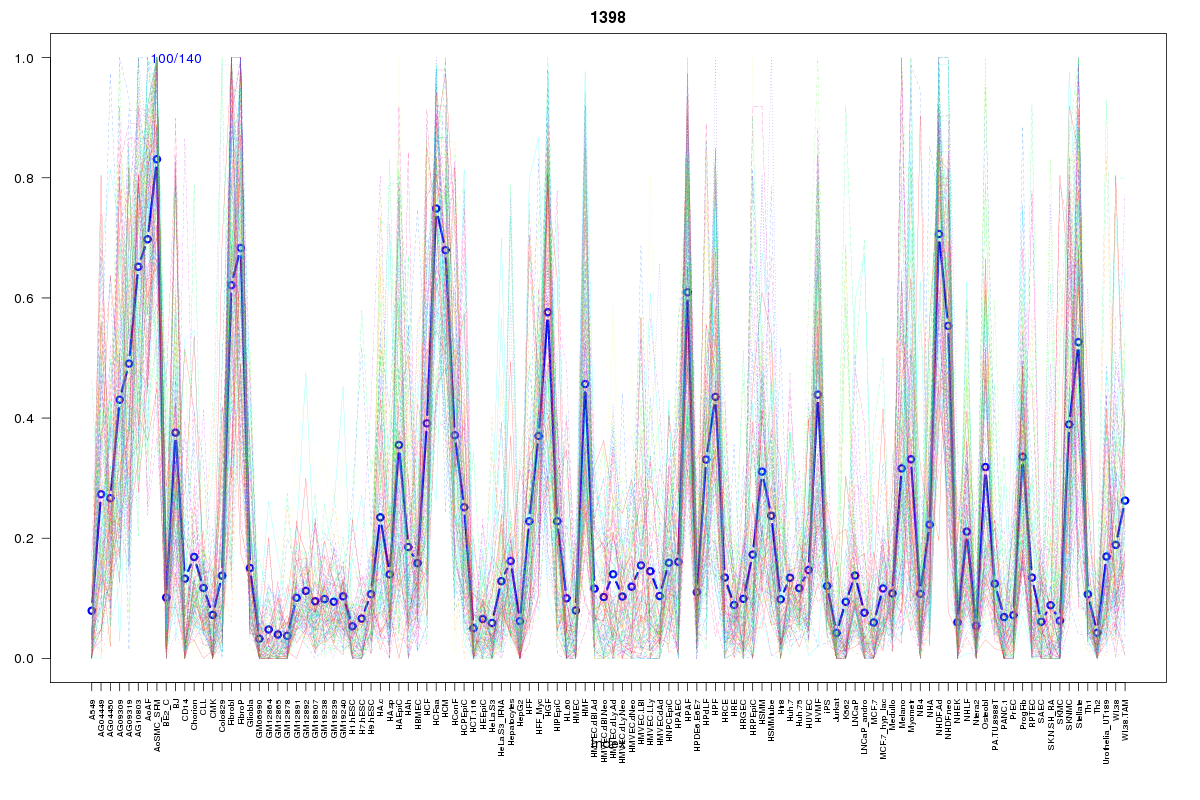 | 1398 | 1 |
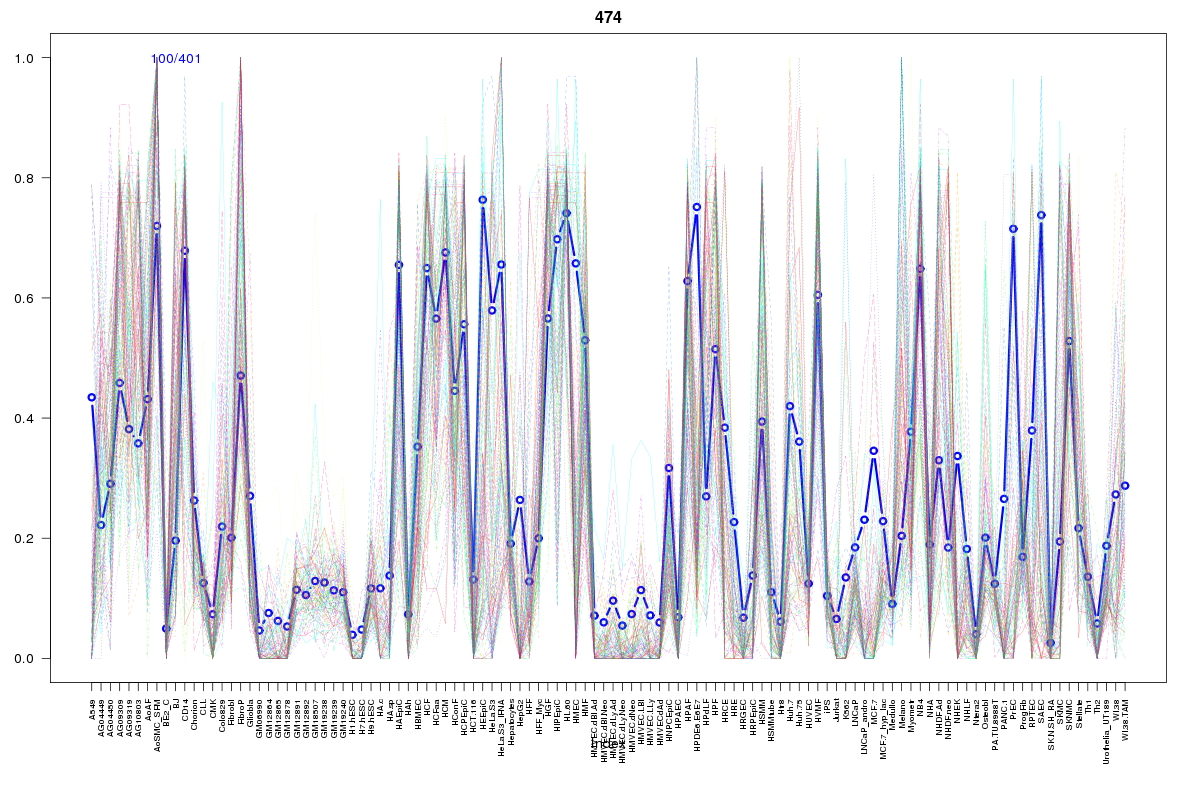 | 474 | 1 |
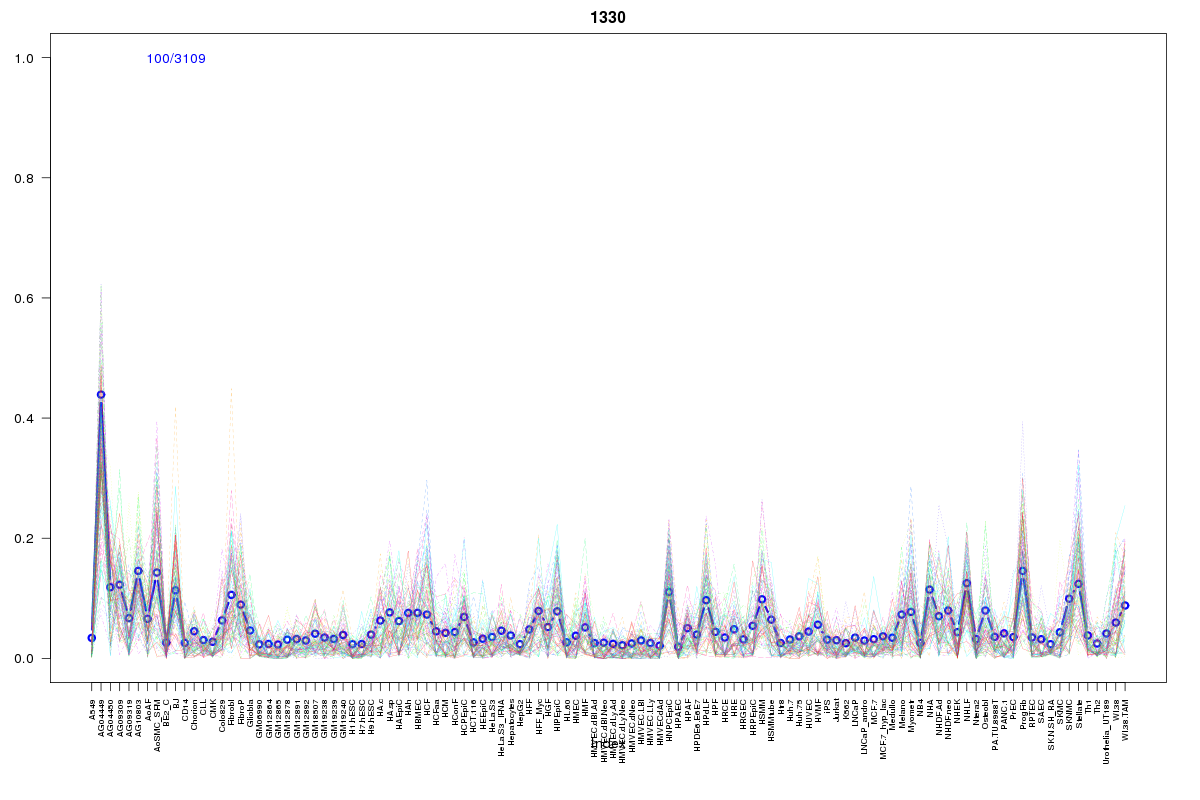 | 1330 | 1 |
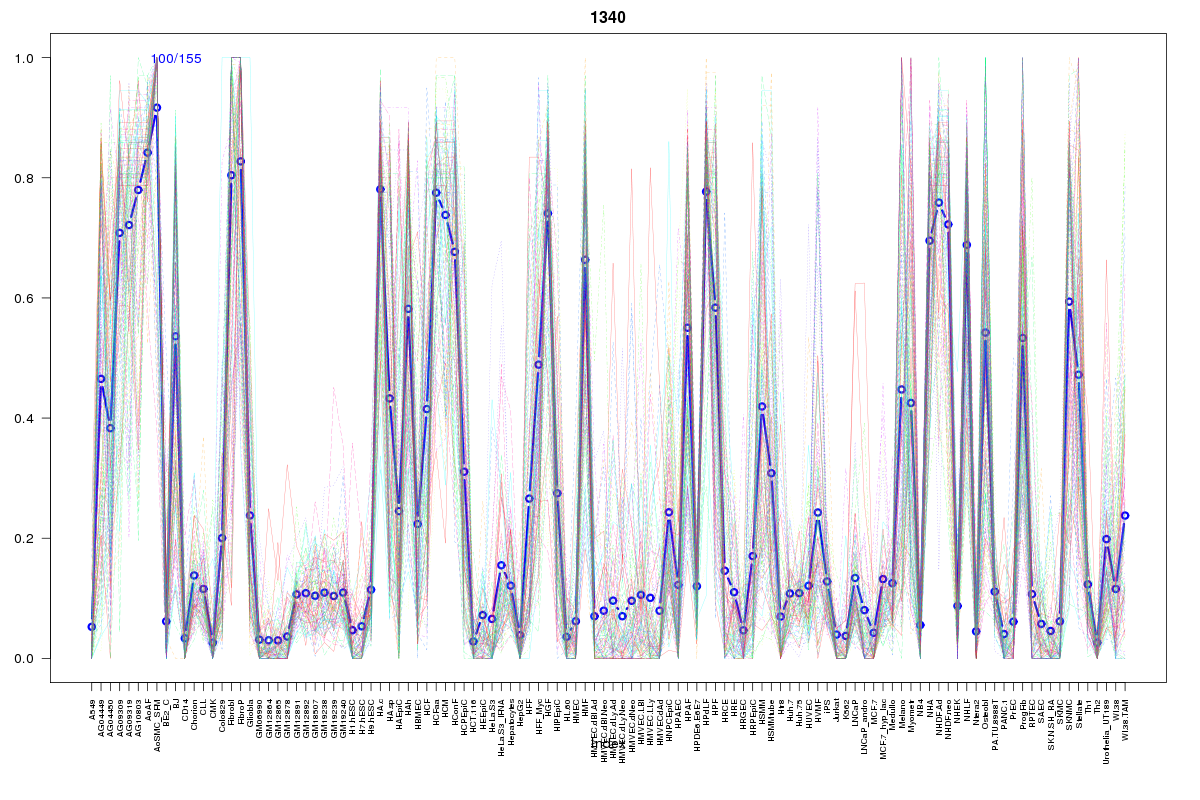 | 1340 | 1 |
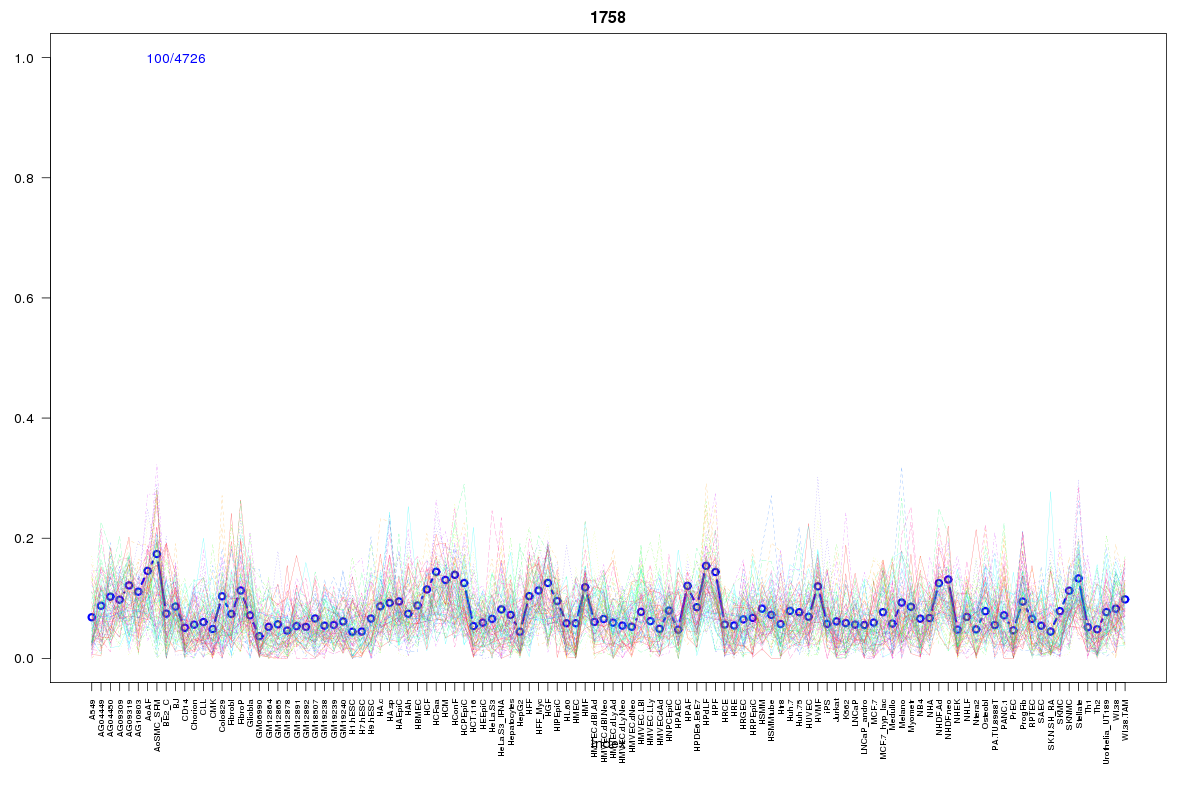 | 1758 | 1 |
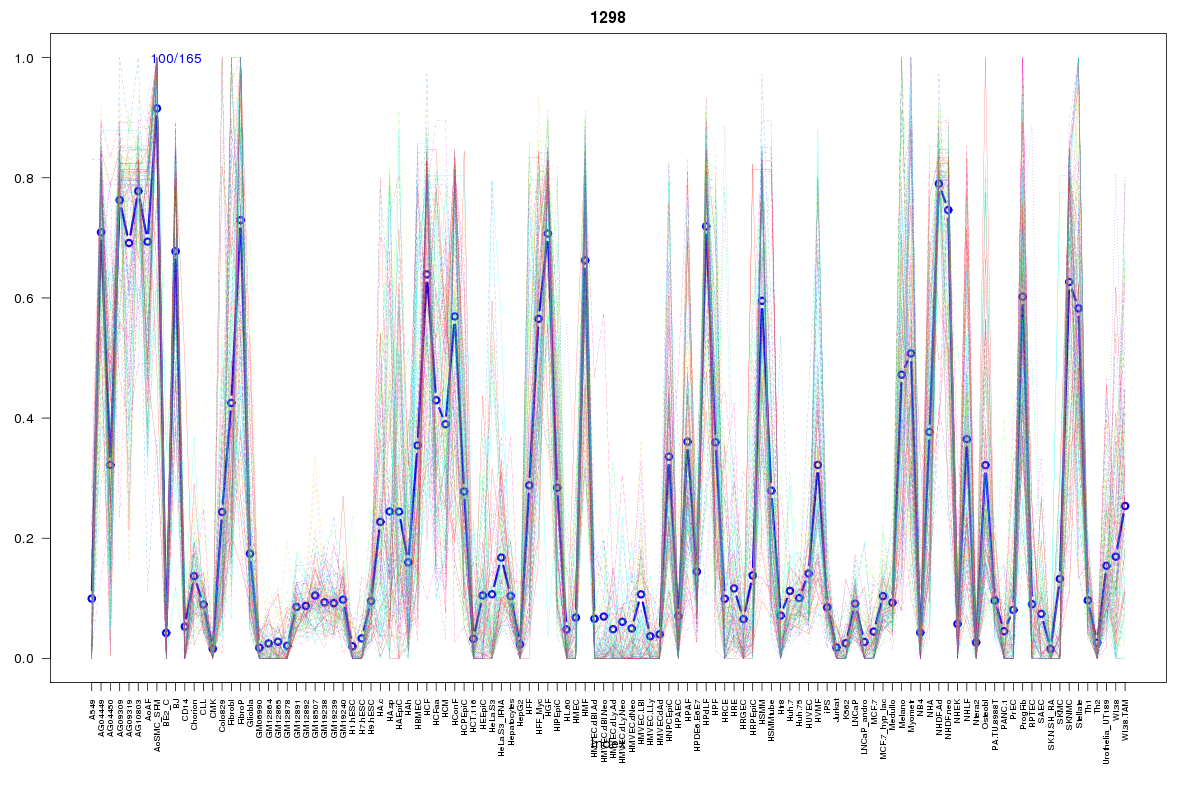 | 1298 | 1 |
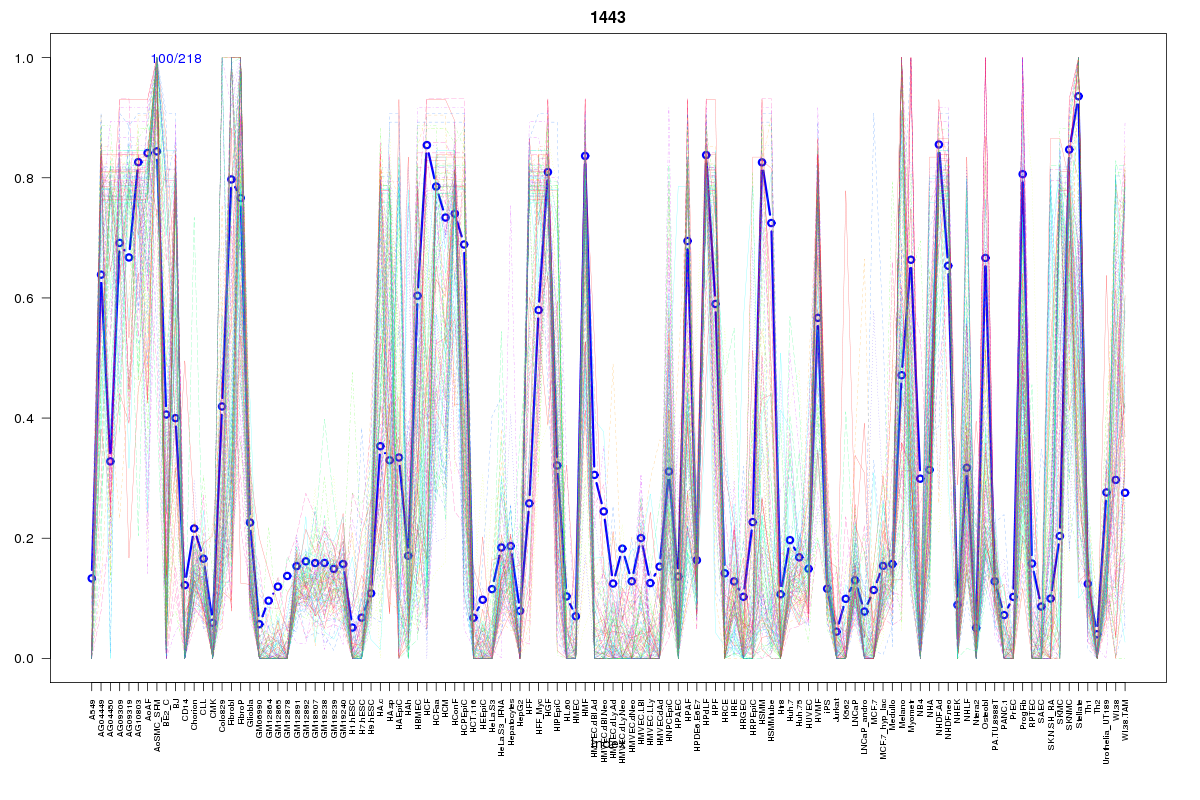 | 1443 | 1 |
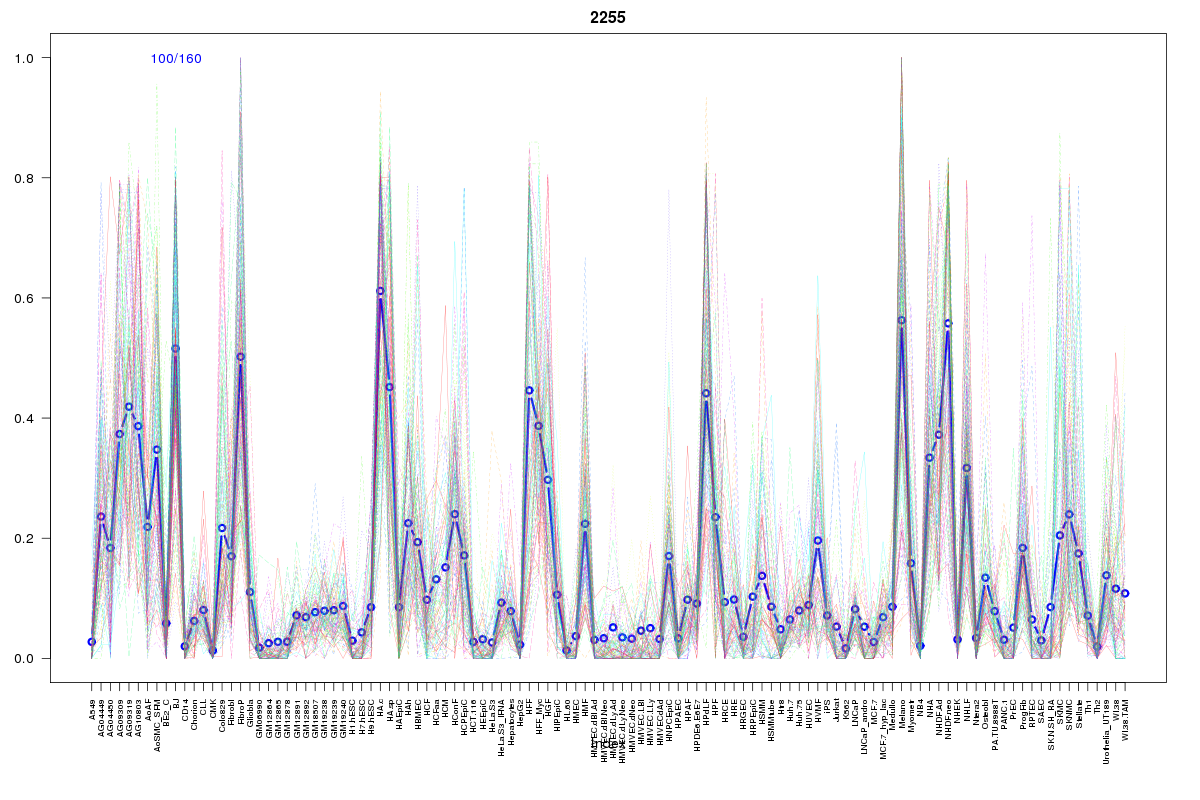 | 2255 | 1 |
 | 1345 | 1 |
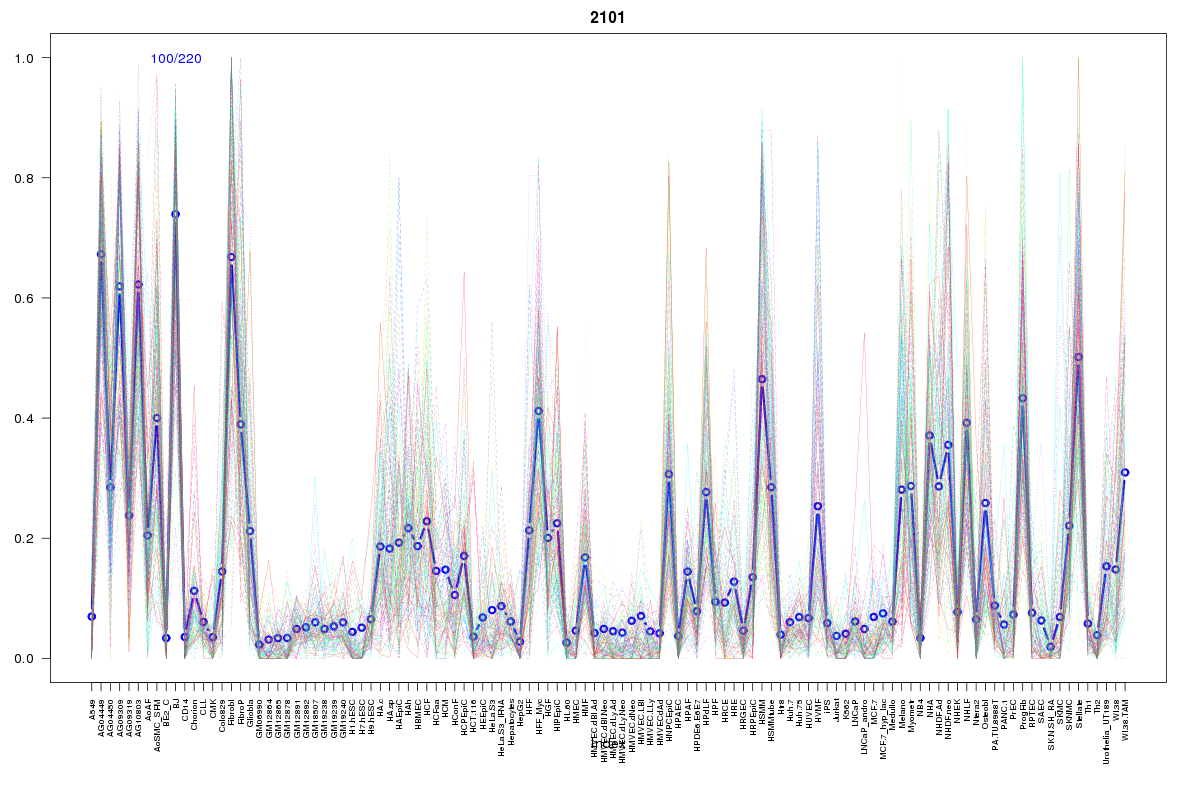 | 2101 | 1 |
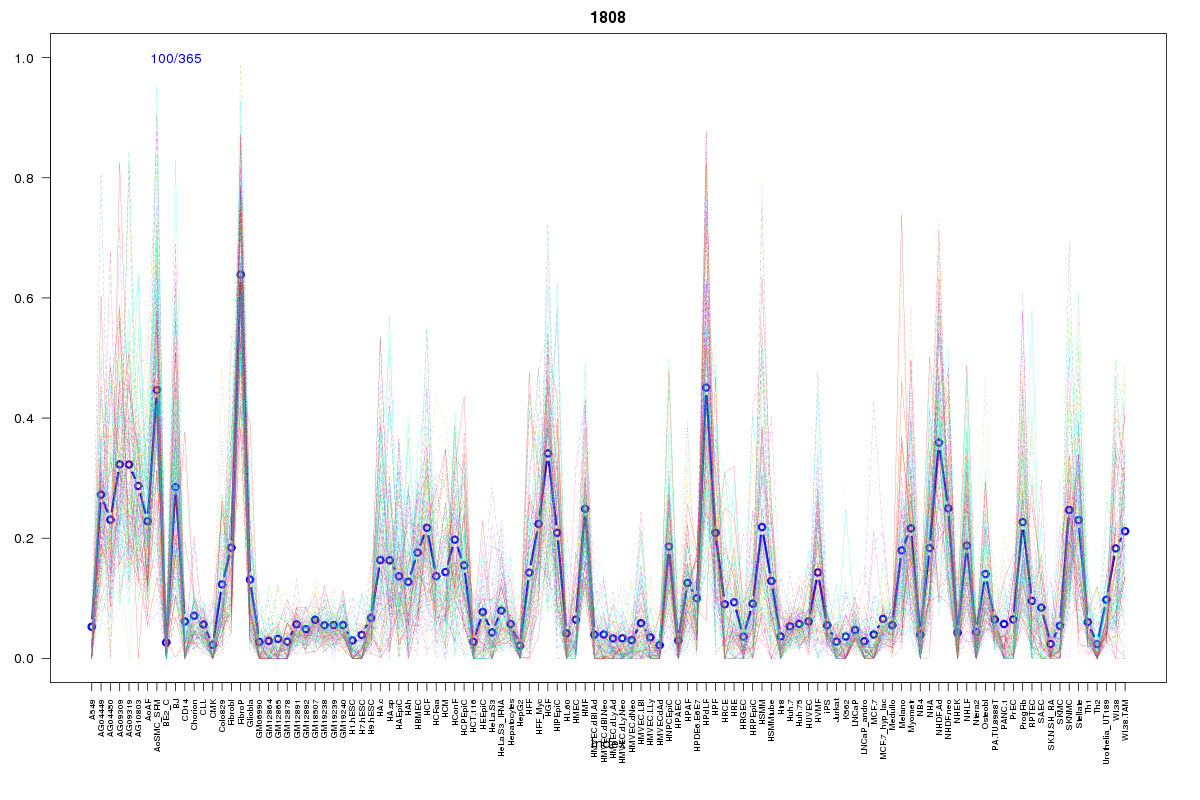 | 1808 | 1 |
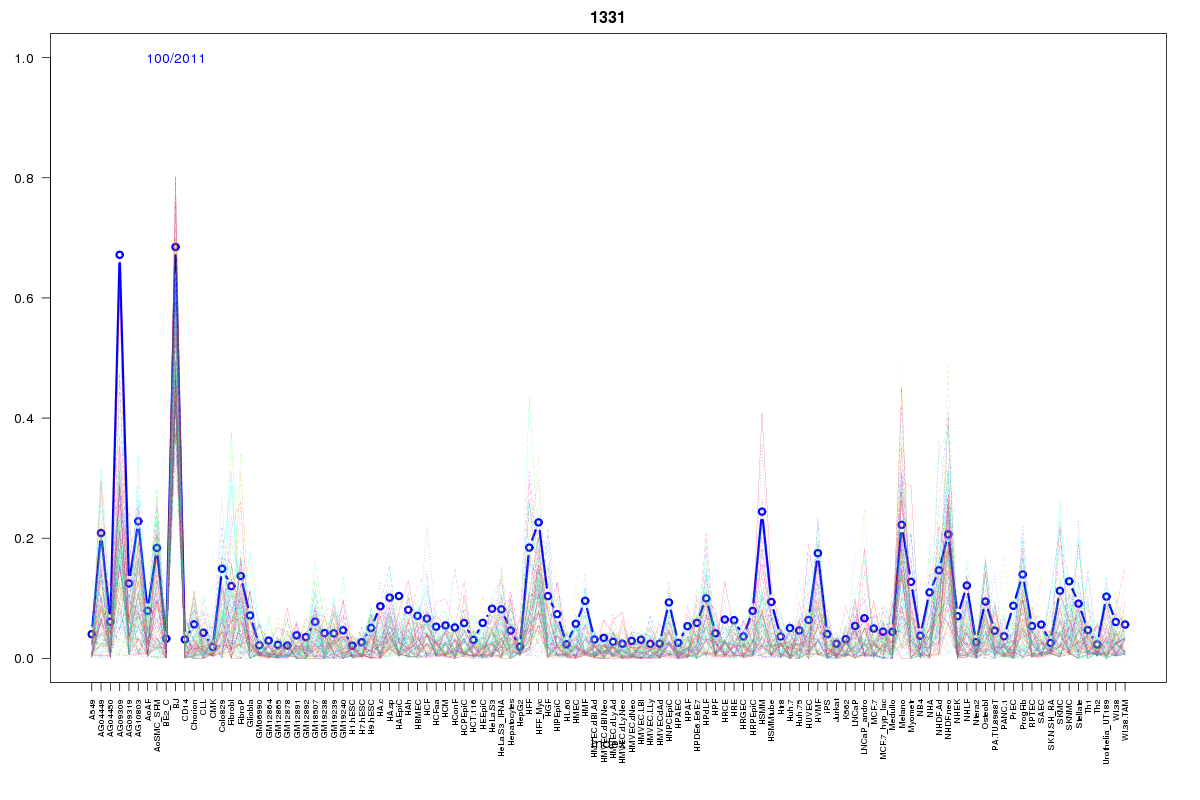 | 1331 | 1 |
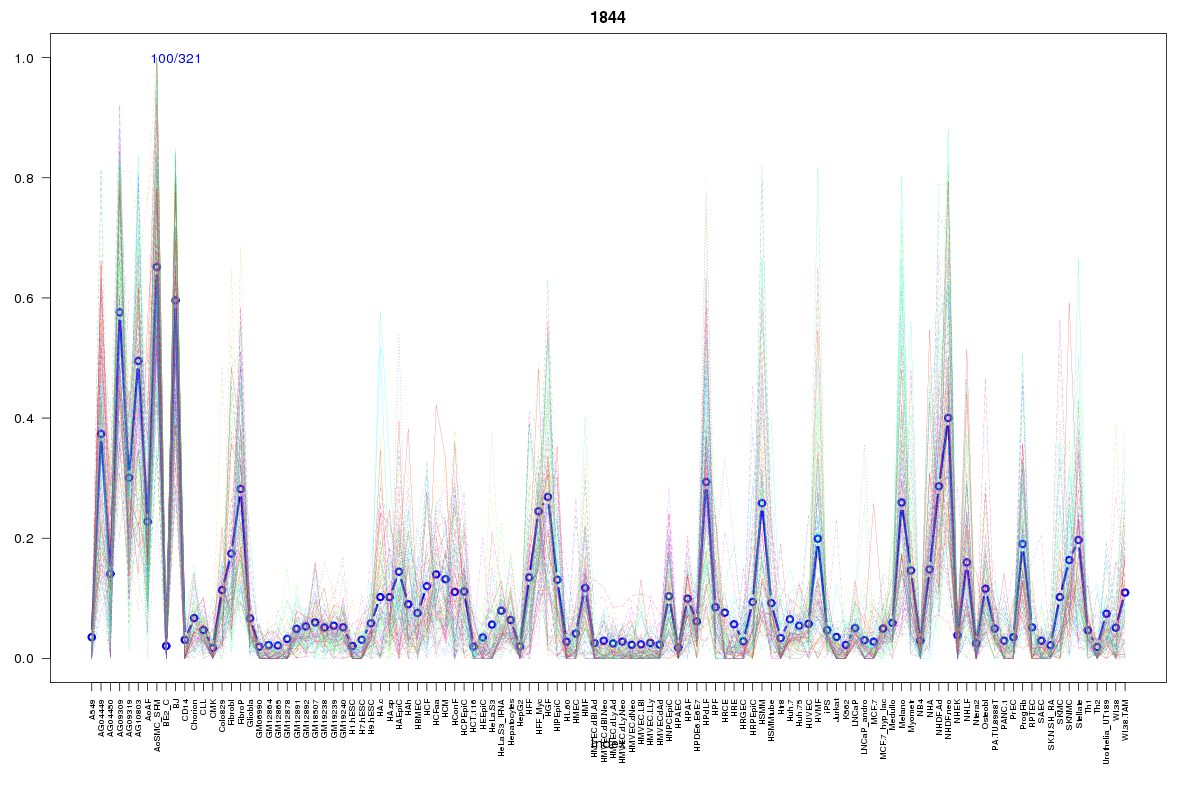 | 1844 | 1 |
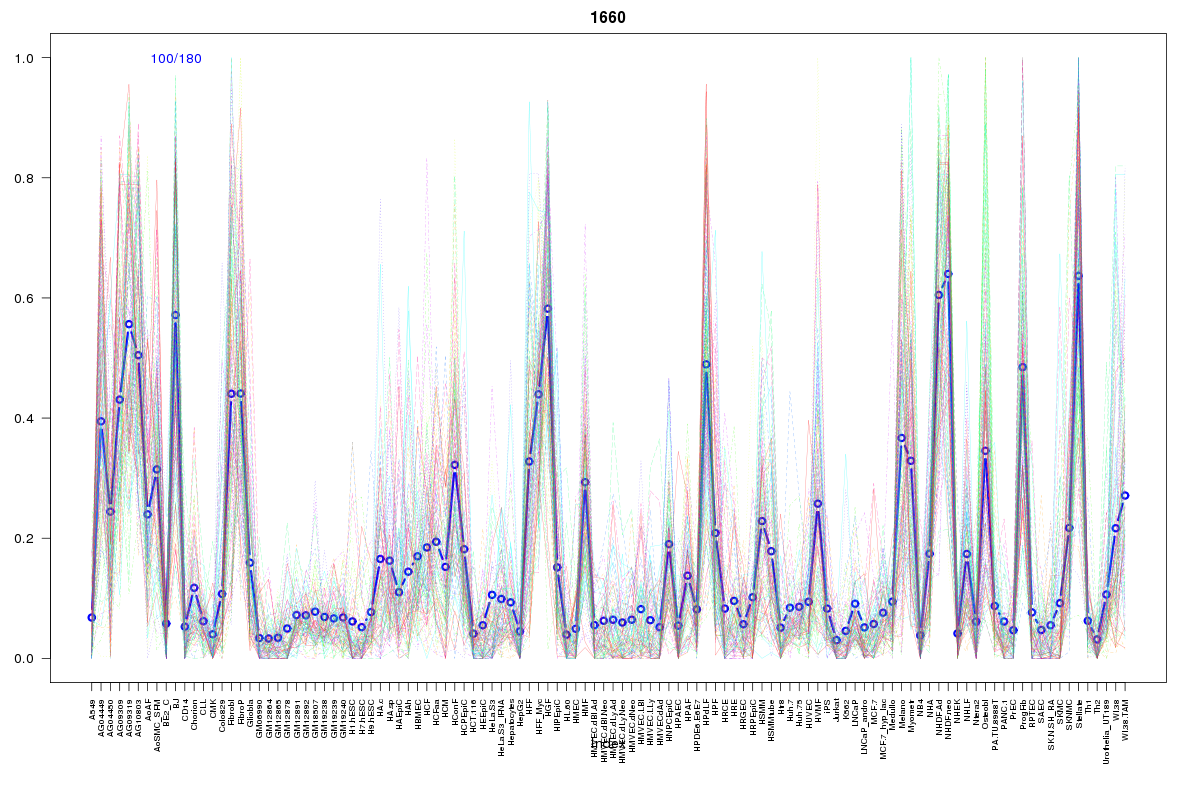 | 1660 | 1 |
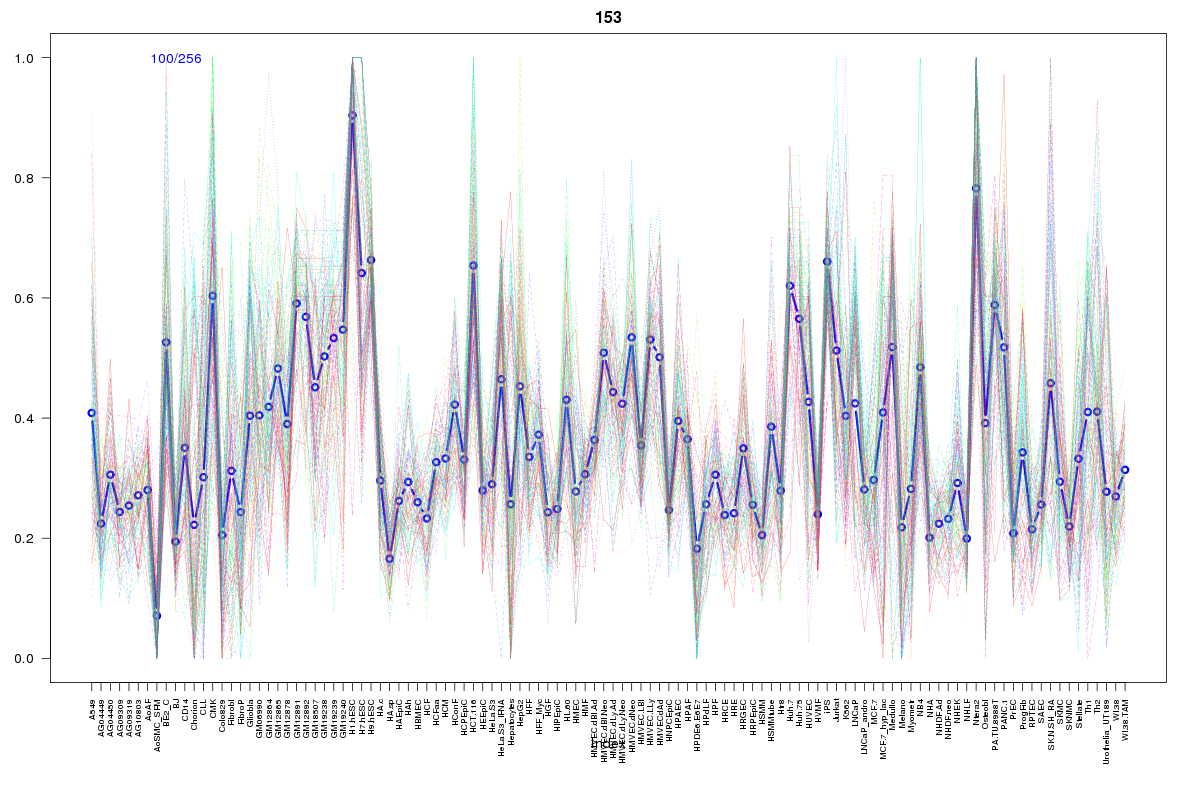 | 153 | 1 |
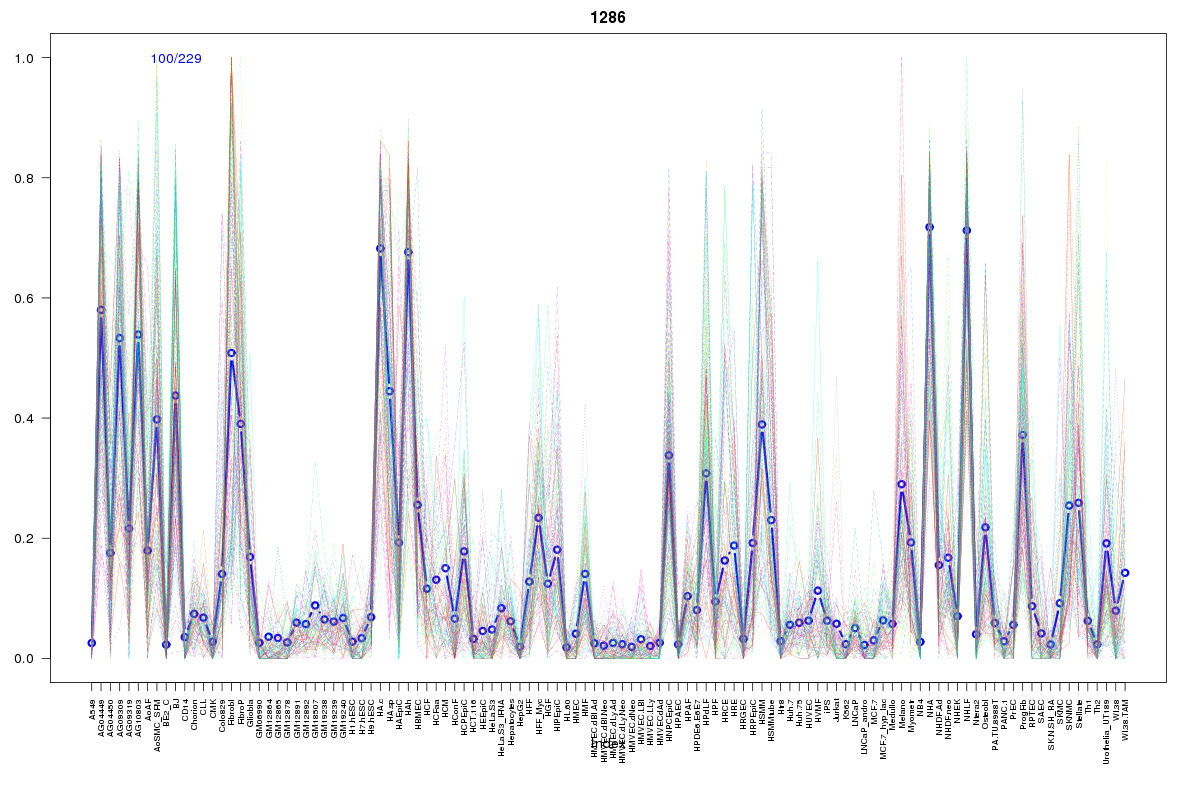 | 1286 | 1 |
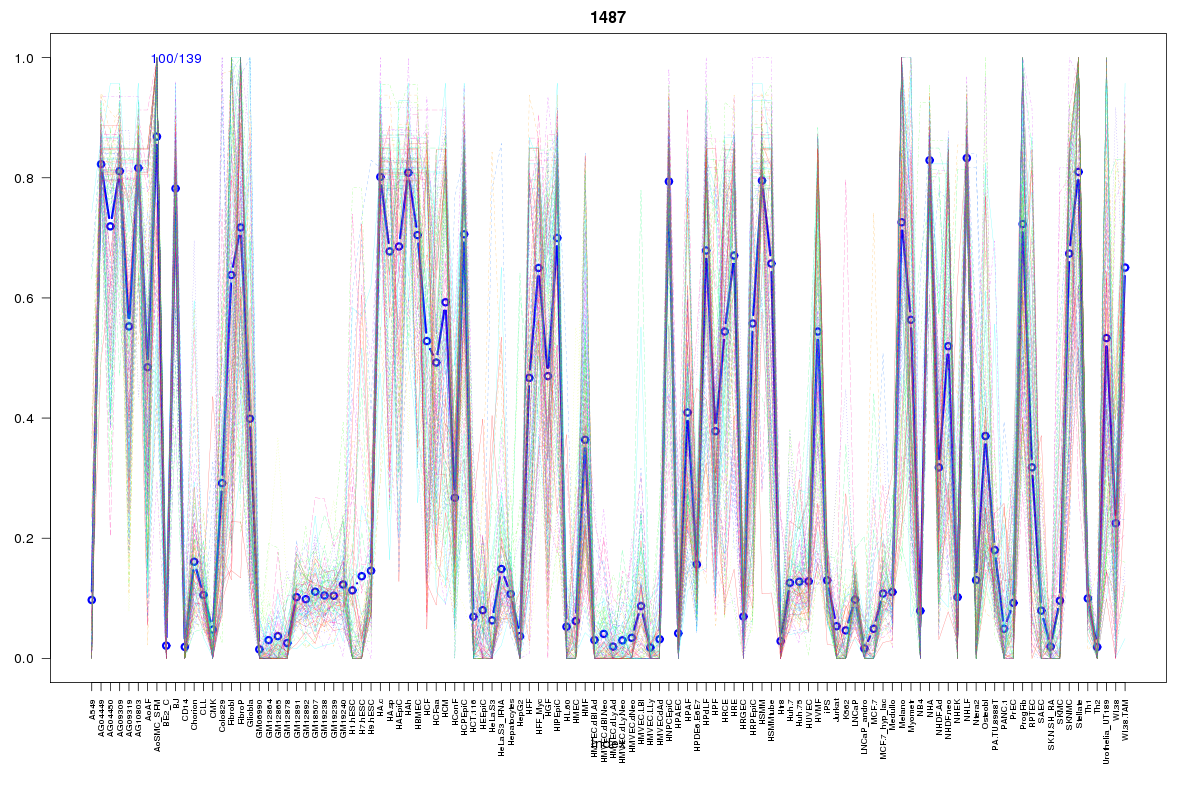 | 1487 | 1 |
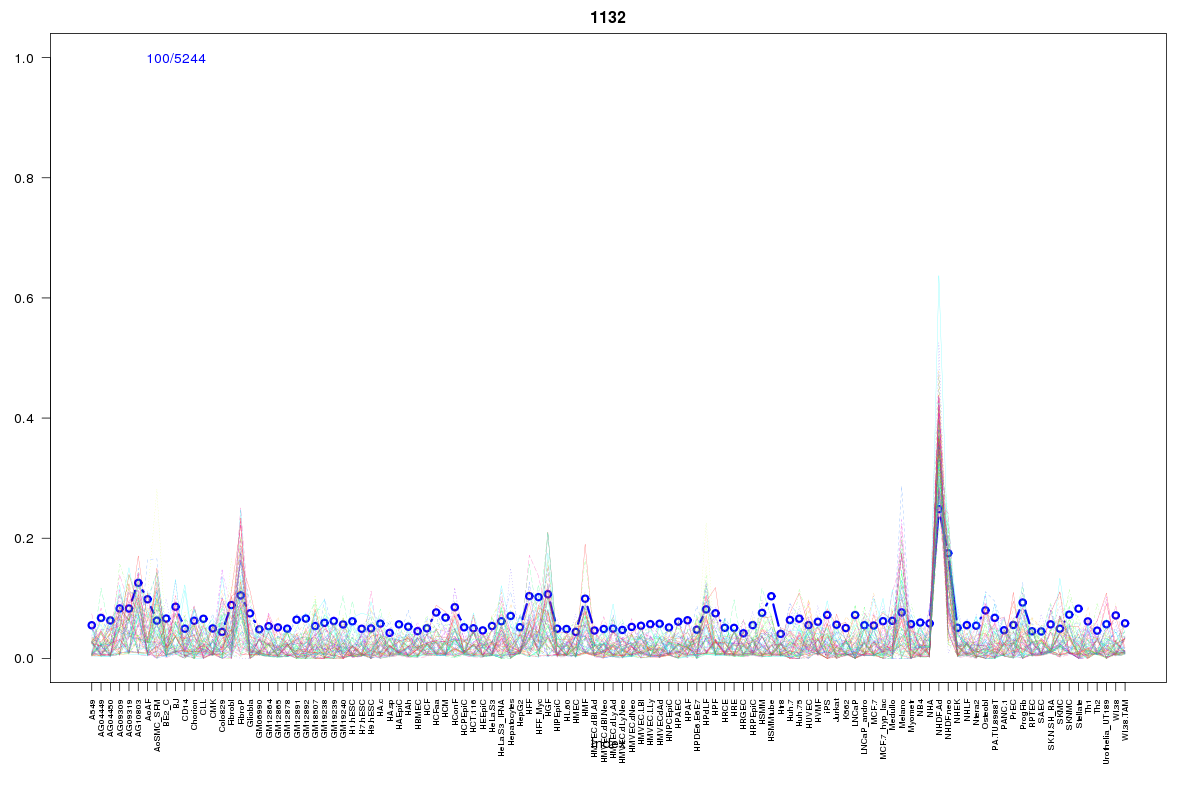 | 1132 | 1 |
 | 2355 | 1 |
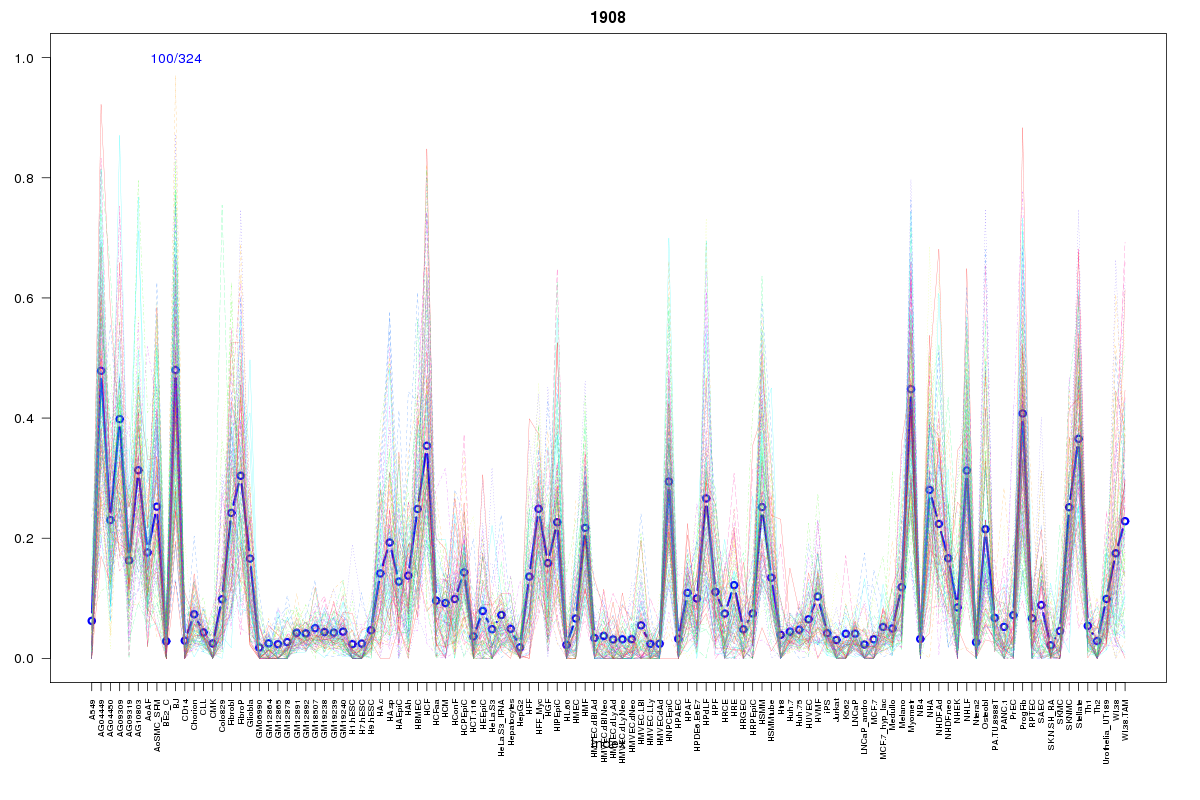 | 1908 | 1 |
 | 1595 | 1 |
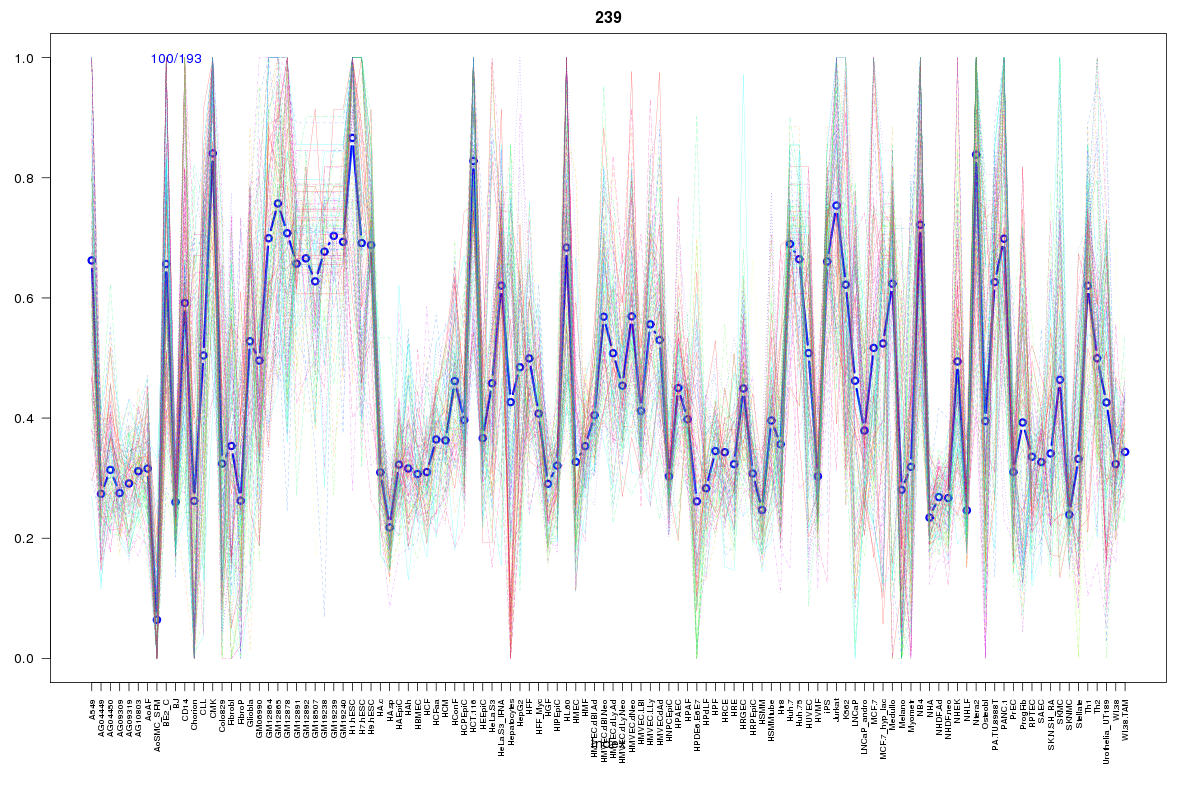 | 239 | 1 |
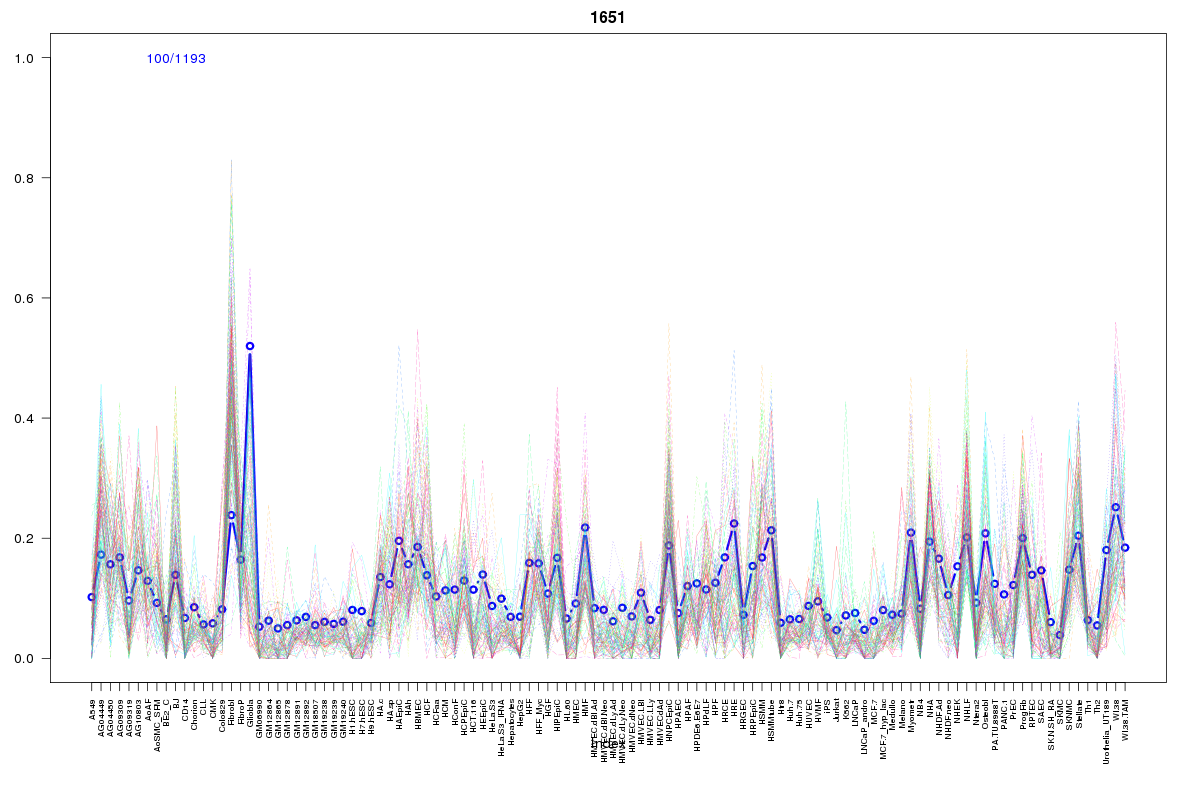 | 1651 | 1 |
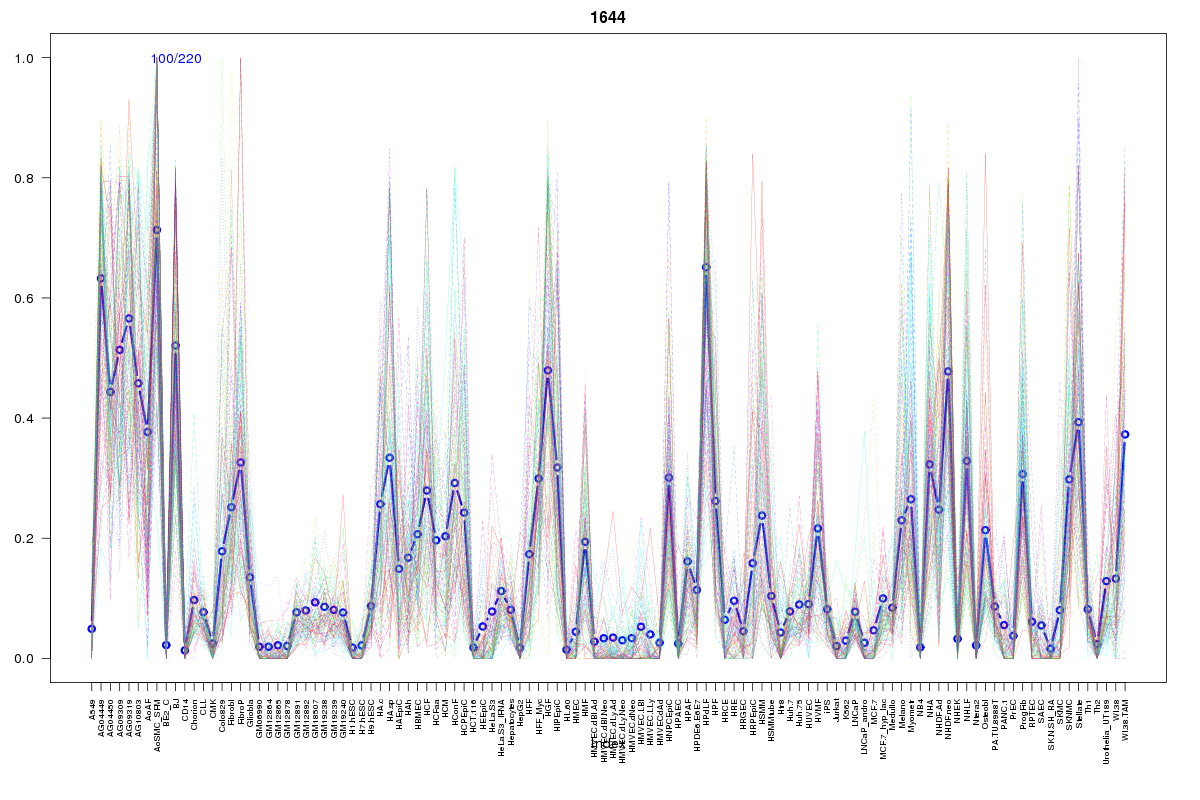 | 1644 | 1 |
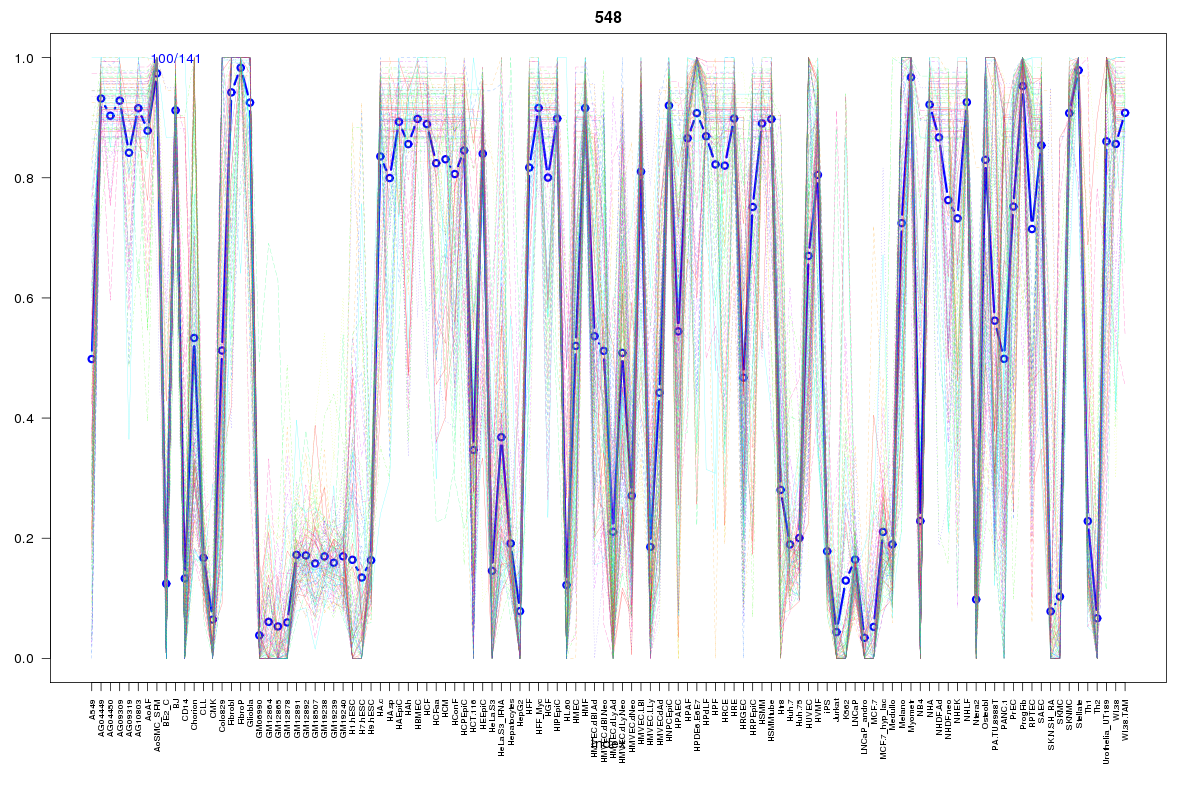 | 548 | 1 |
 | 1738 | 1 |
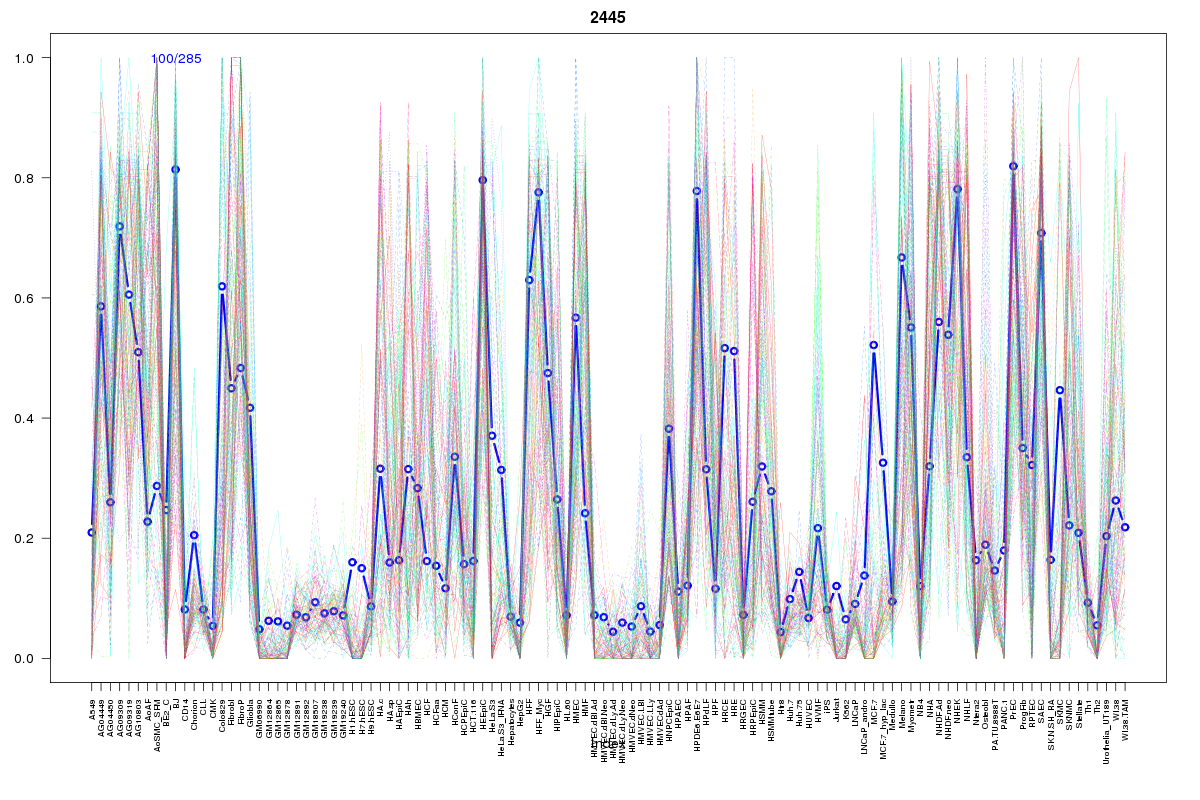 | 2445 | 1 |
 | 1636 | 1 |
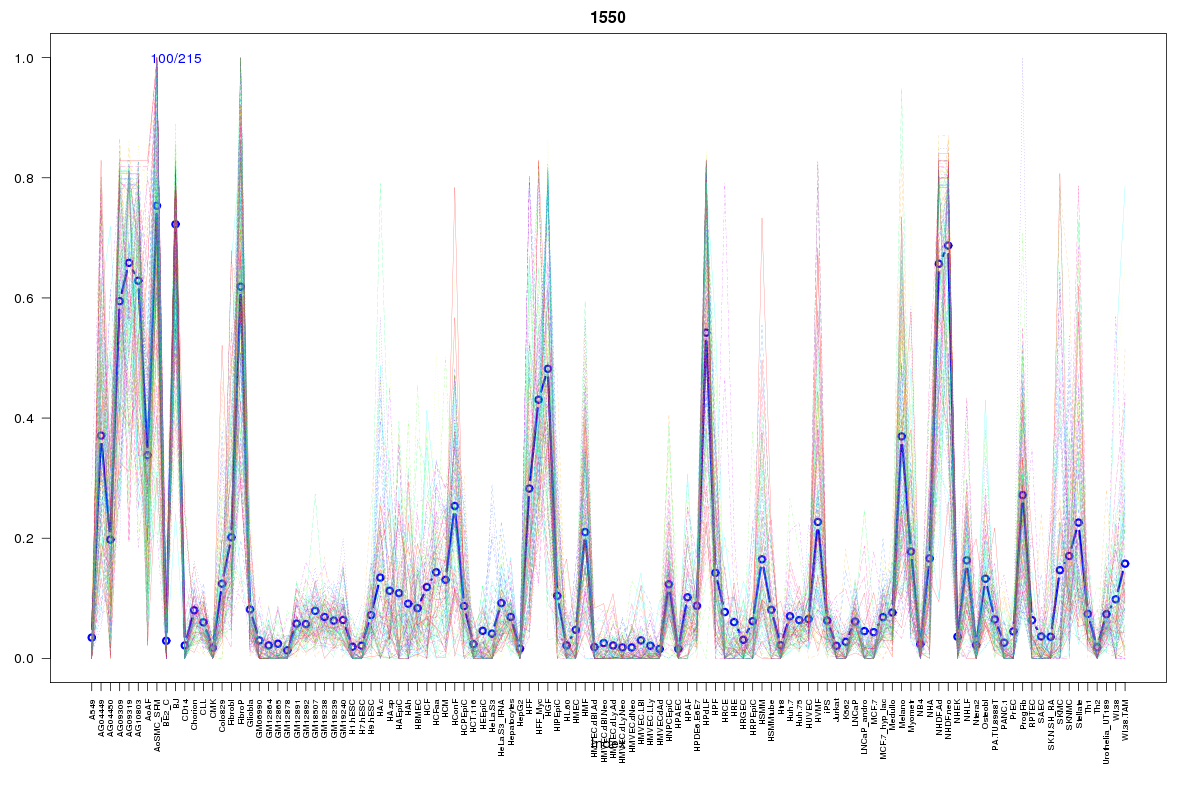 | 1550 | 1 |
 | 600 | 1 |
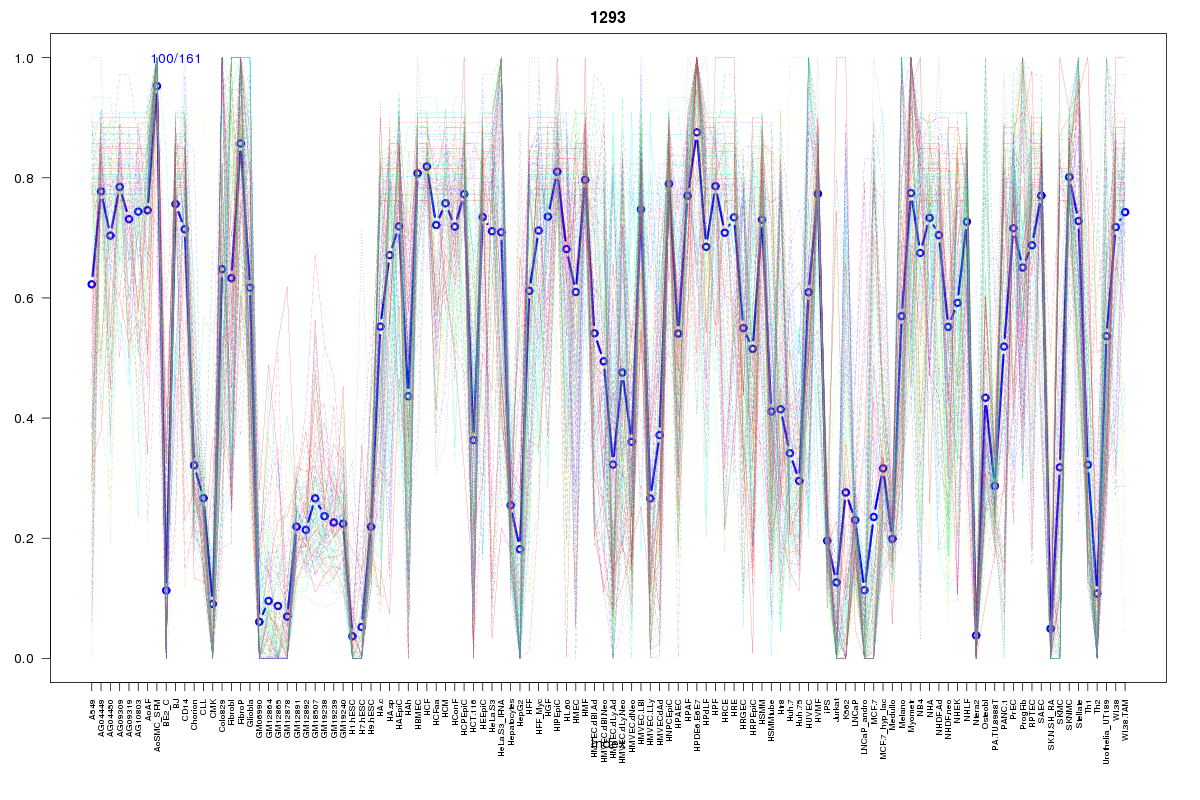 | 1293 | 1 |
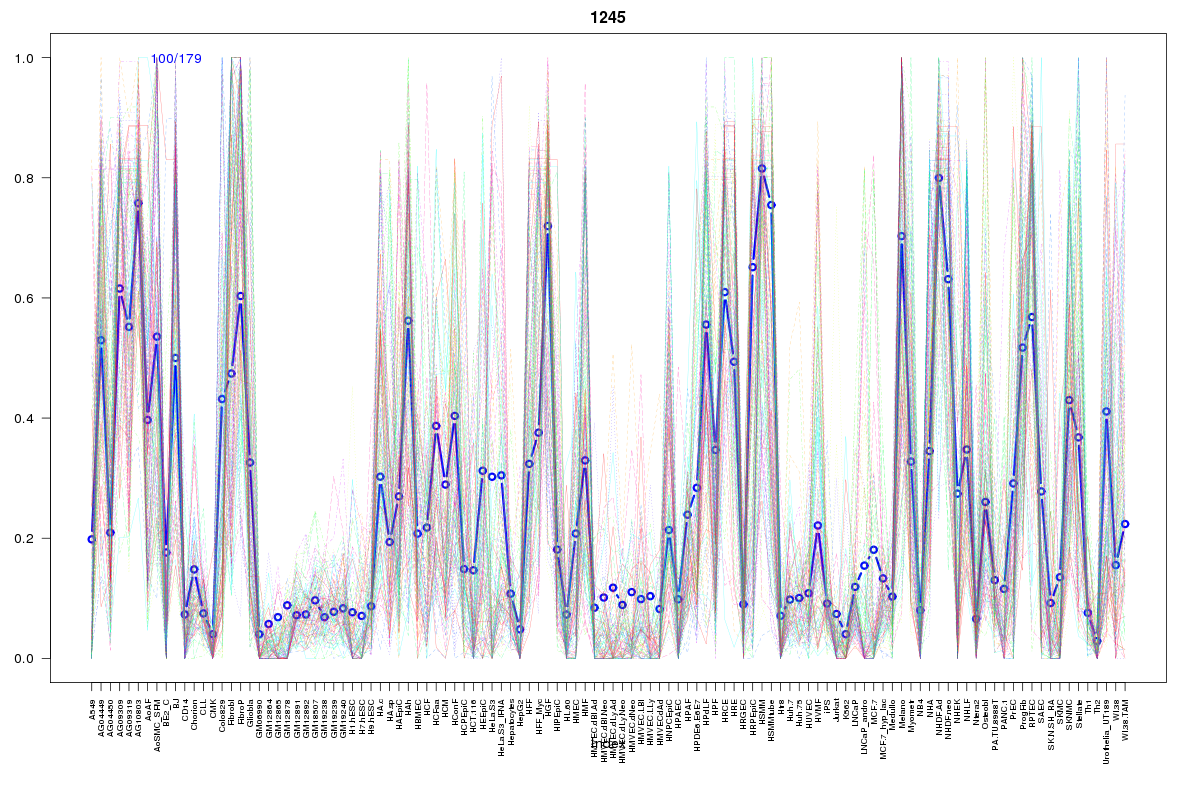 | 1245 | 1 |
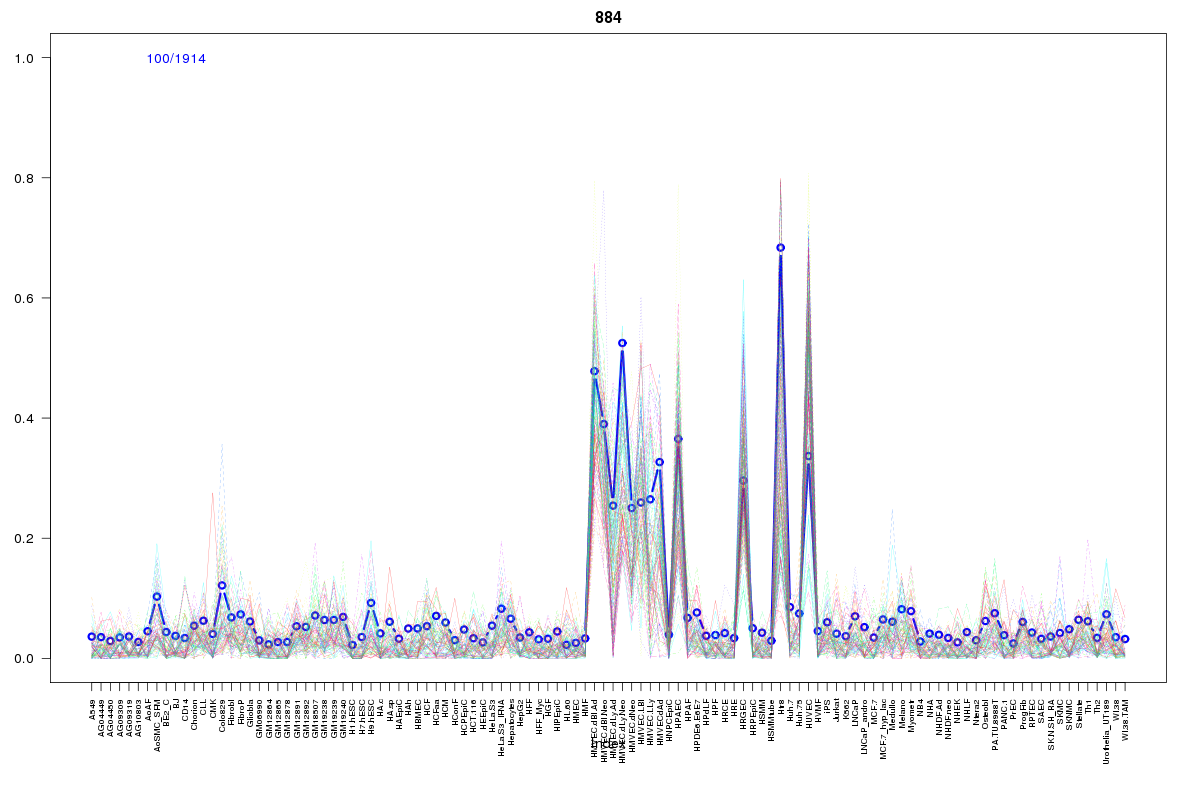 | 884 | 1 |
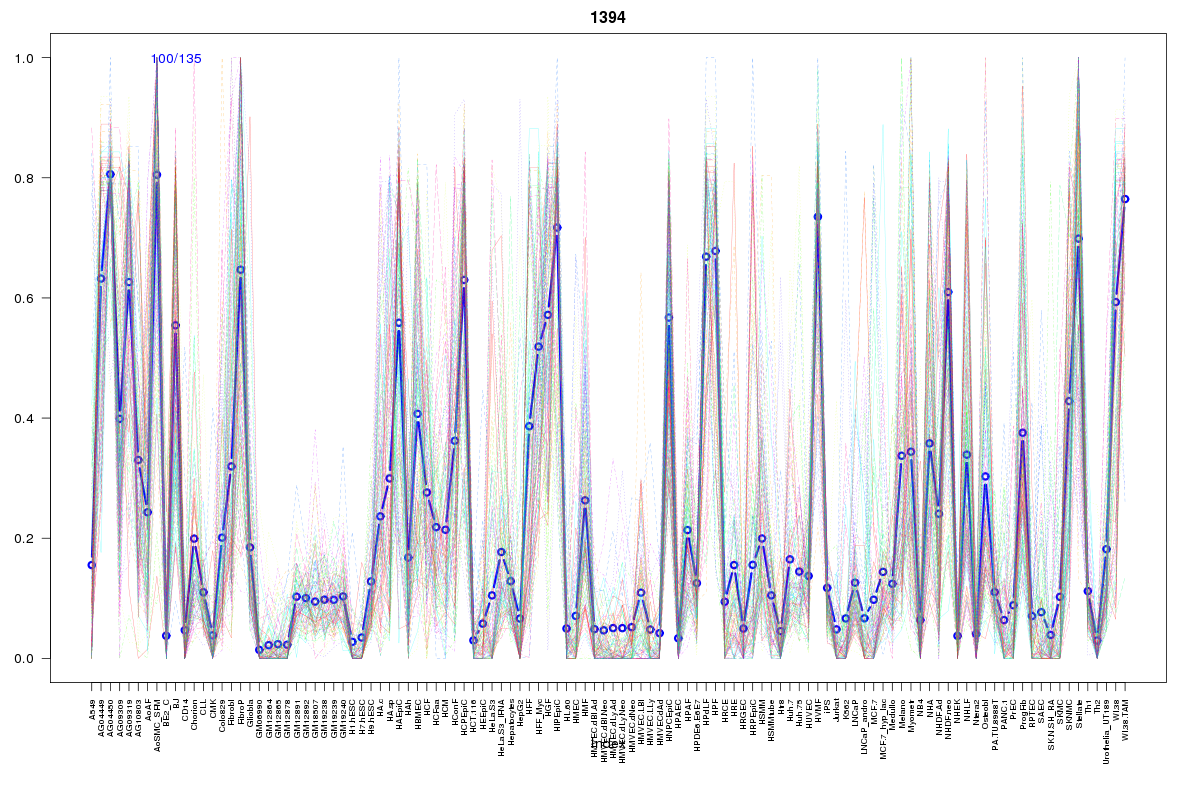 | 1394 | 1 |
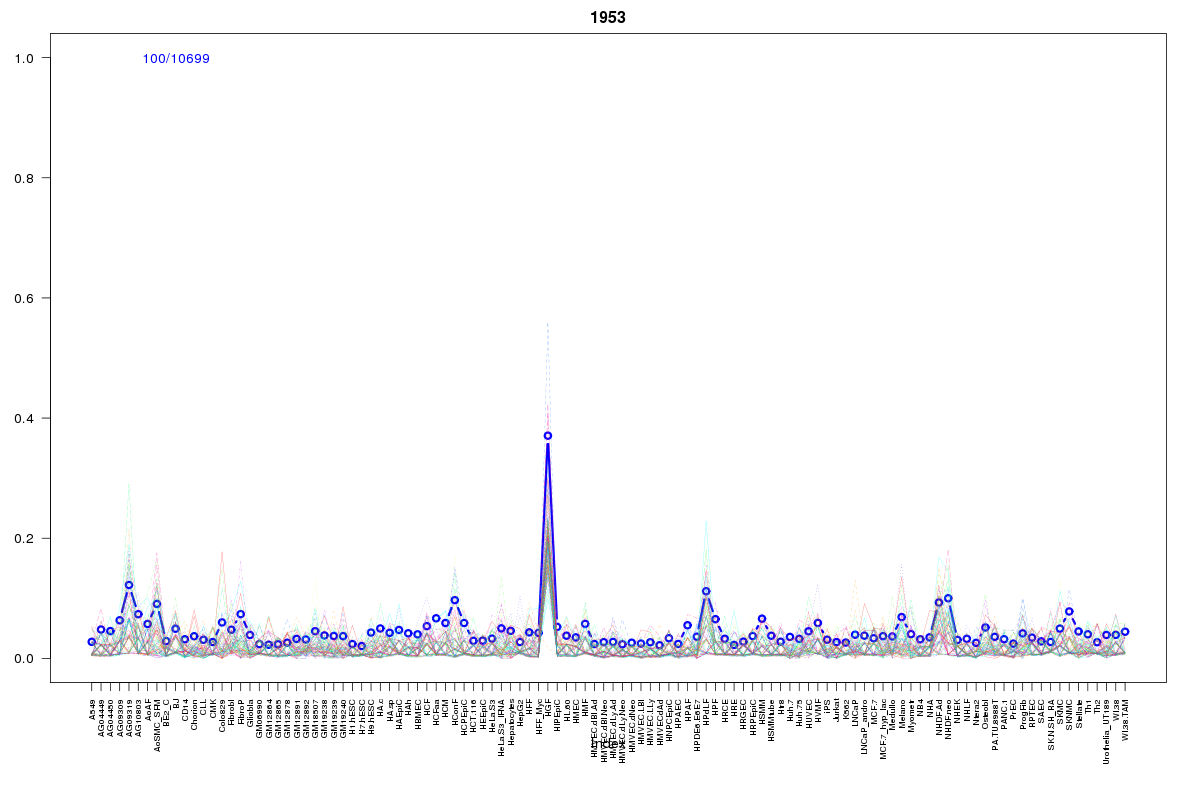 | 1953 | 1 |
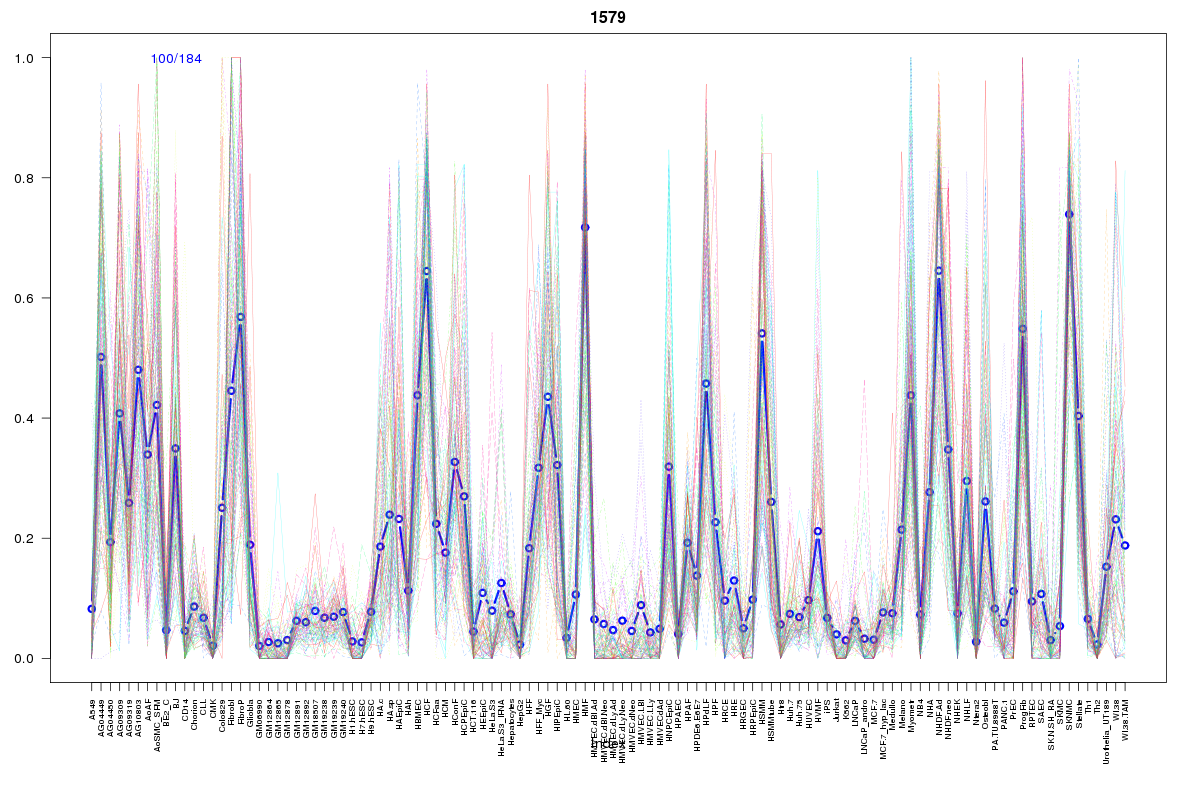 | 1579 | 1 |
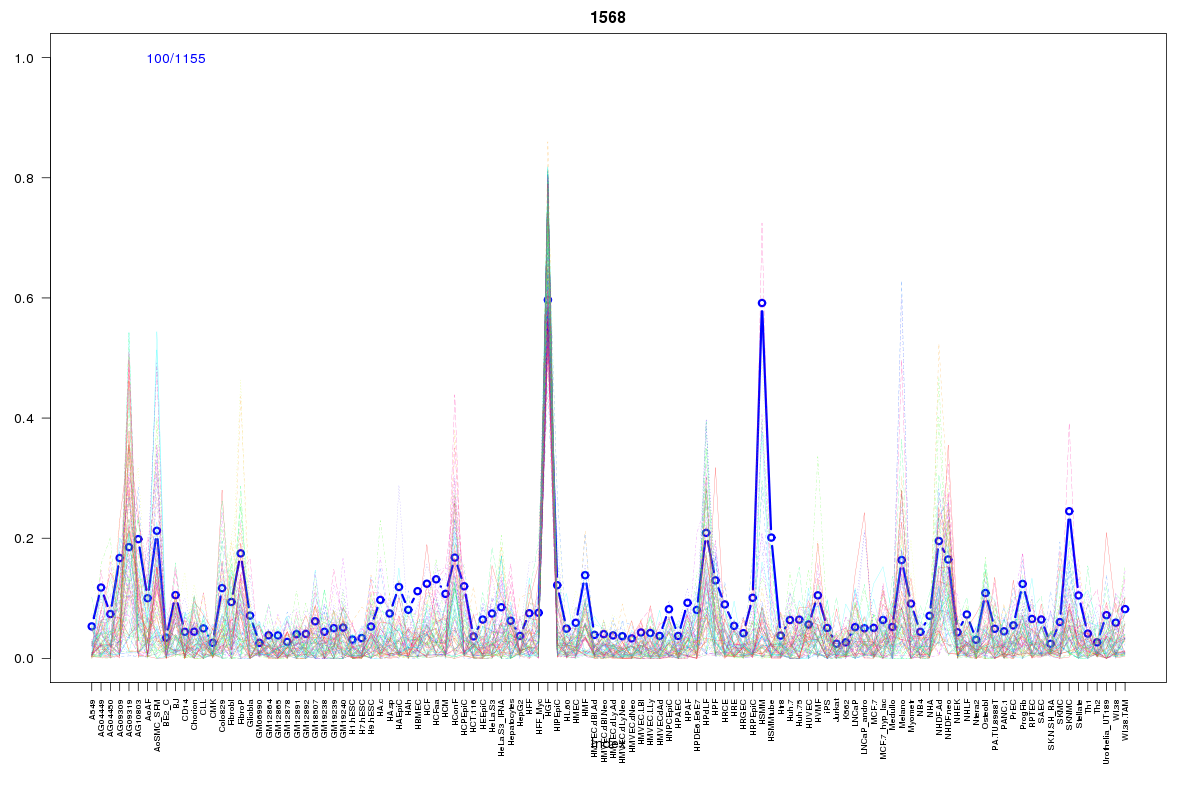 | 1568 | 1 |
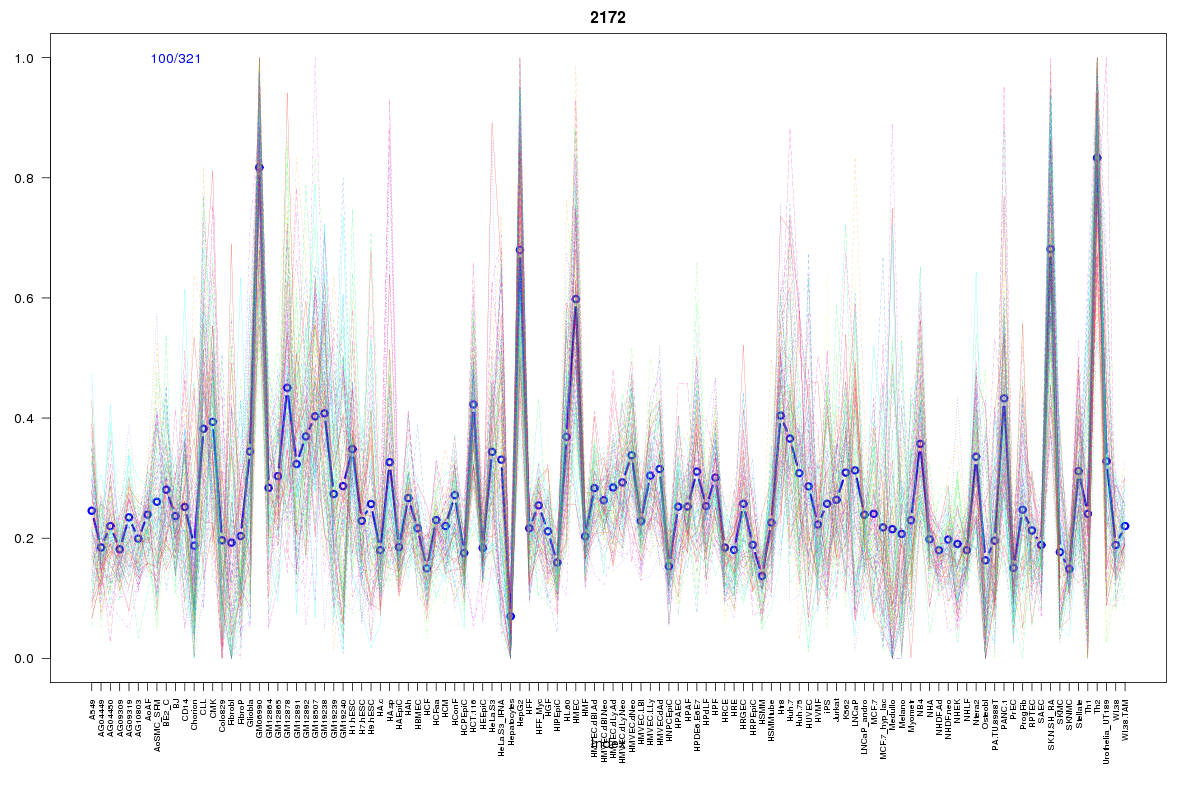 | 2172 | 1 |
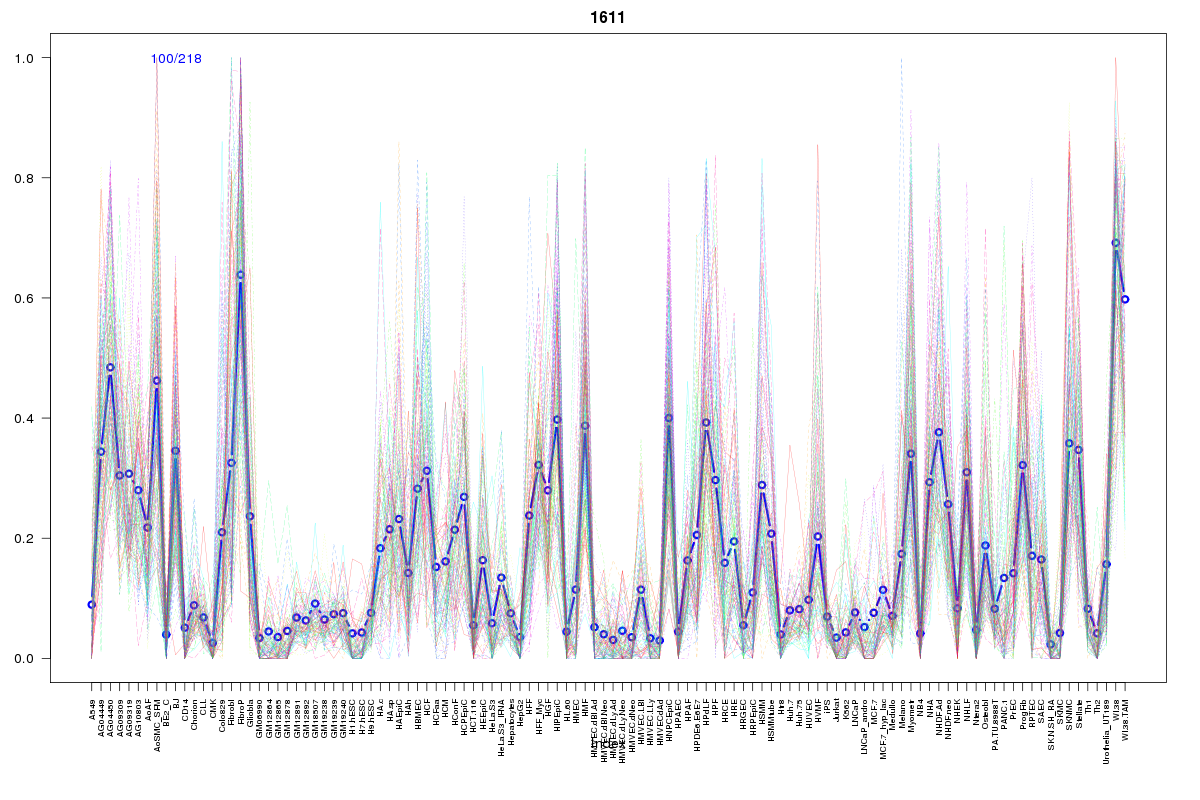 | 1611 | 1 |
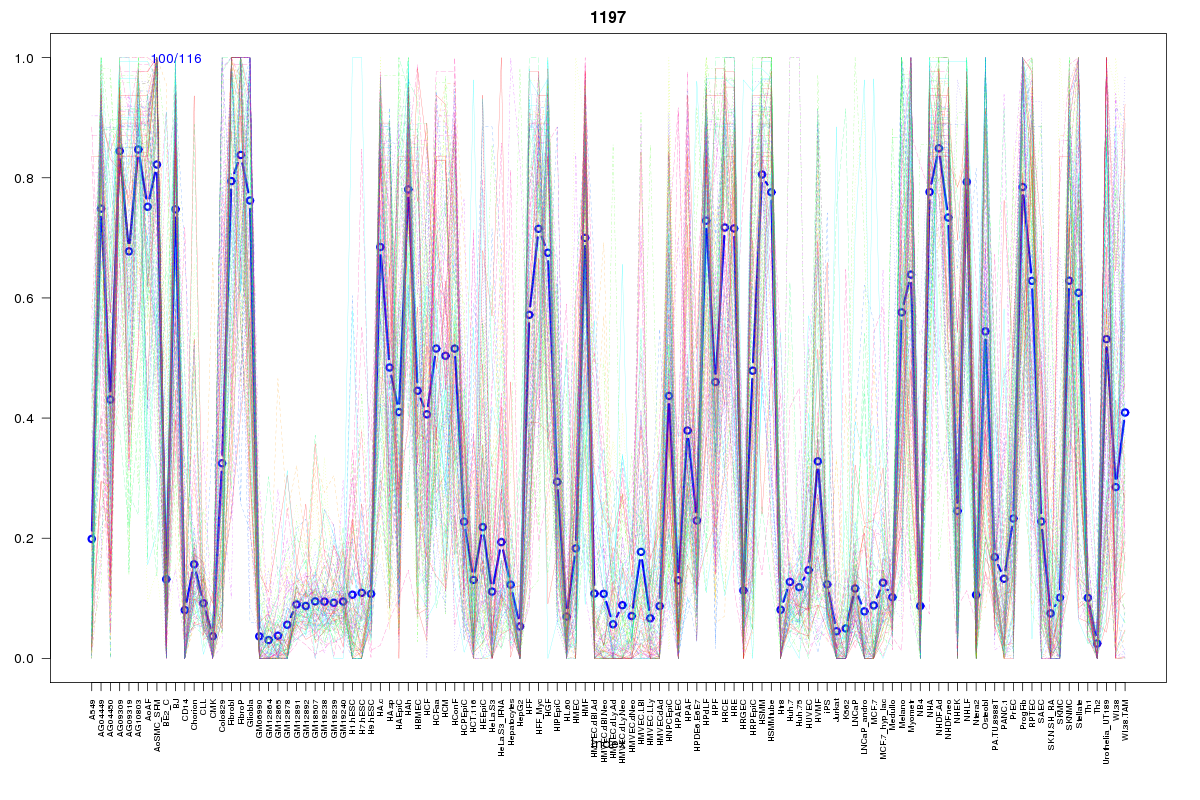 | 1197 | 1 |
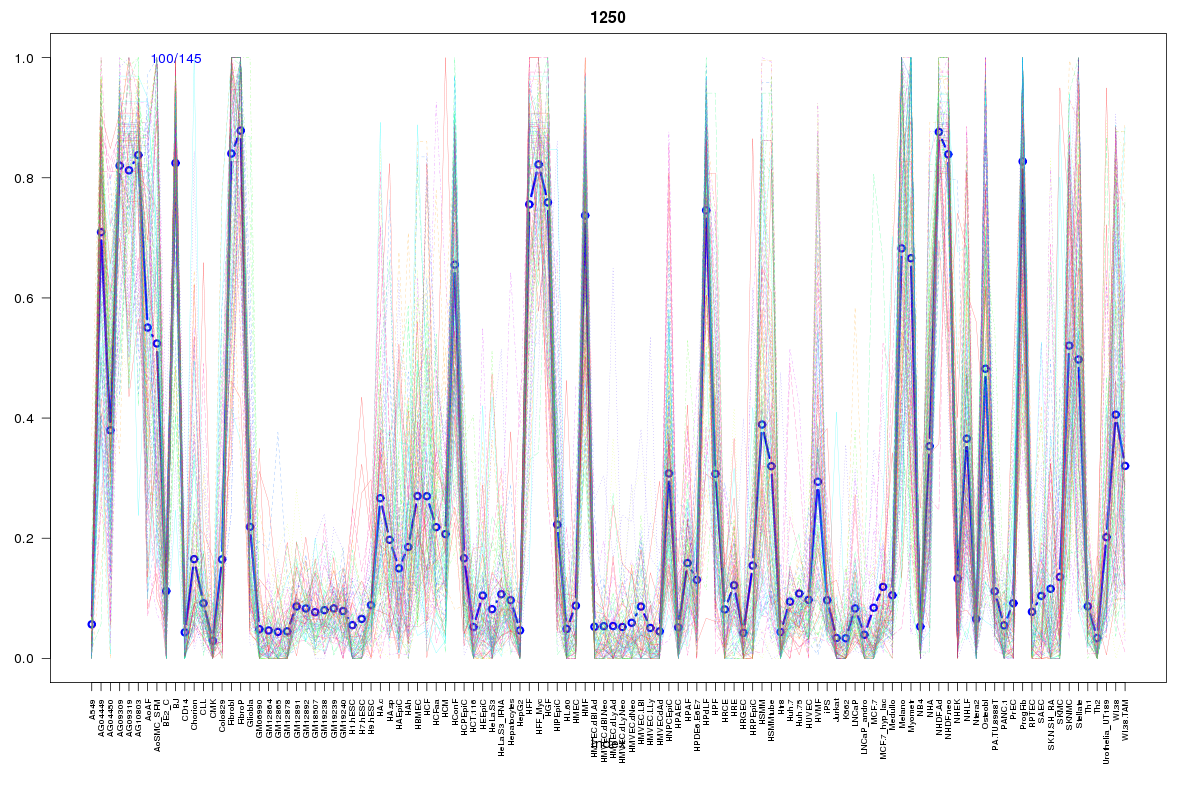 | 1250 | 1 |
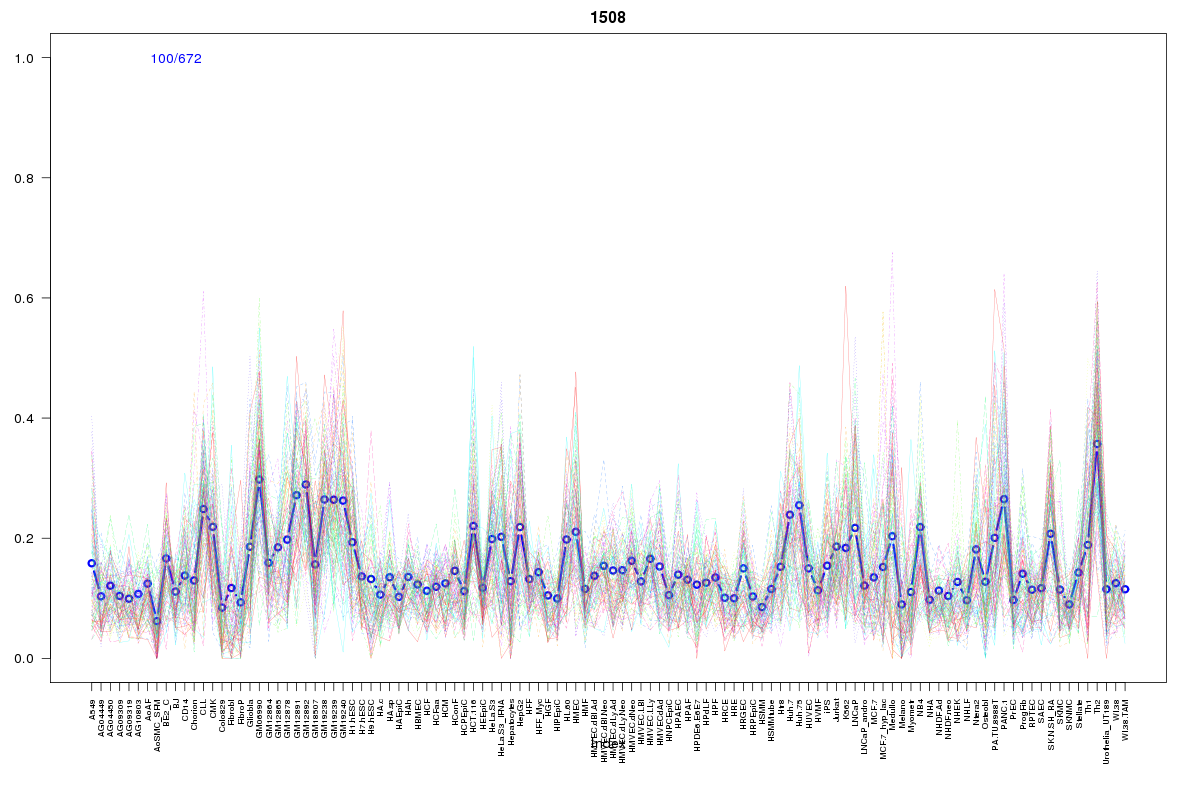 | 1508 | 1 |
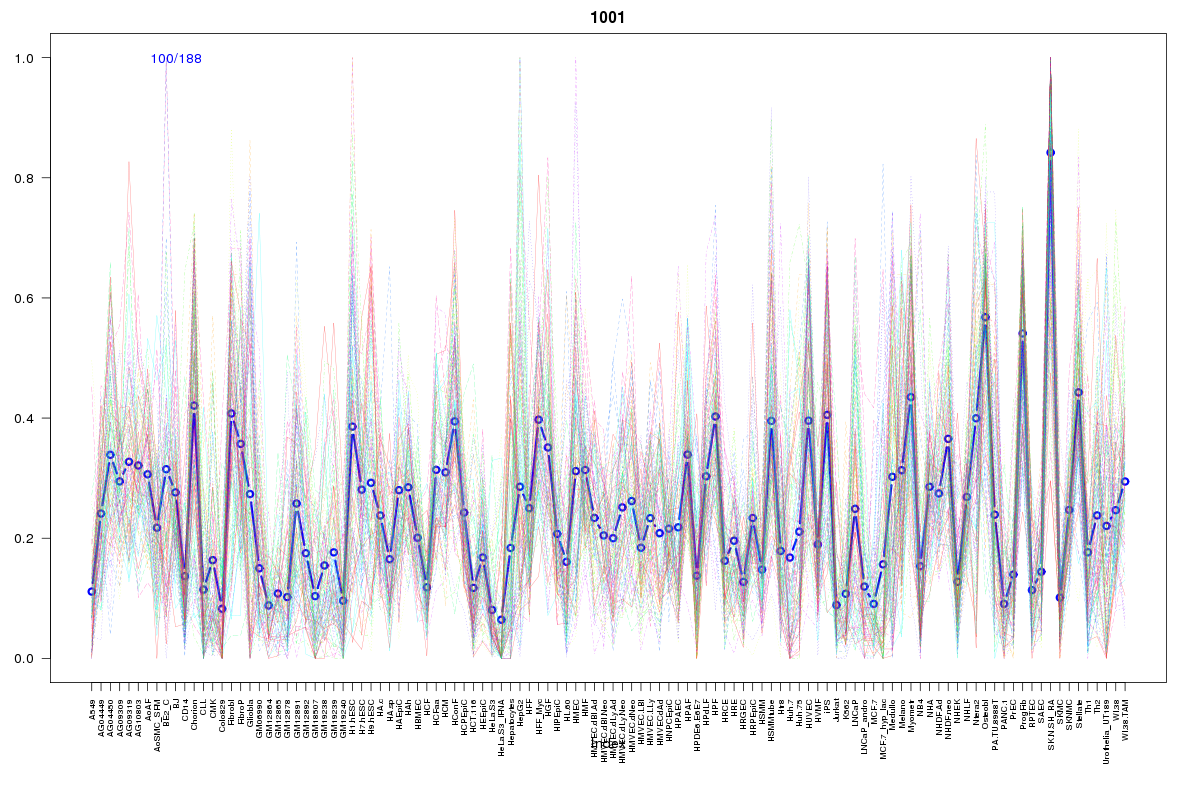 | 1001 | 1 |
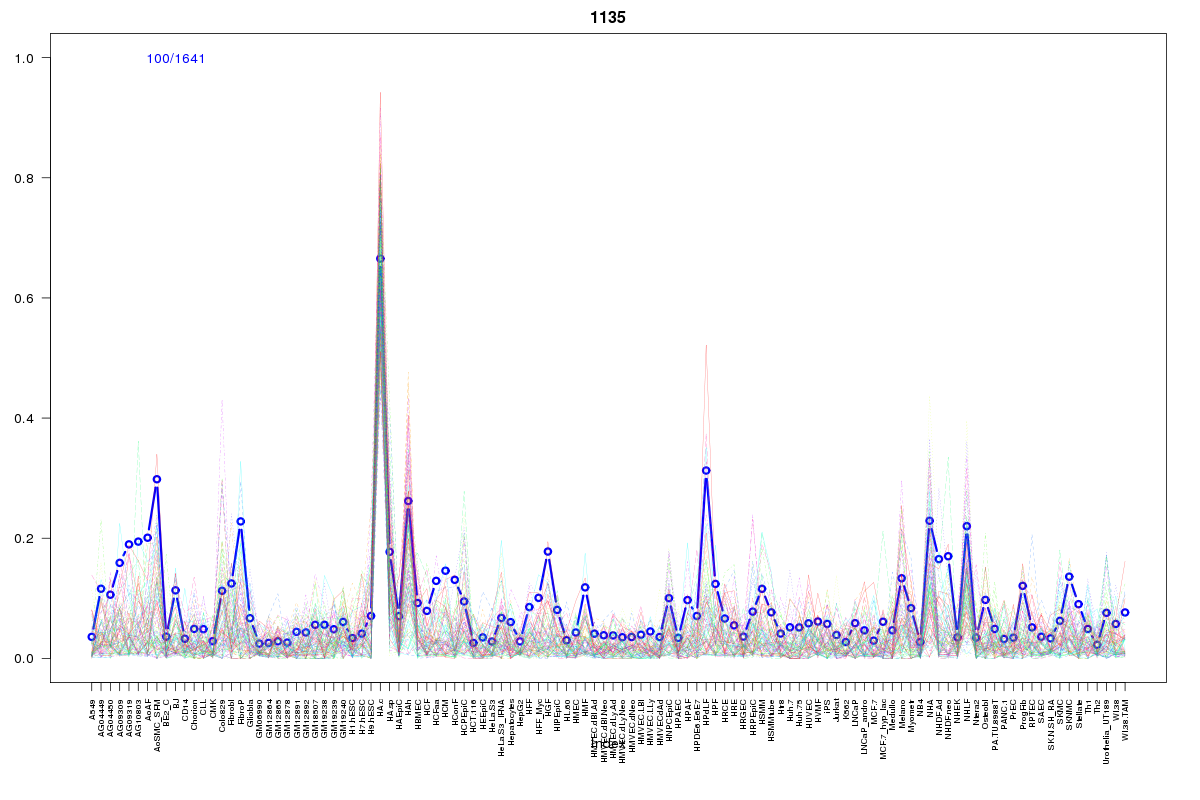 | 1135 | 1 |
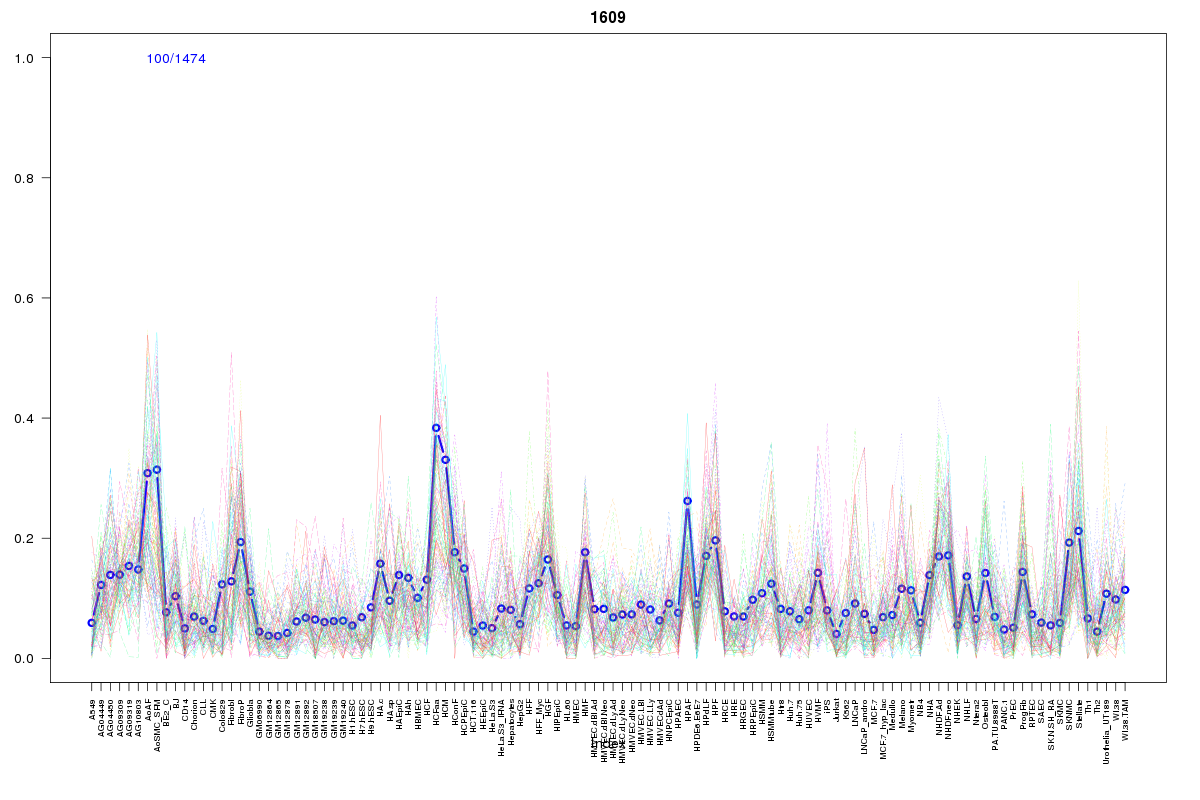 | 1609 | 1 |
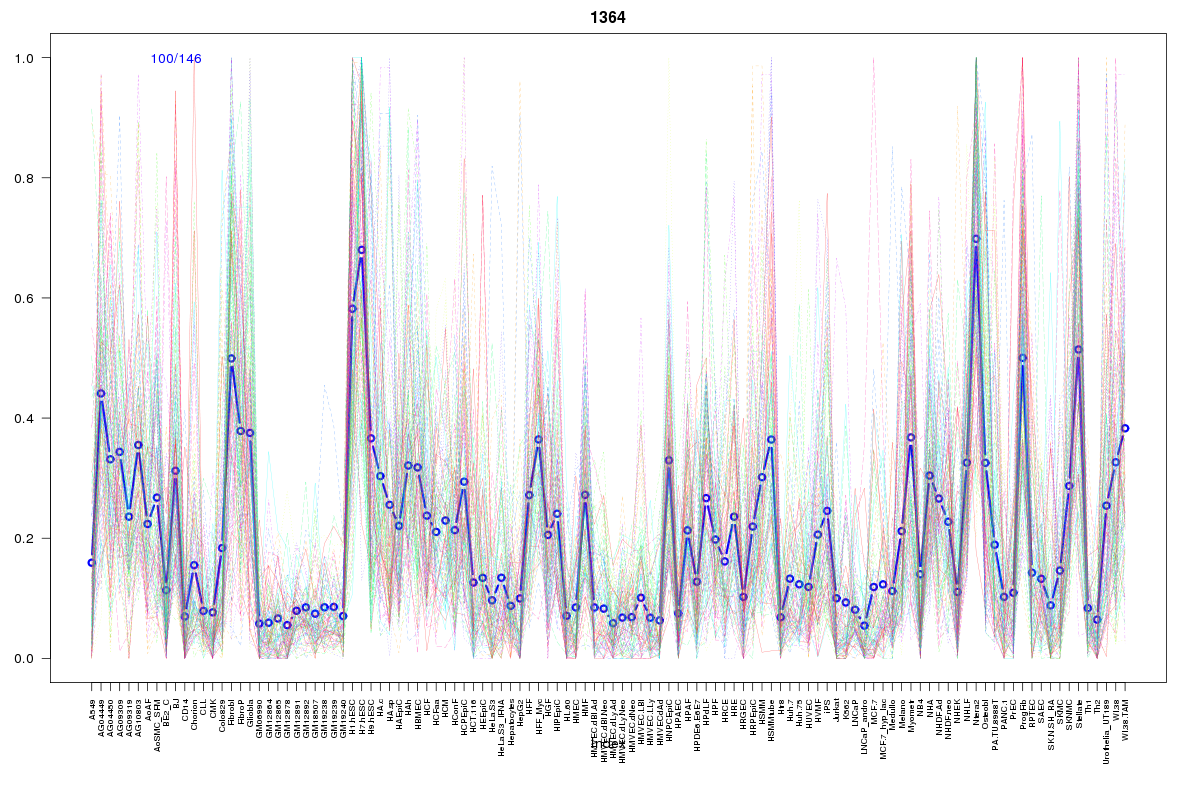 | 1364 | 1 |
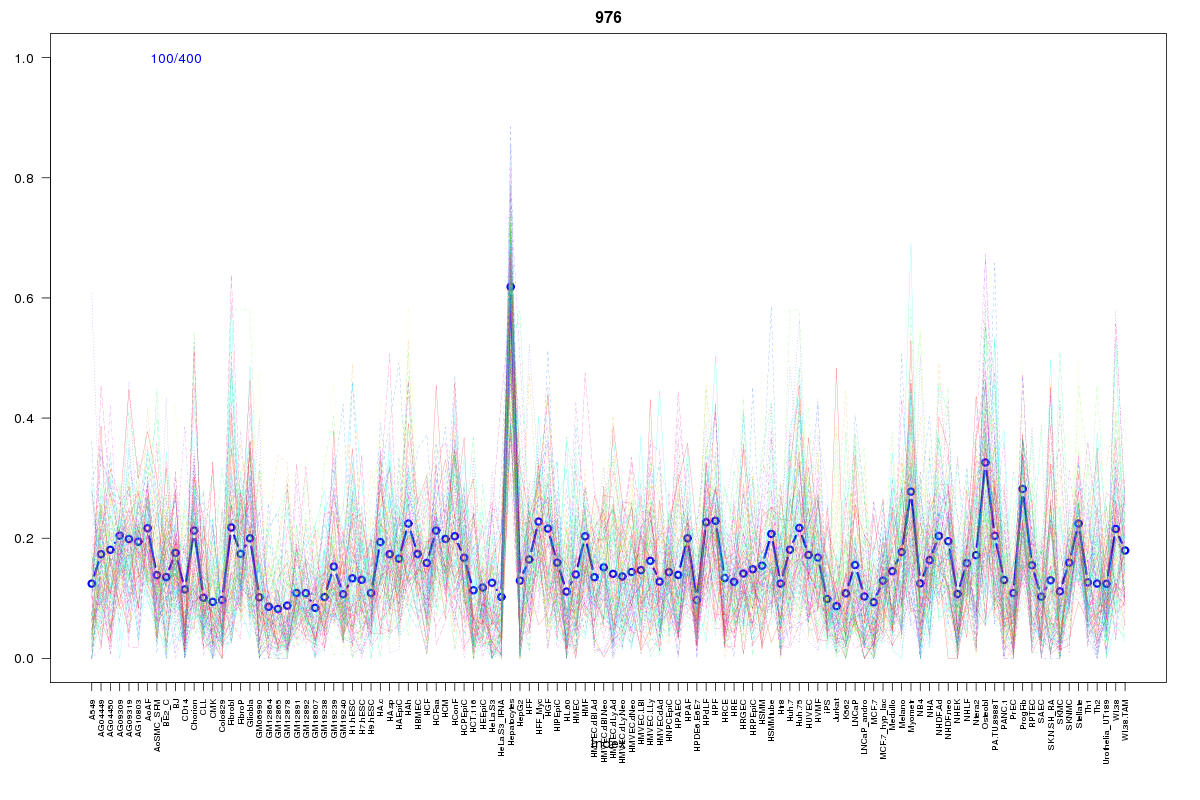 | 976 | 1 |
 | 1137 | 1 |
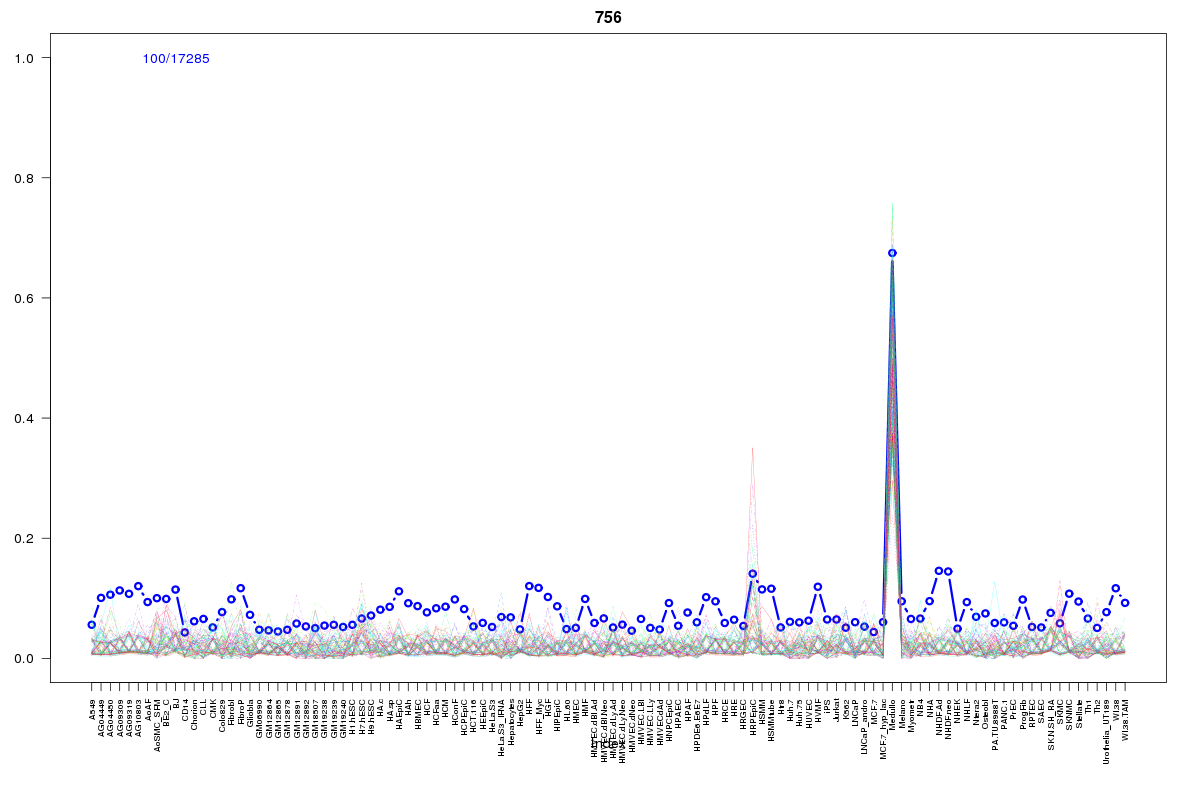 | 756 | 1 |
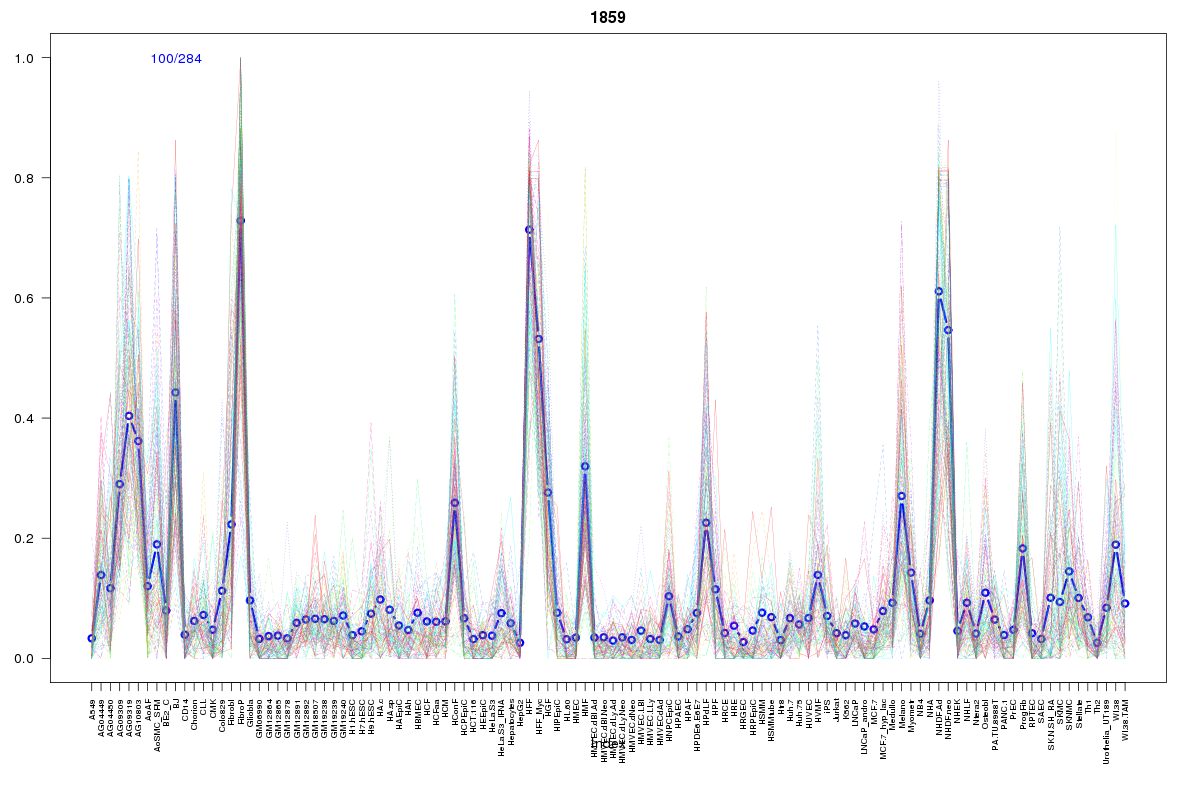 | 1859 | 1 |
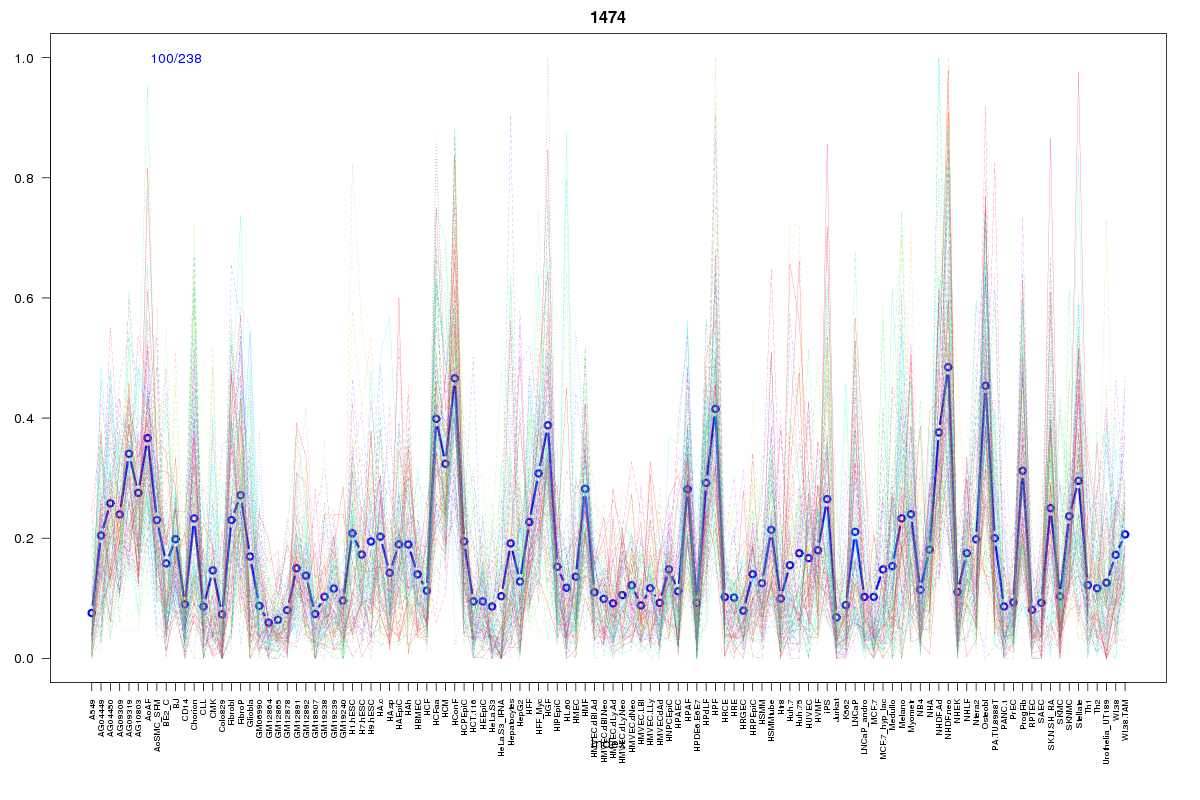 | 1474 | 1 |
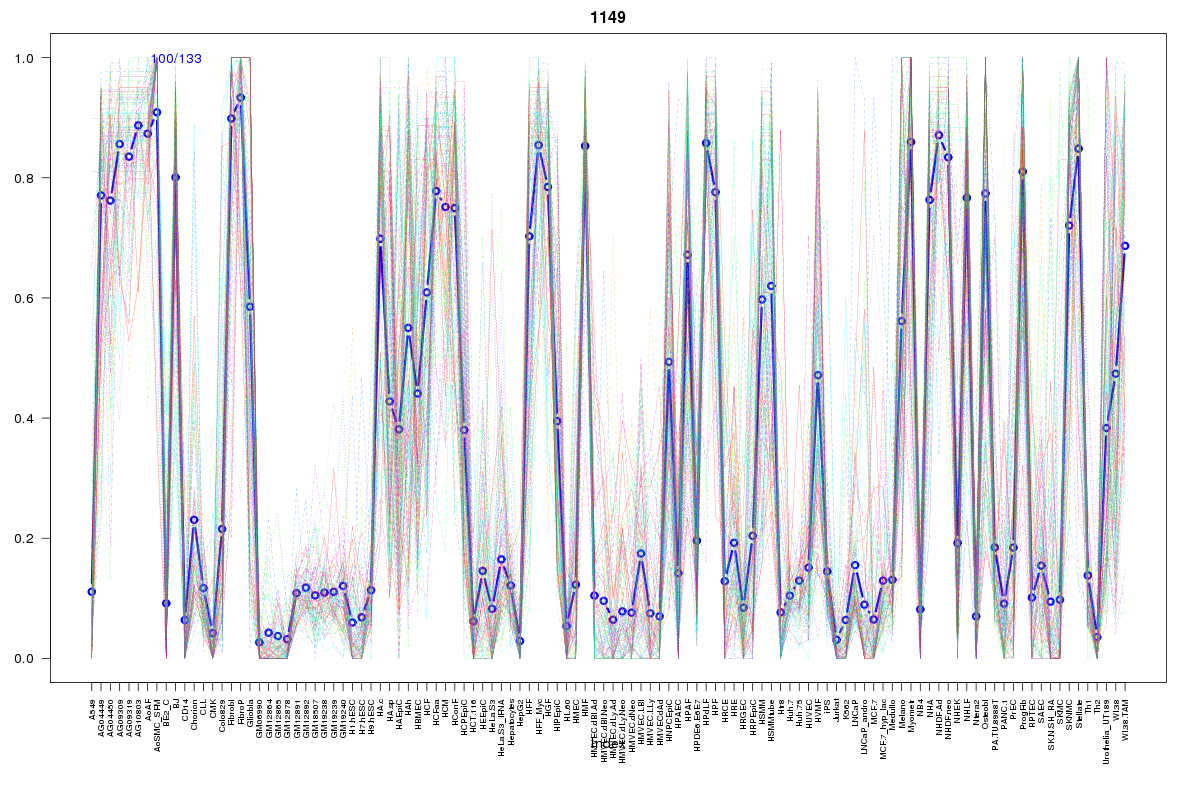 | 1149 | 1 |
 | 1388 | 1 |
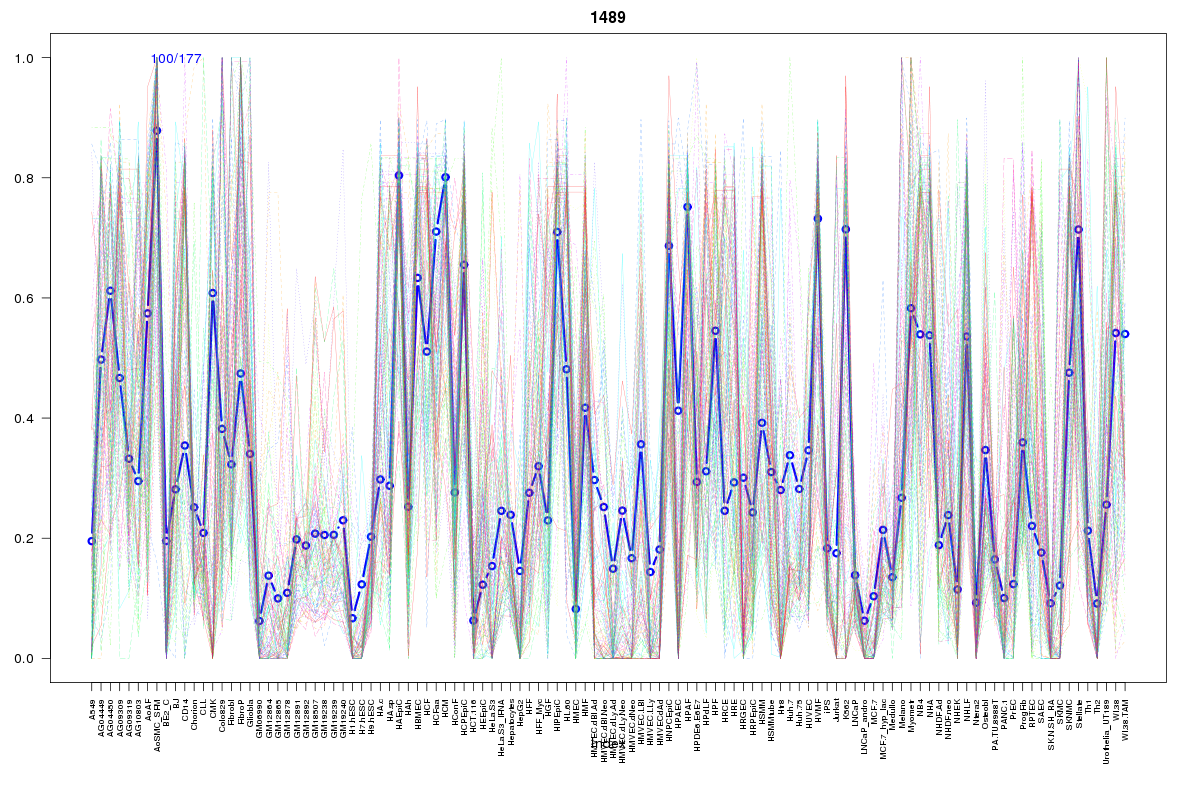 | 1489 | 1 |
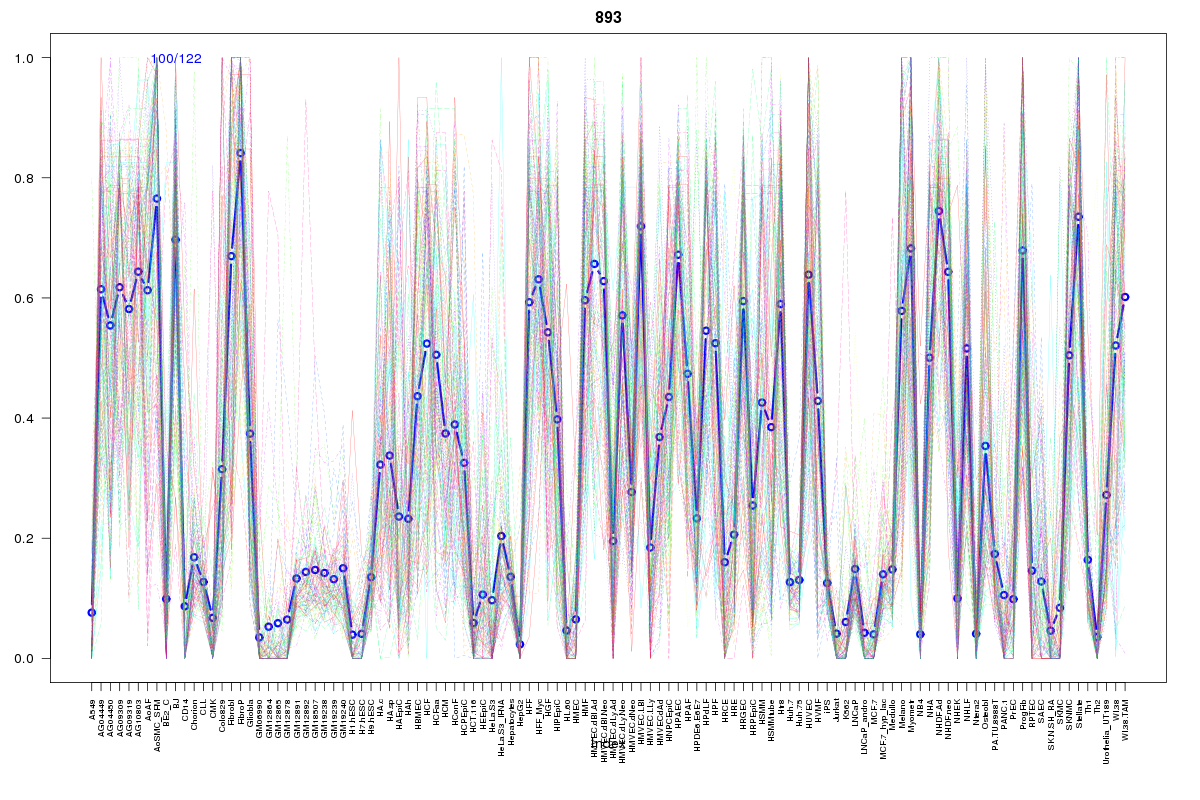 | 893 | 1 |
Resources
BED file downloads
Connects to 97 DHS sitesTop 10 Correlated DHS Sites
p-values indiciate significant higher or lower correlation| Location | Cluster | P-value |
|---|---|---|
| chr12:2420300-2420450 | 1250 | 0 |
| chr12:2410945-2411095 | 1644 | 0.001 |
| chr12:2393140-2393290 | 1398 | 0.001 |
| chr12:2393520-2393670 | 1340 | 0.001 |
| chr12:2374180-2374330 | 1050 | 0.001 |
| chr12:2411120-2411270 | 1550 | 0.001 |
| chr12:2411300-2411450 | 1245 | 0.001 |
| chr12:2193840-2193990 | 1298 | 0.001 |
| chr12:2420140-2420290 | 1350 | 0.001 |
| chr12:2382580-2382730 | 1561 | 0.001 |
| chr12:2494220-2494370 | 1345 | 0.001 |
External Databases
UCSCEnsembl (ENSG00000151067)