Gene: TADA1
chr1: 166825746-166845564Expression Profile
(log scale)
Graphical Connections
Distribution of linked clusters:
You may find it interesting if many of the connected DHS sites belong to the same cluster.| Cluster Profile | Cluster ID | Number of DHS sites in this cluster |
|---|---|---|
 | 10 | 2 |
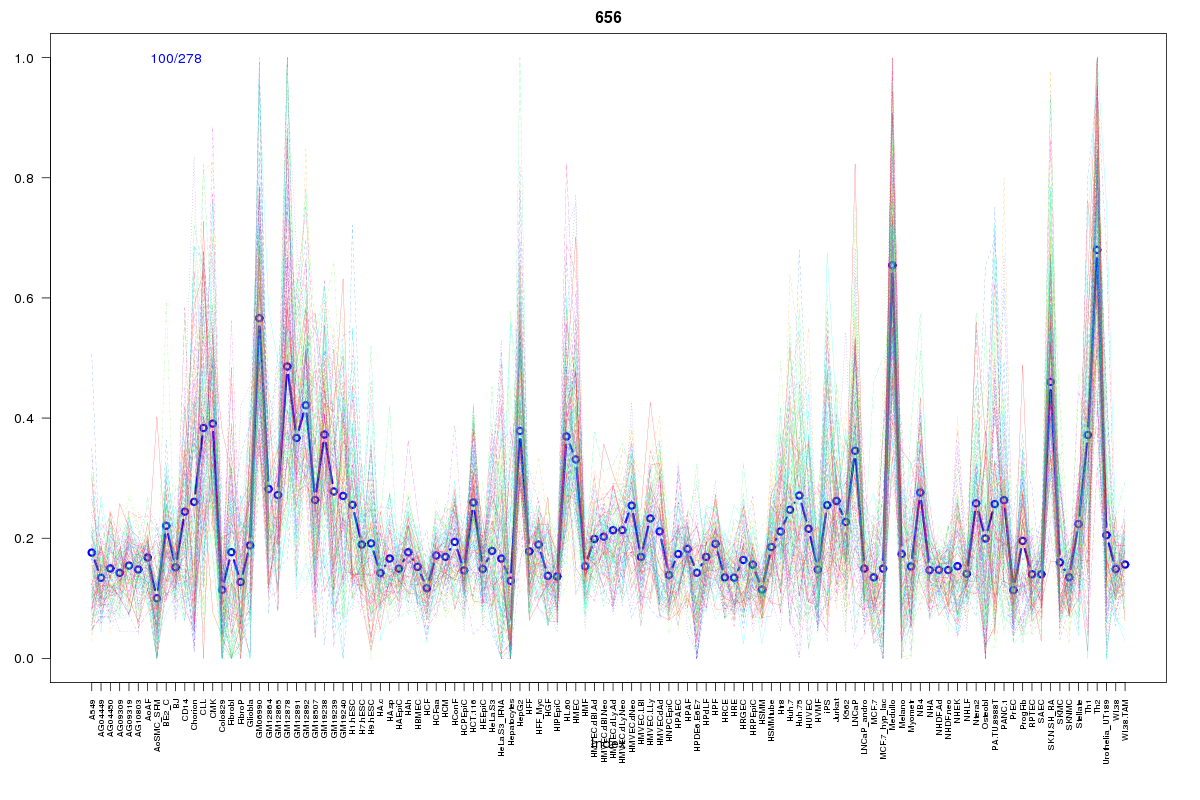 | 656 | 1 |
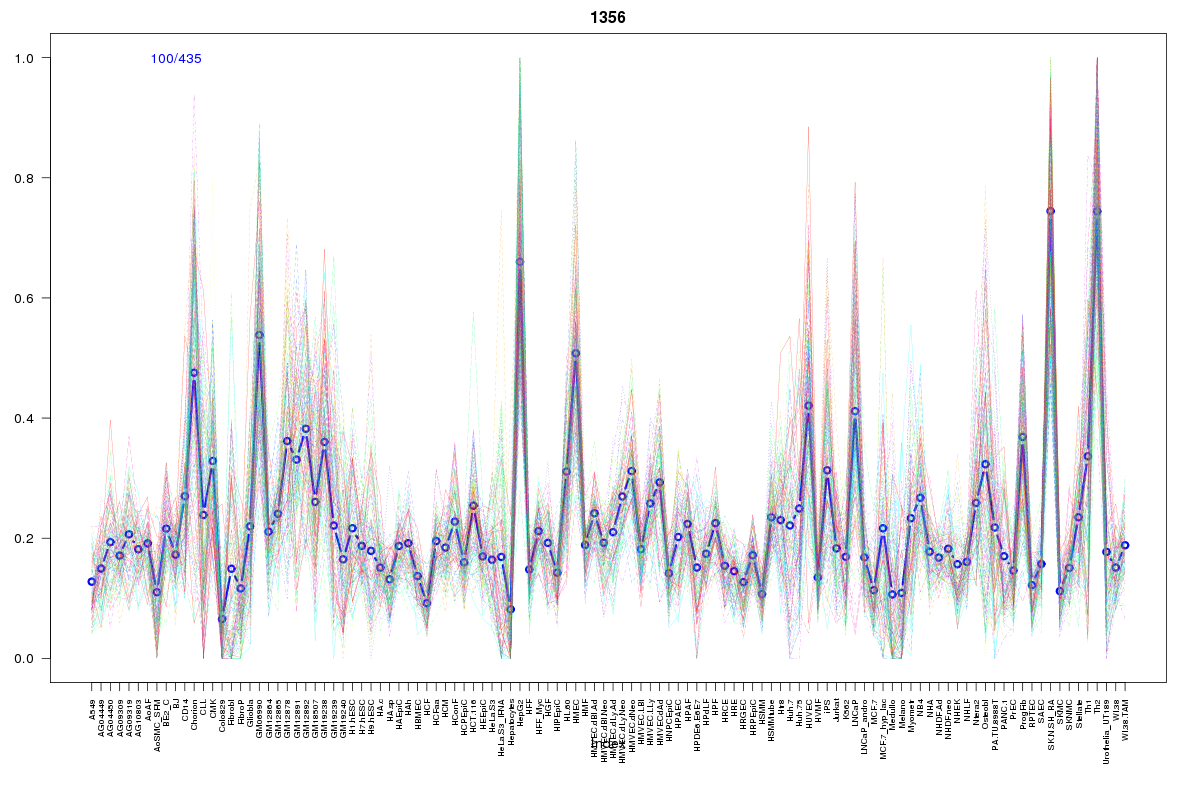 | 1356 | 1 |
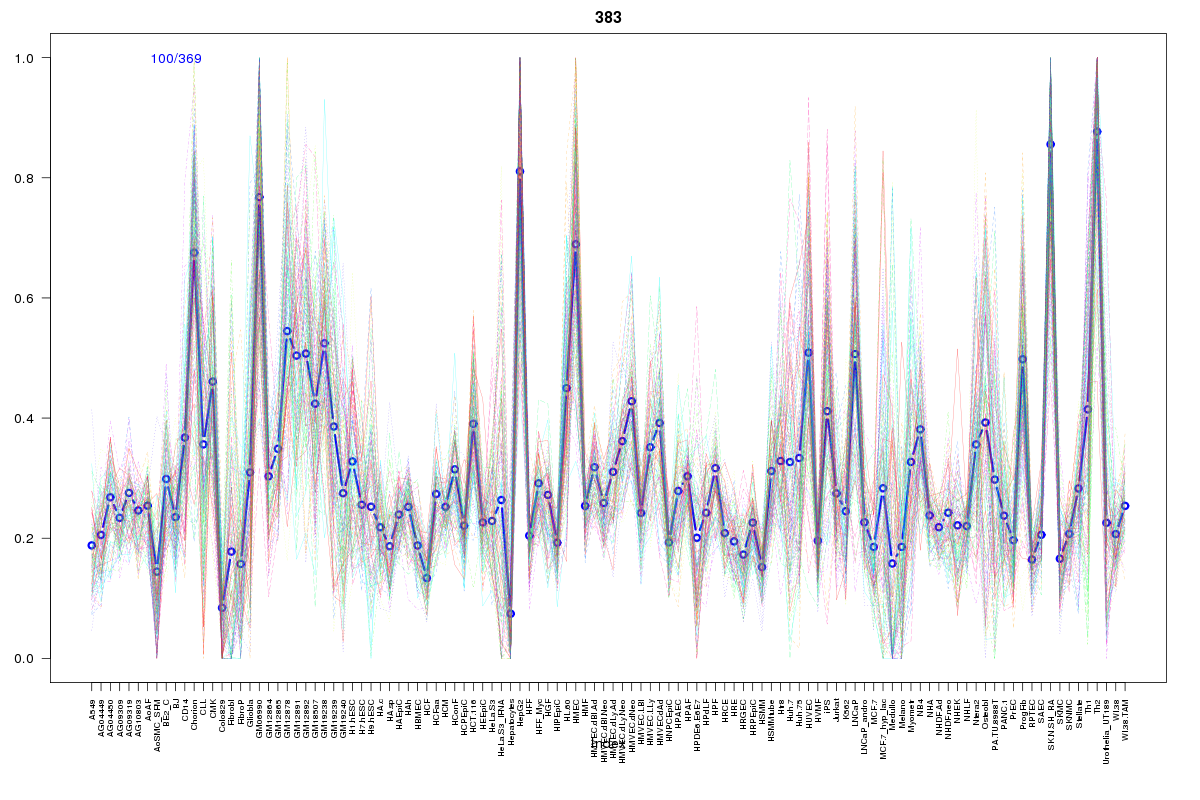 | 383 | 1 |
 | 2211 | 1 |
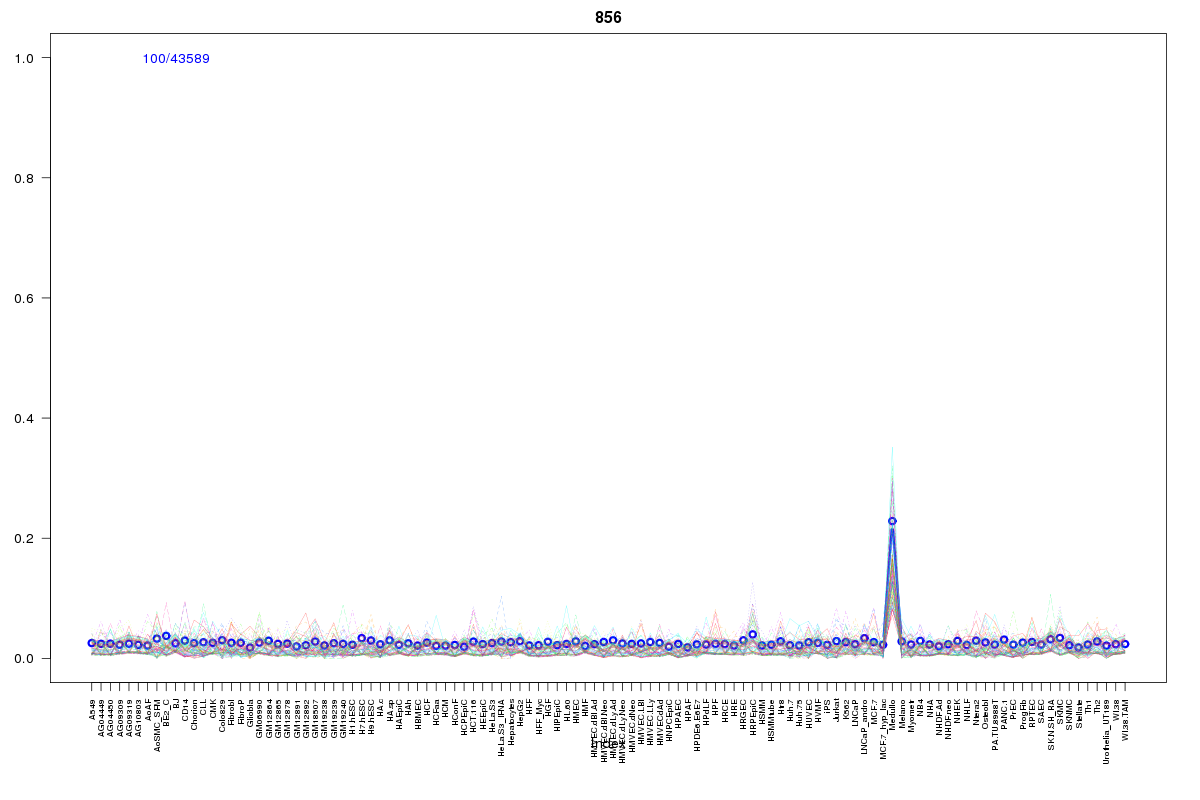 | 856 | 1 |
 | 66 | 1 |
 | 2266 | 1 |
 | 2062 | 1 |
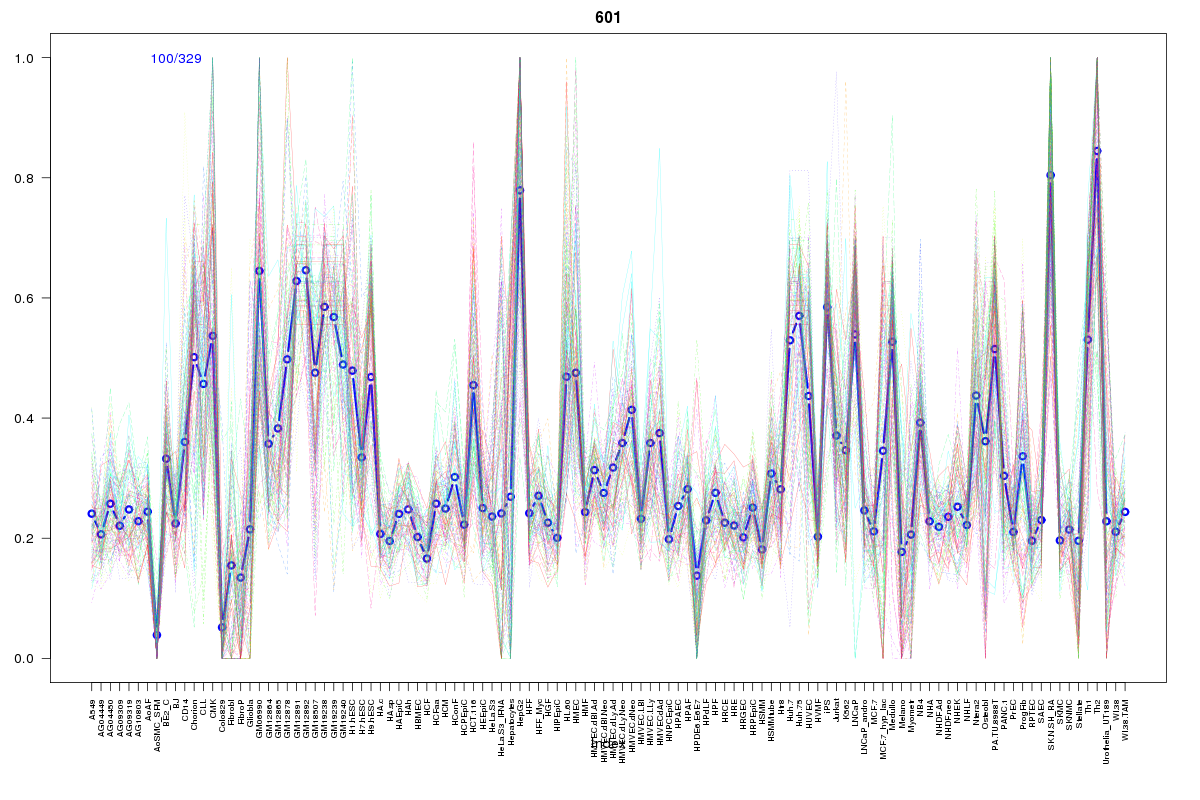 | 601 | 1 |
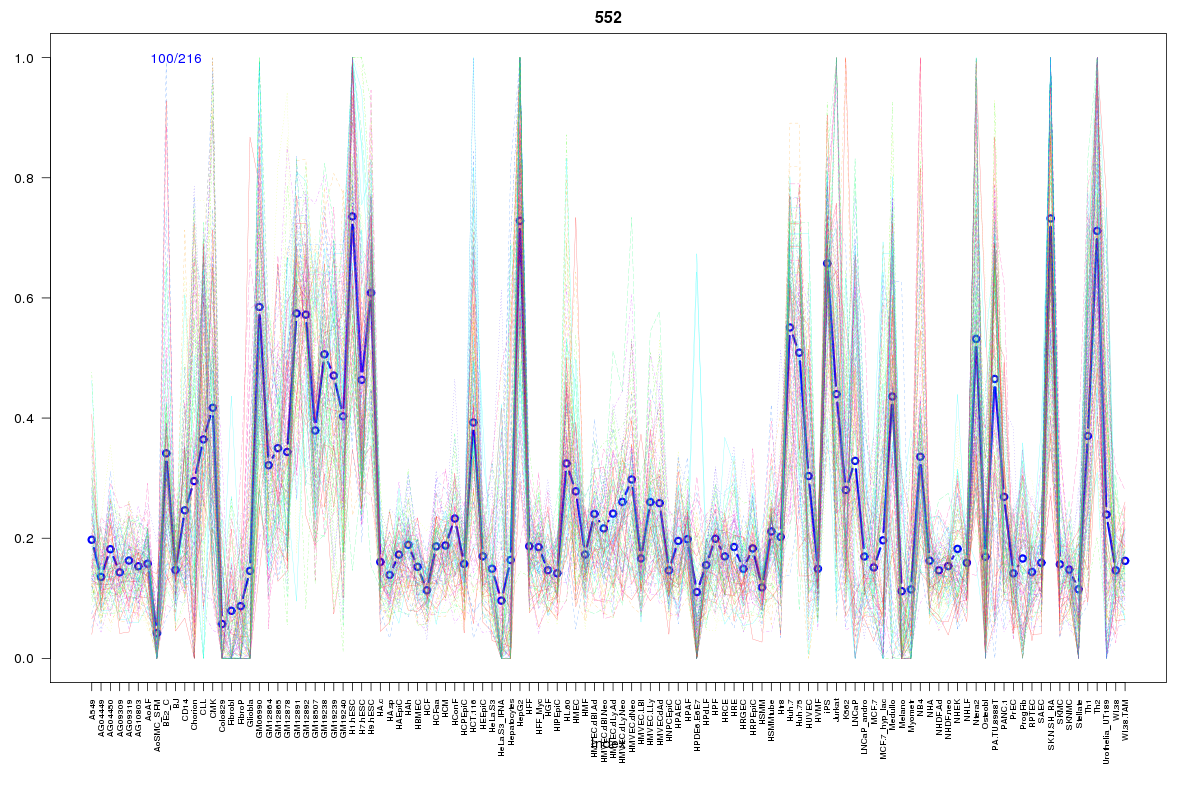 | 552 | 1 |
 | 2110 | 1 |
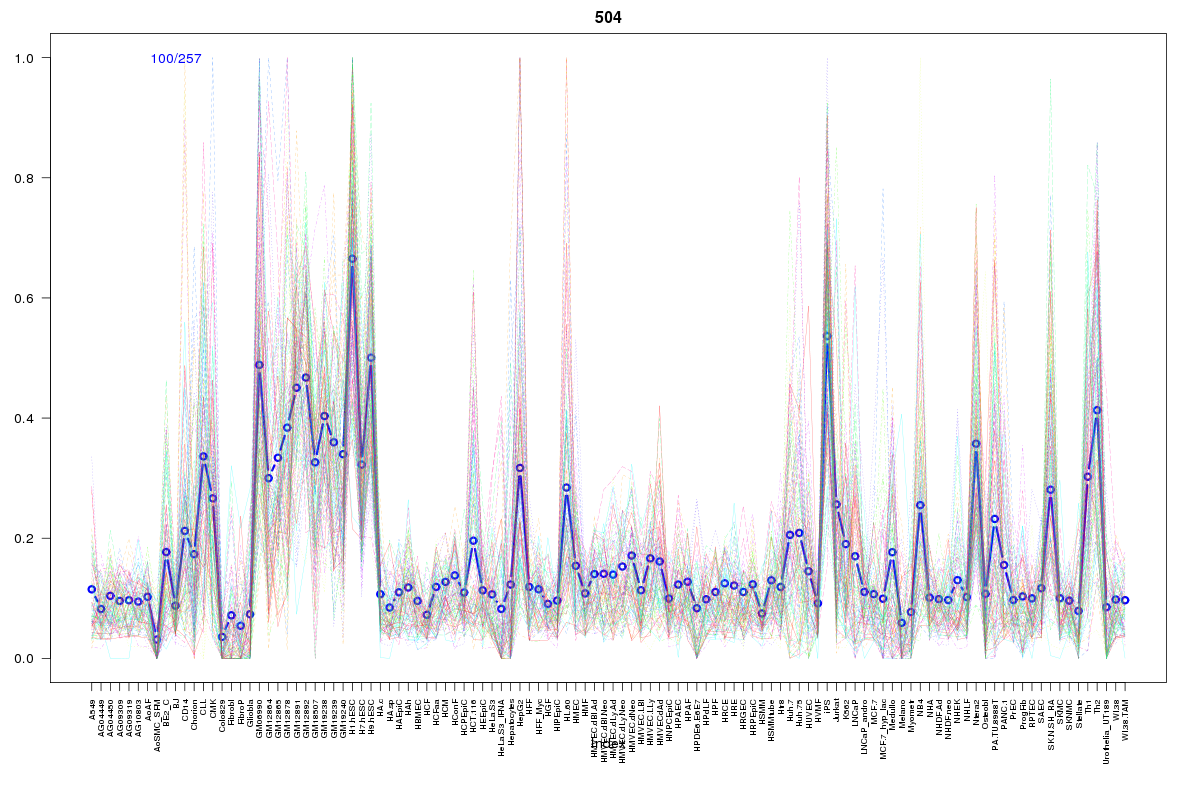 | 504 | 1 |
 | 1058 | 1 |
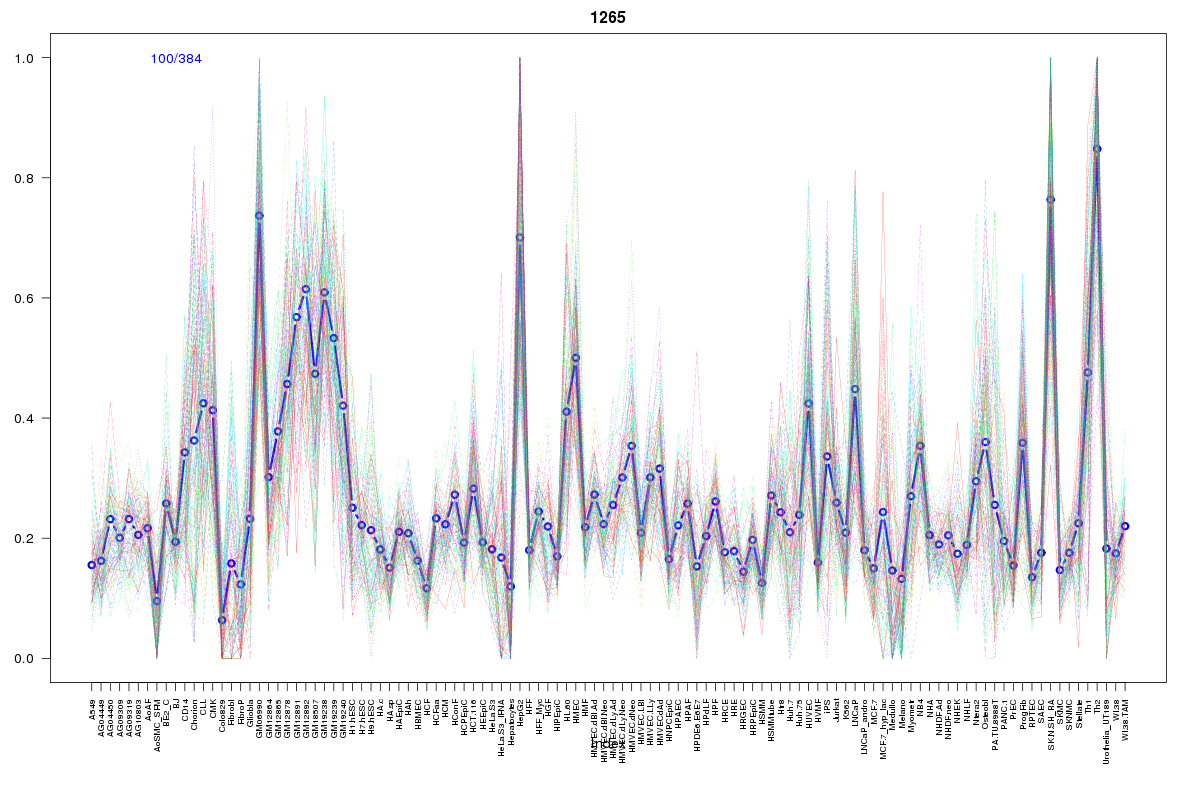 | 1265 | 1 |
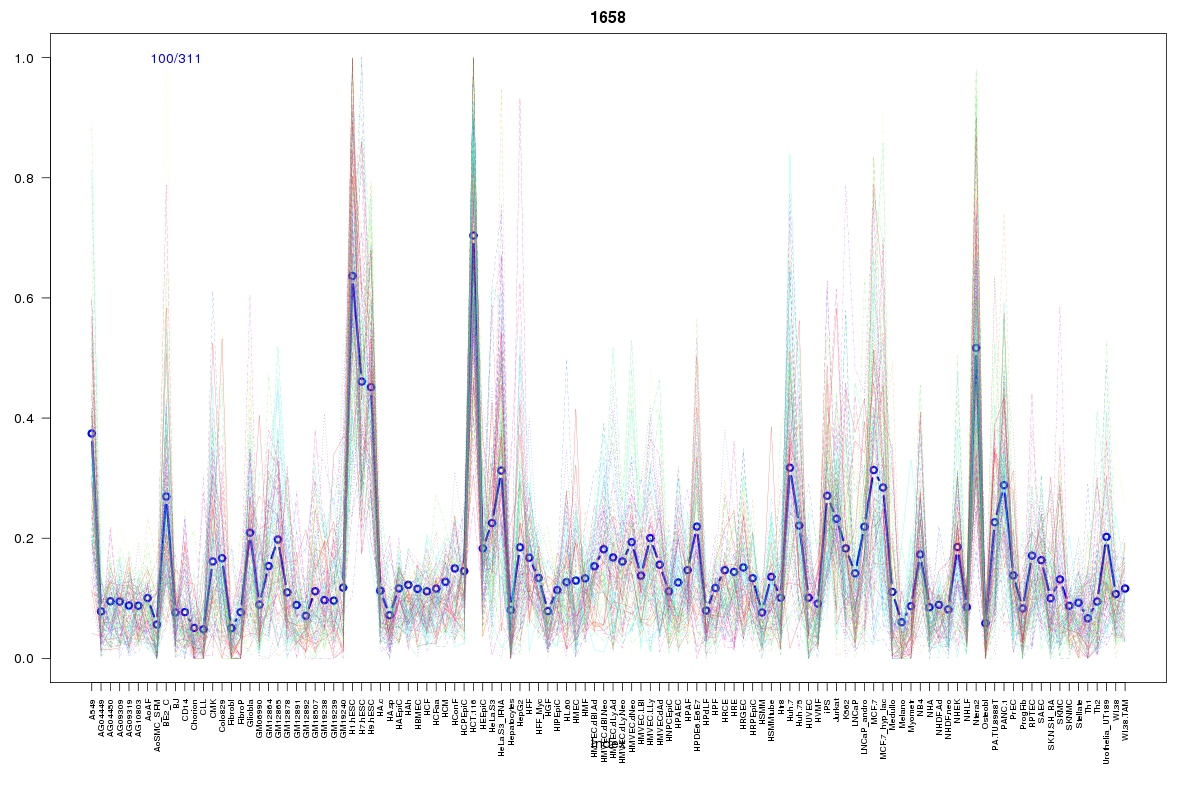 | 1658 | 1 |
 | 1738 | 1 |
Resources
BED file downloads
Connects to 18 DHS sitesTop 10 Correlated DHS Sites
p-values indiciate significant higher or lower correlation| Location | Cluster | P-value |
|---|---|---|
| chr1:166844880-166845030 | 656 | 0.003 |
| chr1:166945140-166945290 | 504 | 0.004 |
| chr1:166944985-166945135 | 552 | 0.004 |
| chr1:166944645-166944795 | 601 | 0.006 |
| chr1:166809040-166809190 | 1265 | 0.009 |
| chr1:166809365-166809515 | 1658 | 0.009 |
| chr1:166944185-166944335 | 2062 | 0.009 |
| chr1:166938680-166938830 | 2266 | 0.013 |
| chr1:166854280-166854430 | 2211 | 0.013 |
| chr1:166845265-166845415 | 383 | 0.014 |
| chr1:166845060-166845210 | 1356 | 0.014 |
External Databases
UCSCEnsembl (ENSG00000152382)