Gene: LPCAT1
chr5: 1456594-1524077Expression Profile
(log scale)
Graphical Connections
Distribution of linked clusters:
You may find it interesting if many of the connected DHS sites belong to the same cluster.| Cluster Profile | Cluster ID | Number of DHS sites in this cluster |
|---|---|---|
 | 2288 | 2 |
 | 862 | 2 |
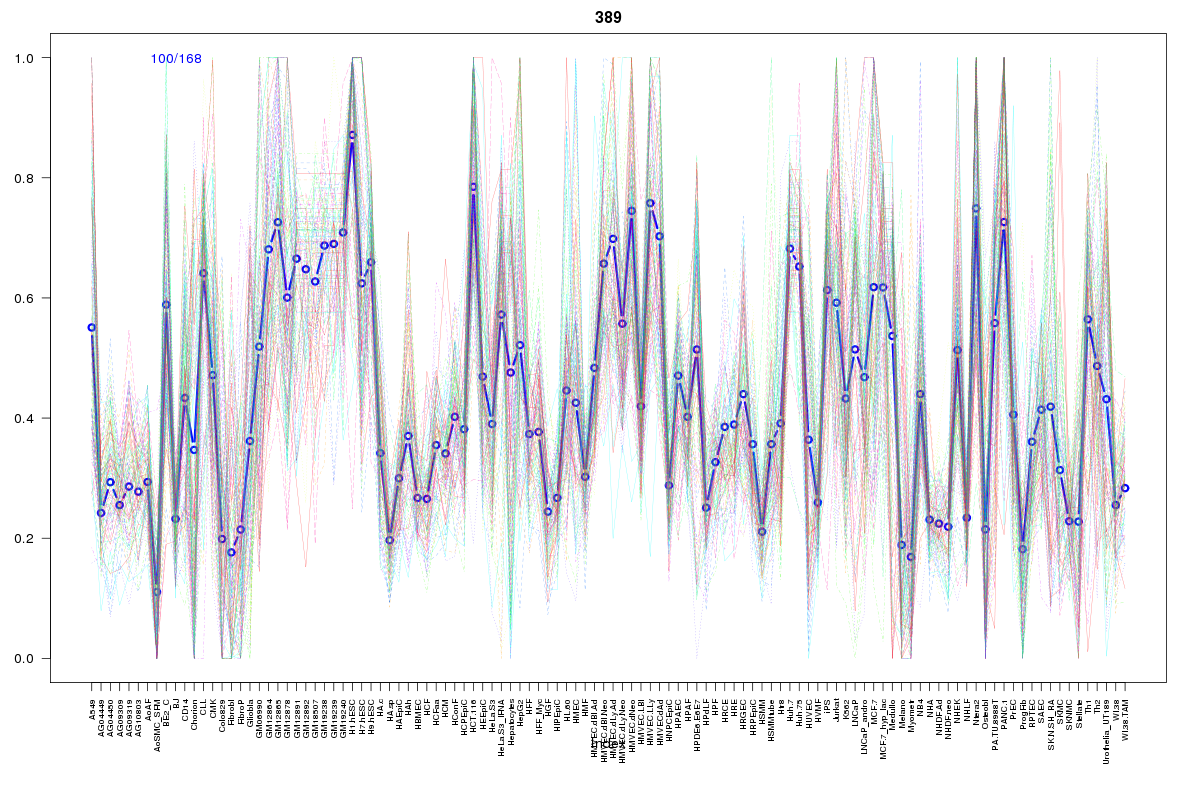 | 389 | 1 |
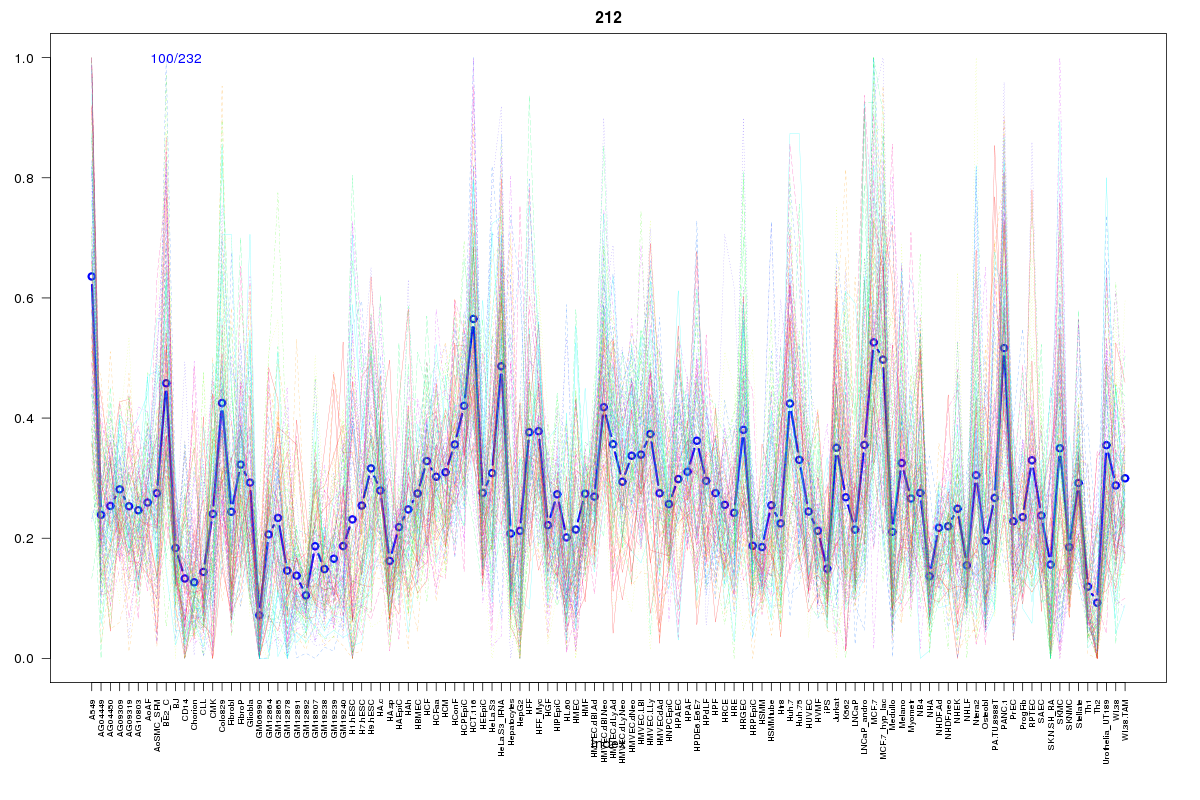 | 212 | 1 |
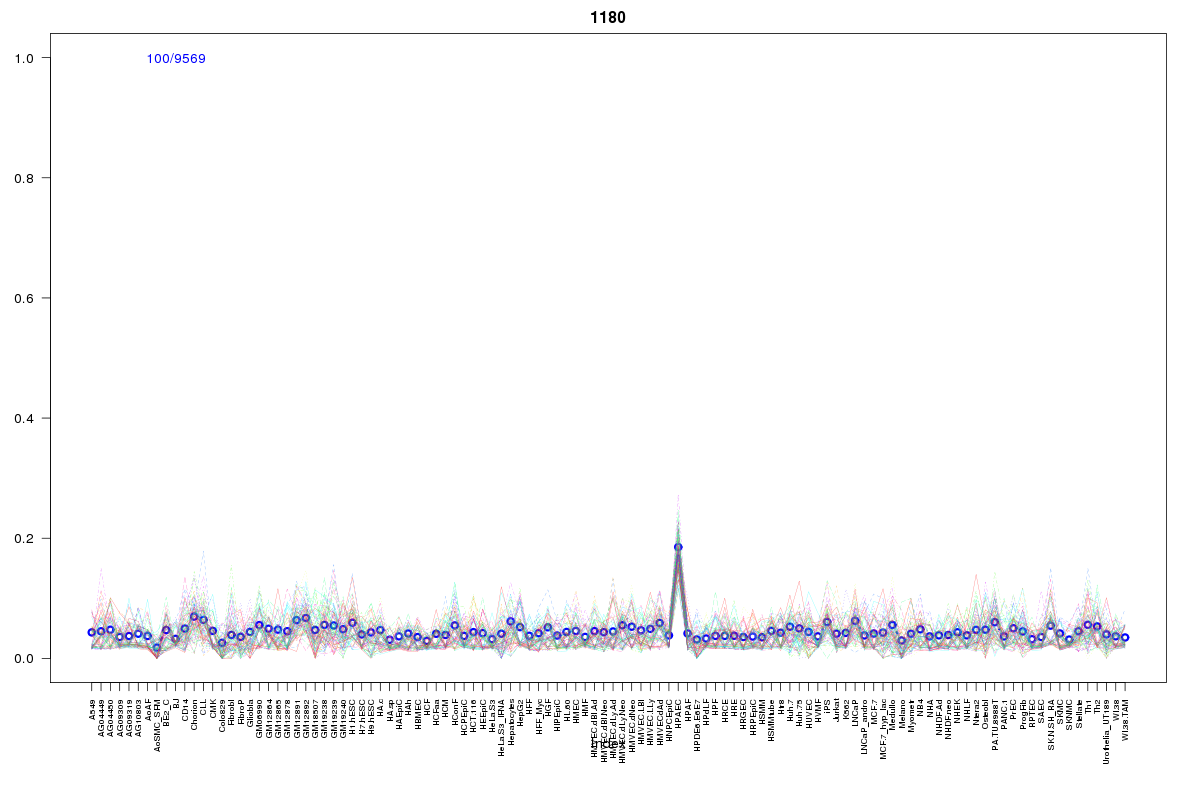 | 1180 | 1 |
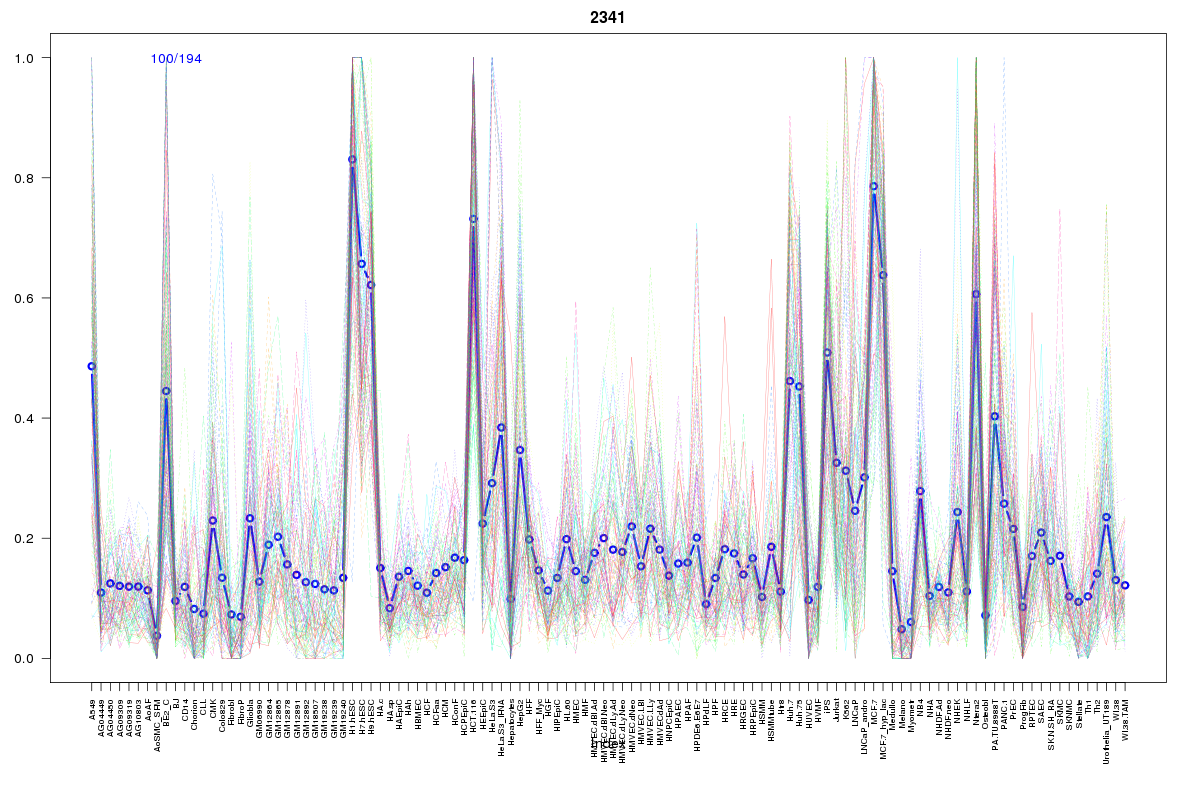 | 2341 | 1 |
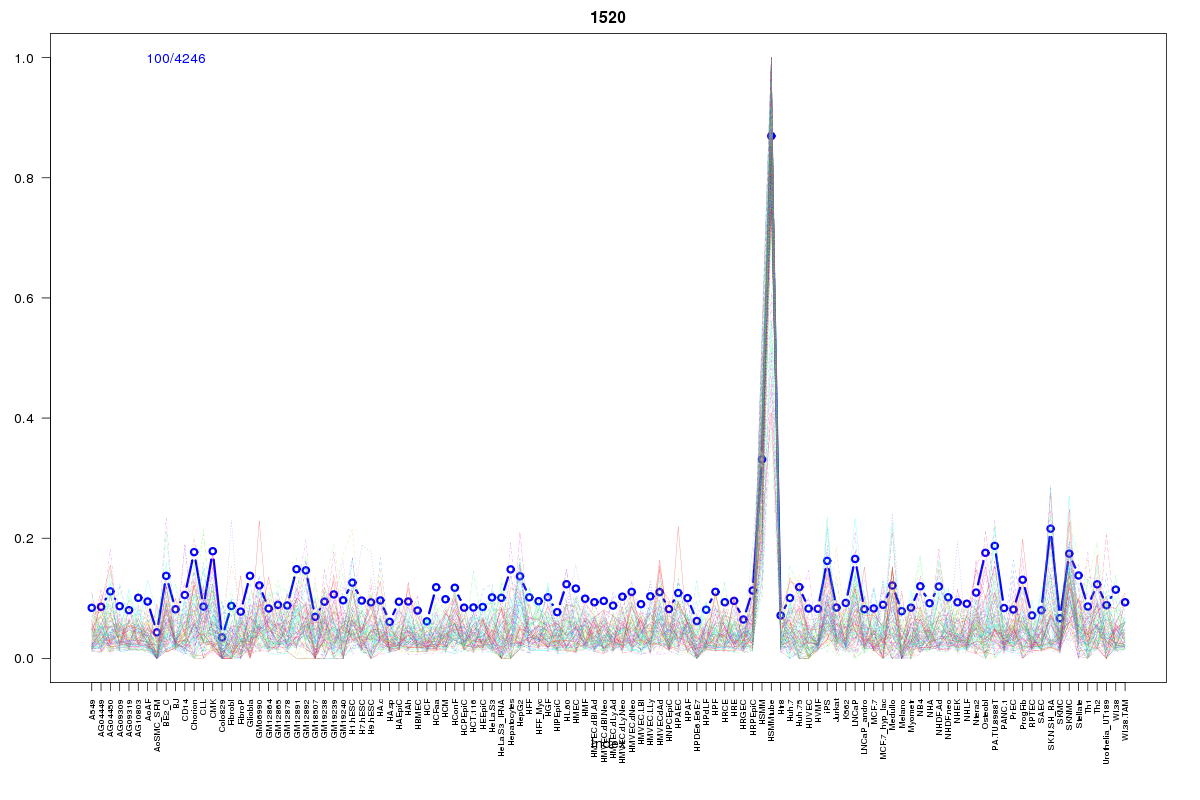 | 1520 | 1 |
 | 2055 | 1 |
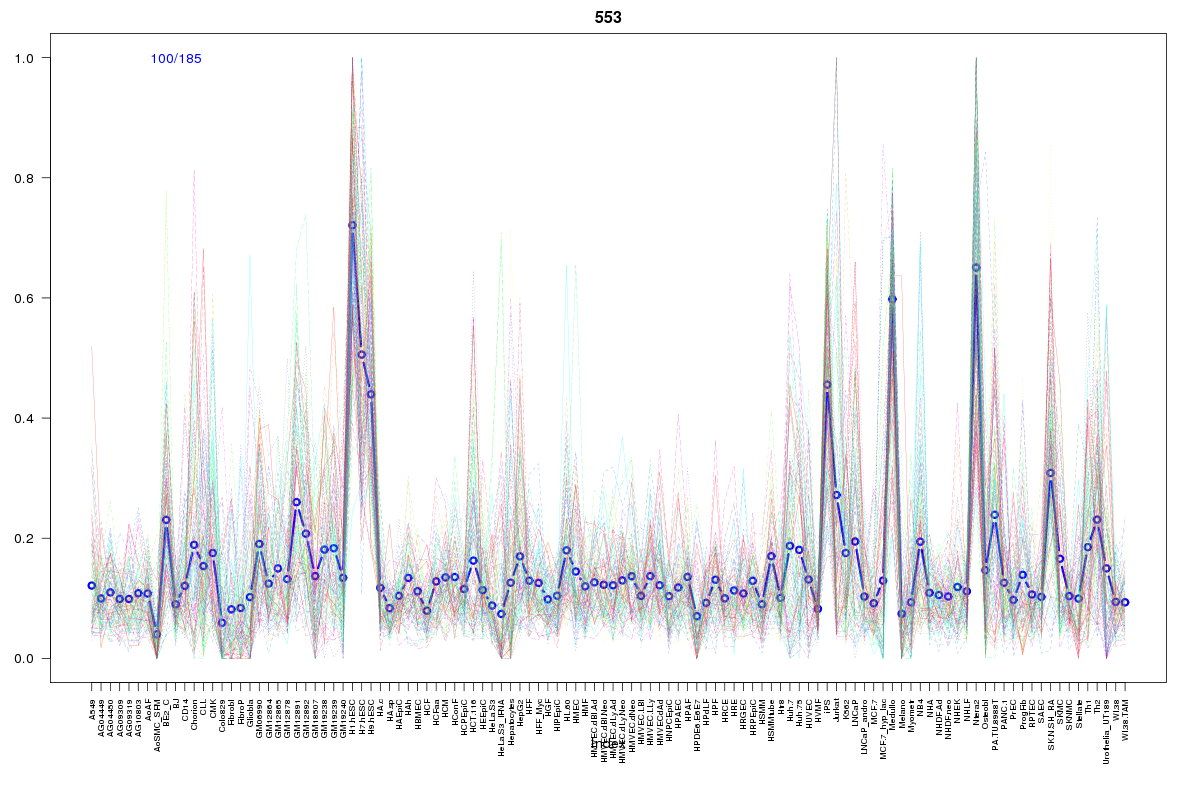 | 553 | 1 |
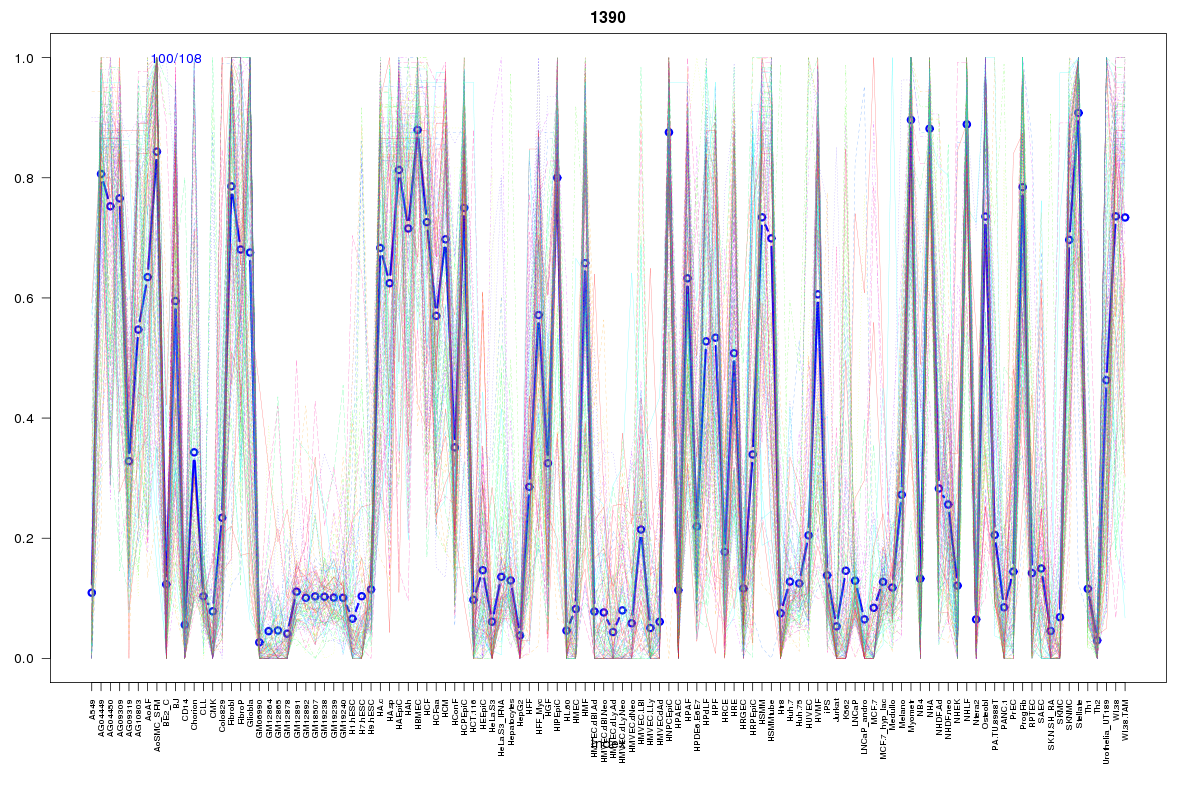 | 1390 | 1 |
 | 881 | 1 |
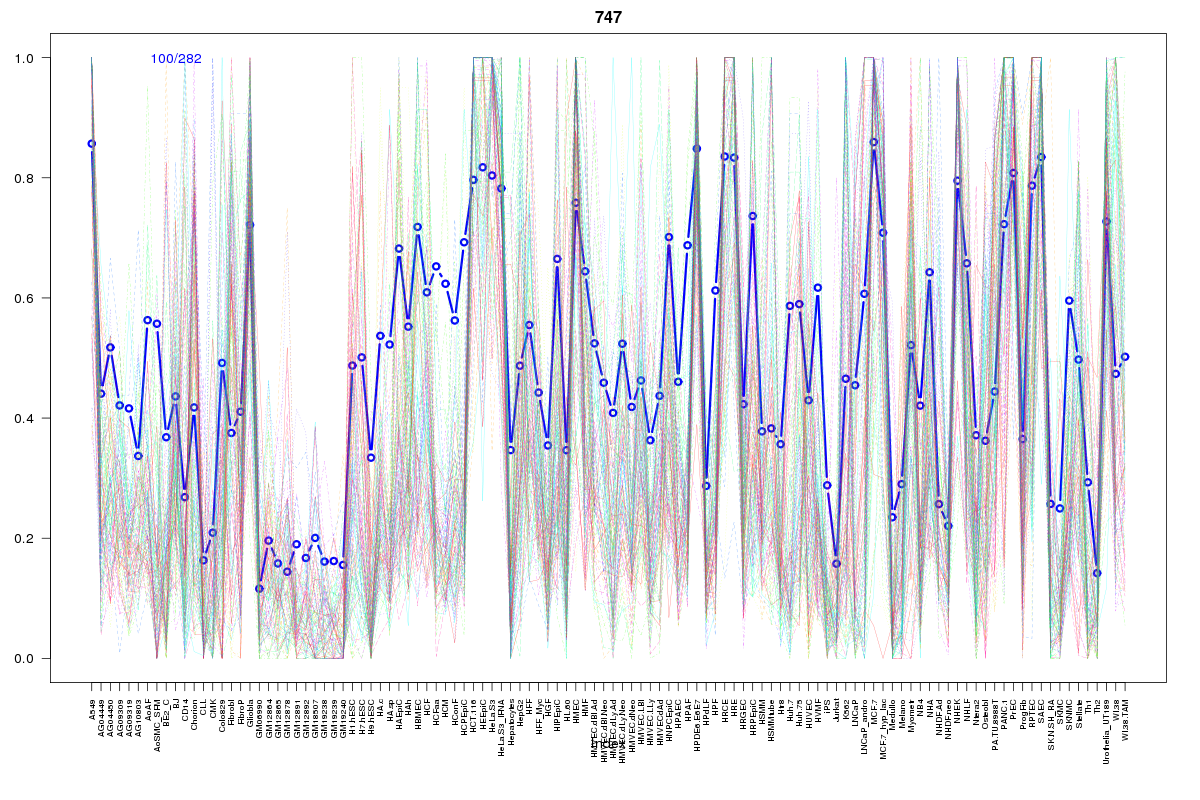 | 747 | 1 |
 | 66 | 1 |
 | 186 | 1 |
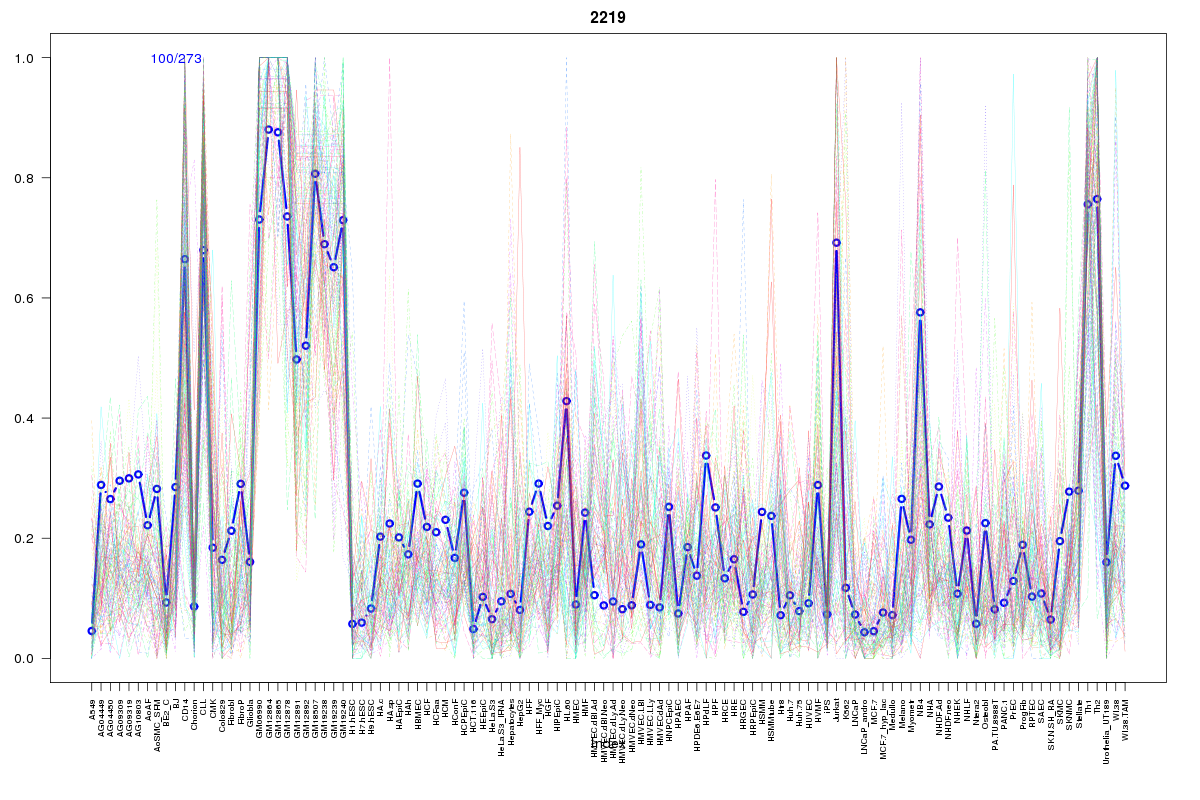 | 2219 | 1 |
 | 1078 | 1 |
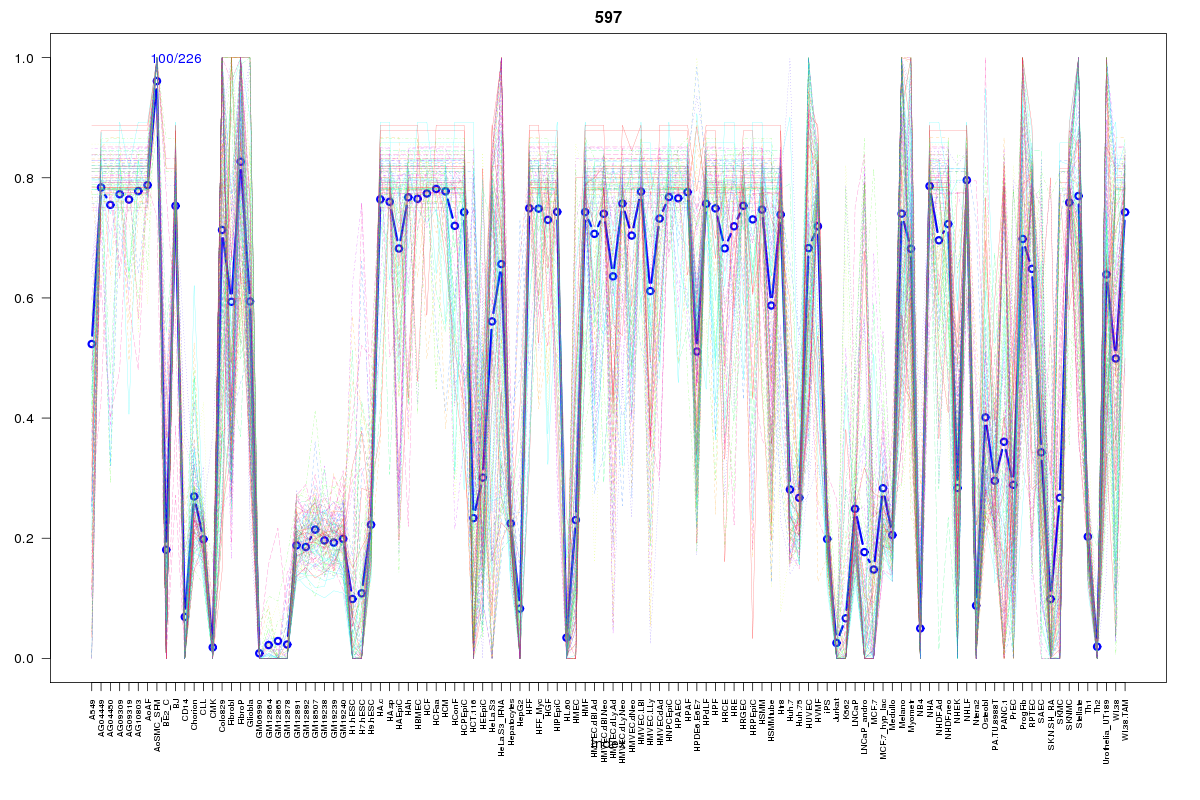 | 597 | 1 |
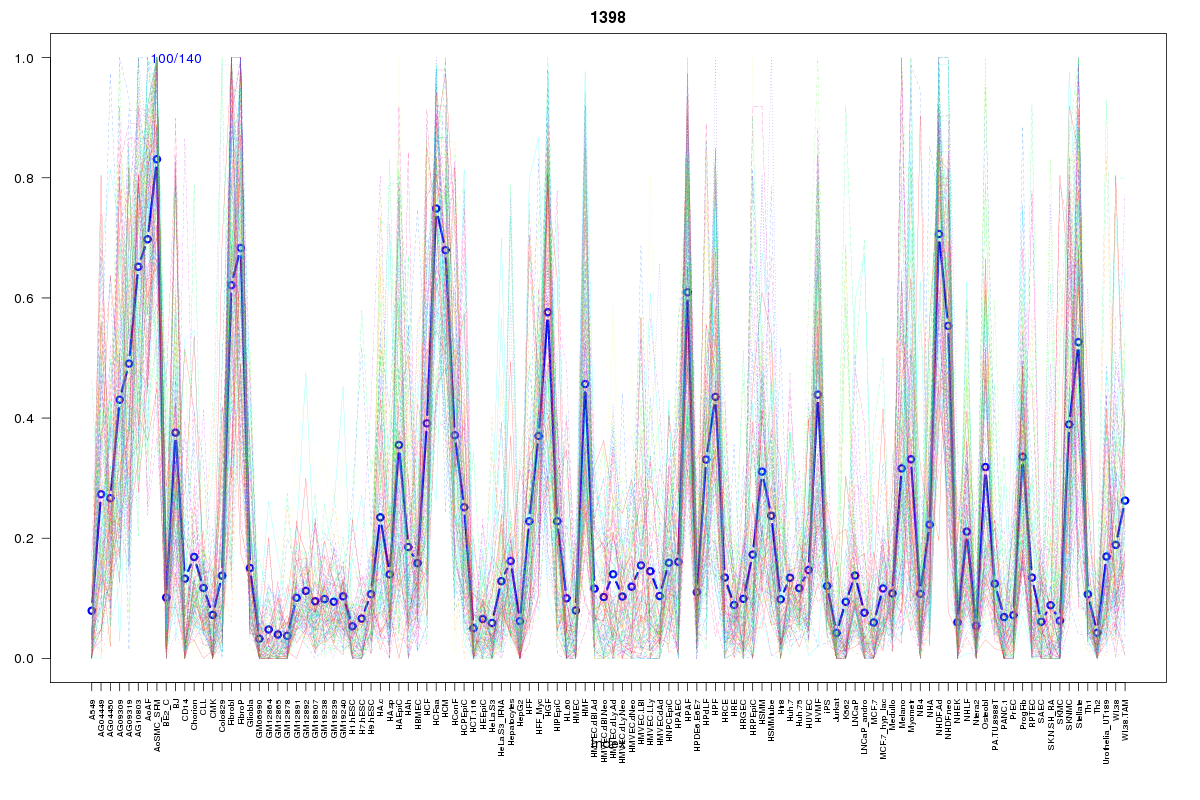 | 1398 | 1 |
 | 1605 | 1 |
Resources
BED file downloads
Connects to 21 DHS sitesTop 10 Correlated DHS Sites
p-values indiciate significant higher or lower correlation| Location | Cluster | P-value |
|---|---|---|
| chr5:1594620-1594770 | 389 | 0 |
| chr5:1601825-1601975 | 2341 | 0 |
| chr5:1514905-1515055 | 2288 | 0.004 |
| chr5:1568260-1568410 | 862 | 0.006 |
| chr5:1607745-1607895 | 2055 | 0.009 |
| chr5:1515100-1515250 | 2288 | 0.009 |
| chr5:1540360-1540510 | 1078 | 0.012 |
| chr5:1445545-1445695 | 553 | 0.013 |
| chr5:1599220-1599370 | 212 | 0.015 |
| chr5:1518960-1519110 | 66 | 0.019 |
| chr5:1471405-1471555 | 881 | 0.019 |
External Databases
UCSCEnsembl (ENSG00000153395)