Gene: NECAP2
chr1: 16767166-16786573Expression Profile
(log scale)
Graphical Connections
Distribution of linked clusters:
You may find it interesting if many of the connected DHS sites belong to the same cluster.| Cluster Profile | Cluster ID | Number of DHS sites in this cluster |
|---|---|---|
 | 1755 | 3 |
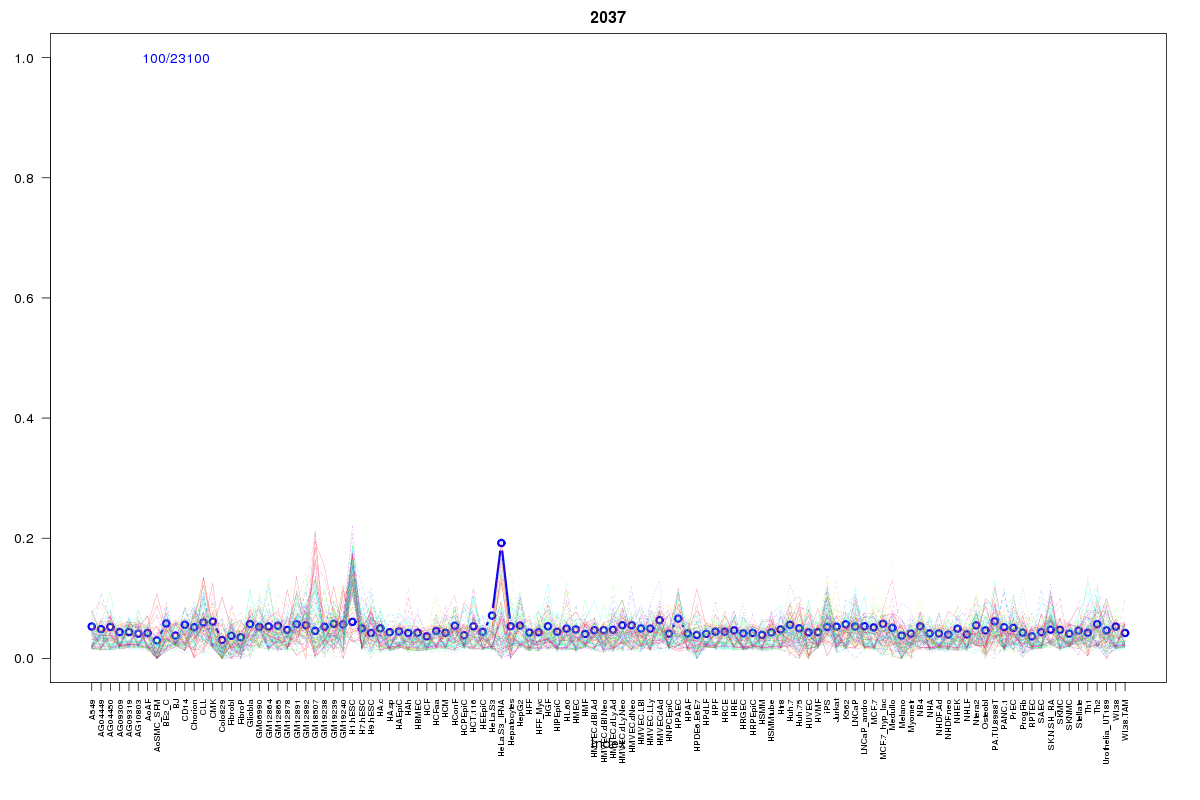 | 2037 | 2 |
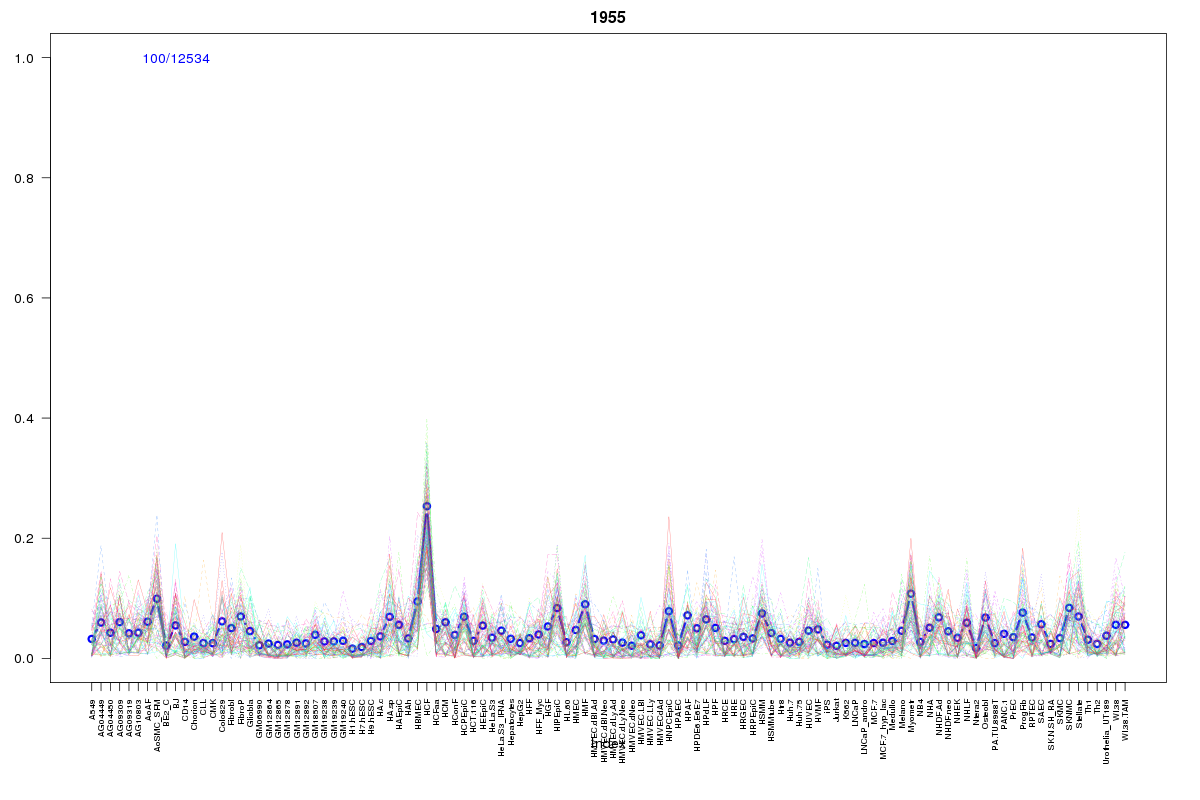 | 1955 | 2 |
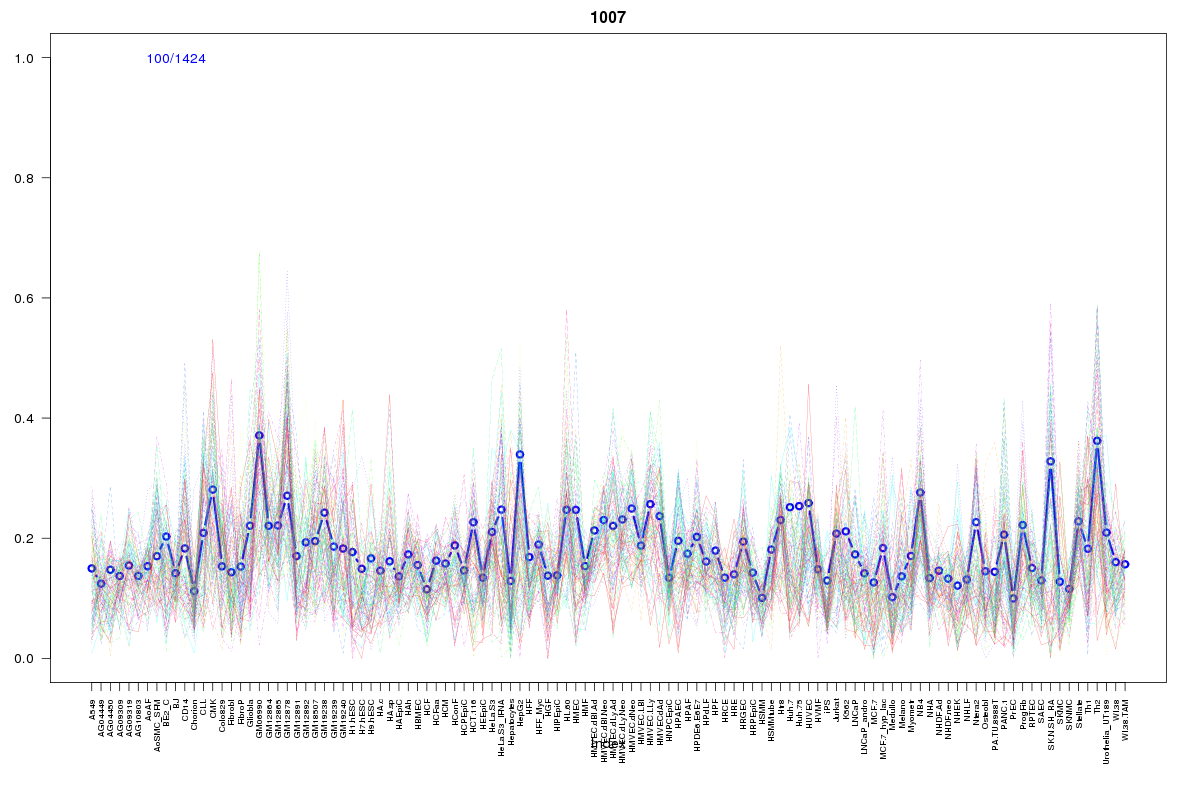 | 1007 | 1 |
 | 2072 | 1 |
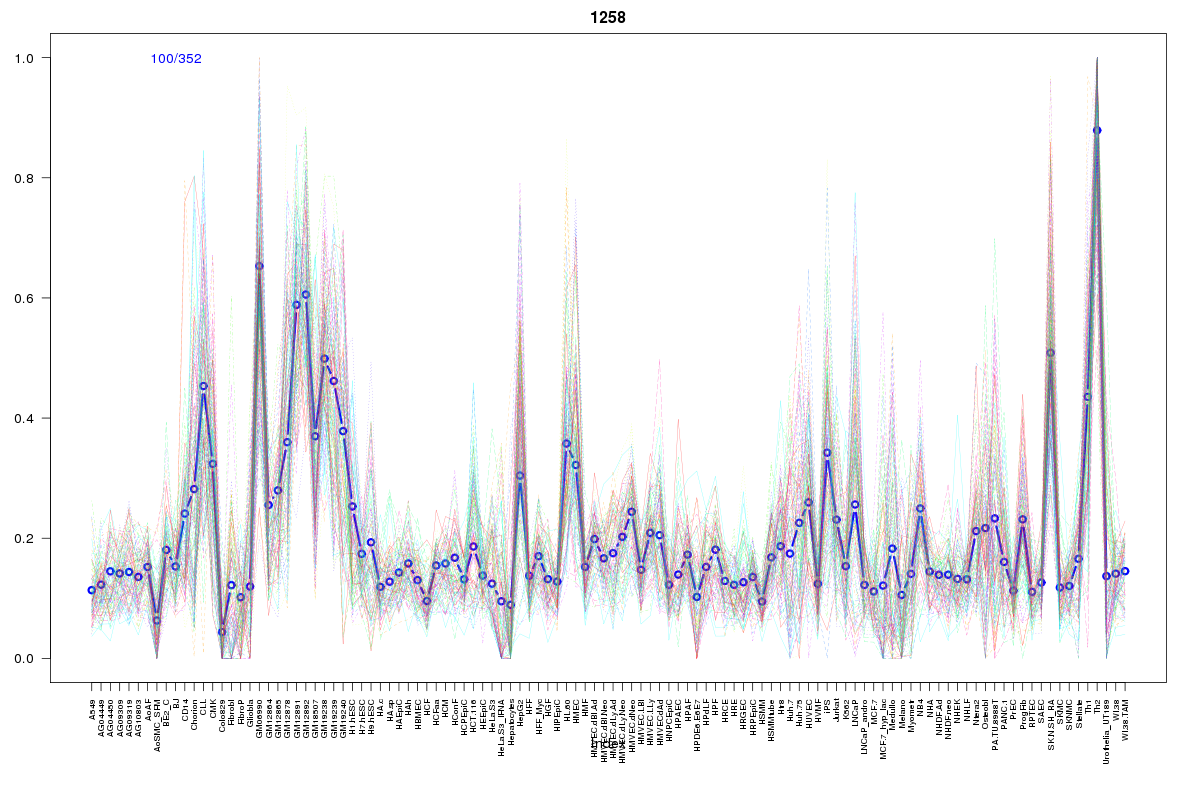 | 1258 | 1 |
 | 174 | 1 |
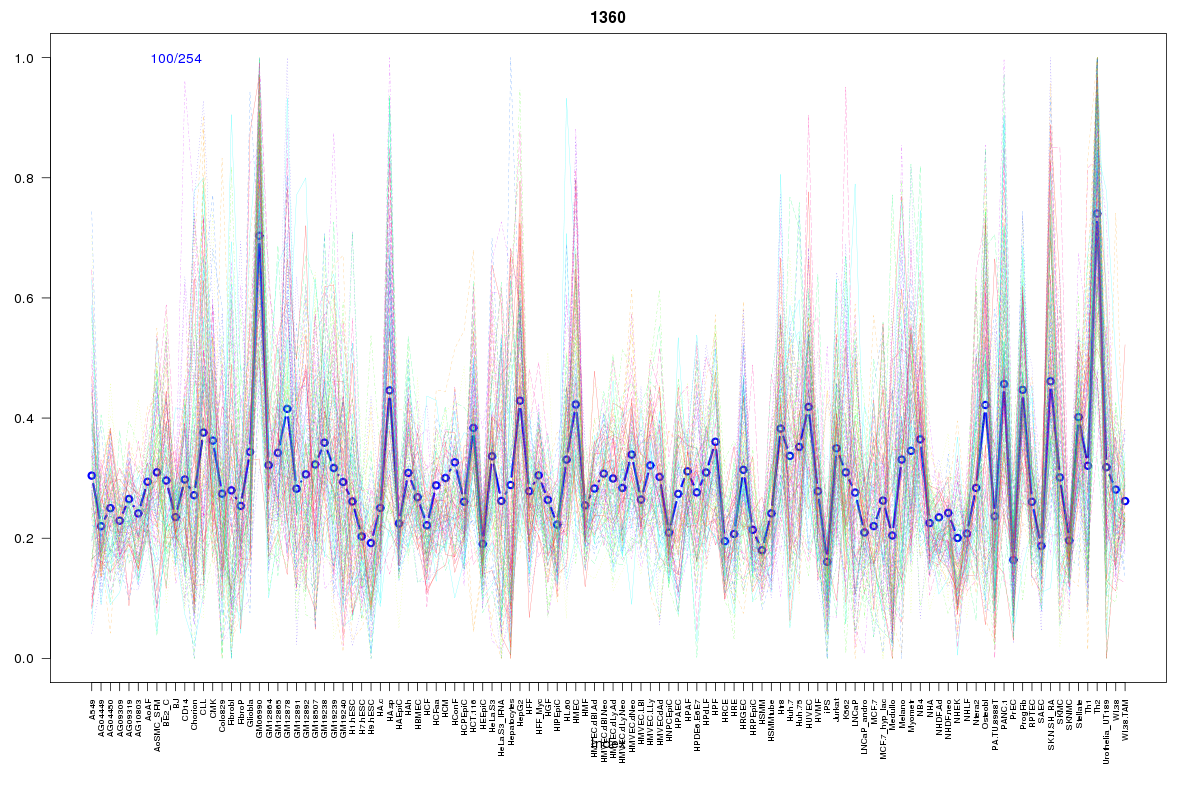 | 1360 | 1 |
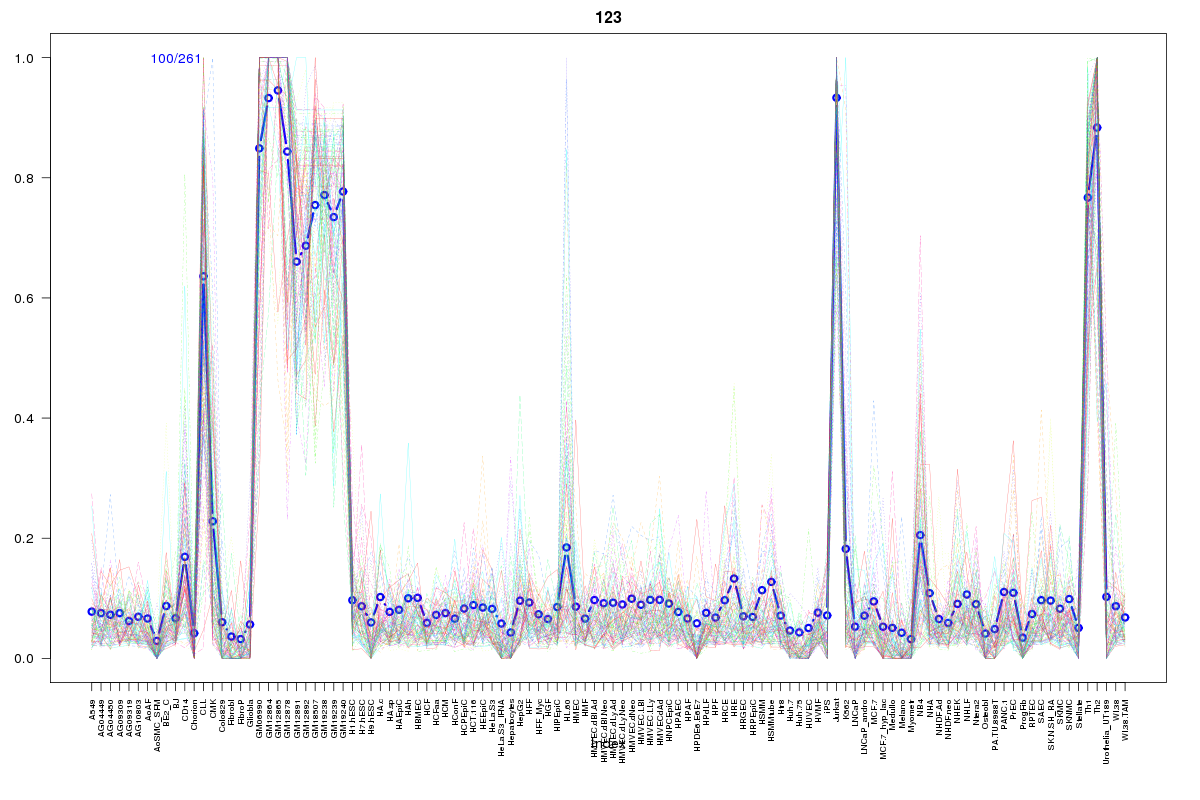 | 123 | 1 |
 | 1056 | 1 |
 | 2062 | 1 |
 | 2017 | 1 |
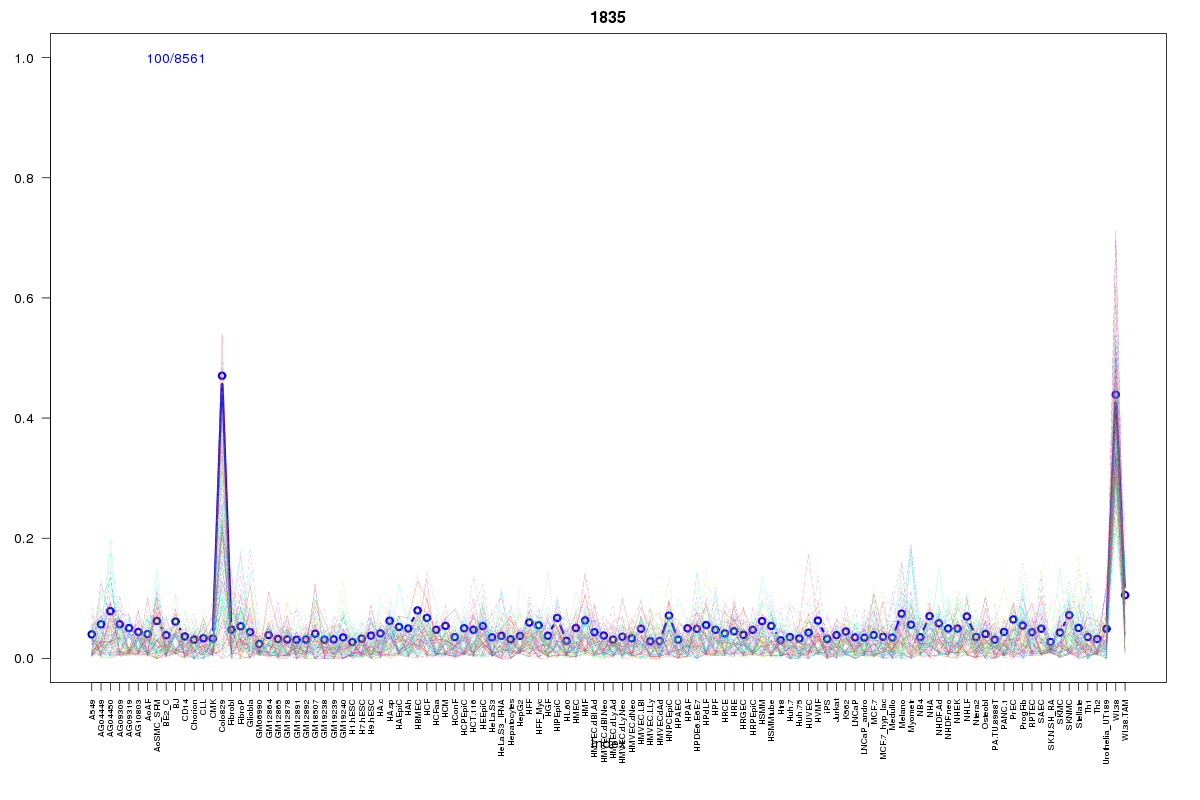 | 1835 | 1 |
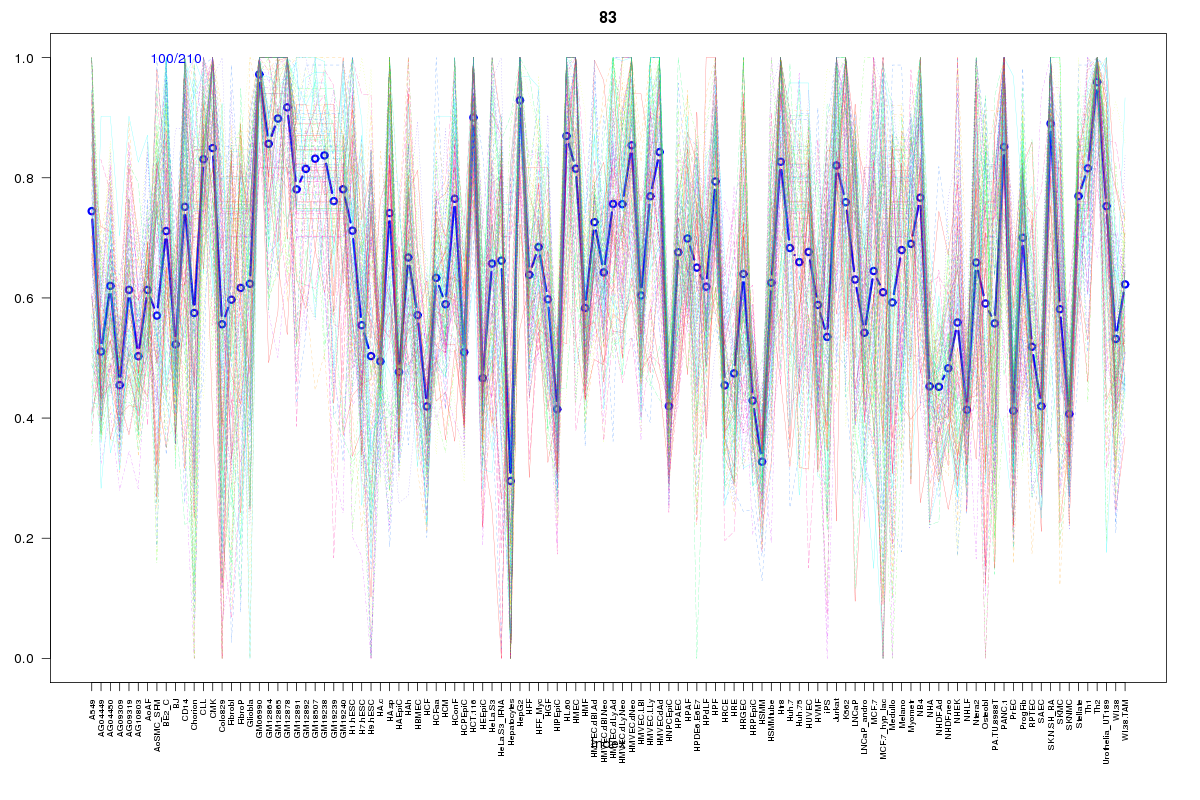 | 83 | 1 |
 | 332 | 1 |
 | 130 | 1 |
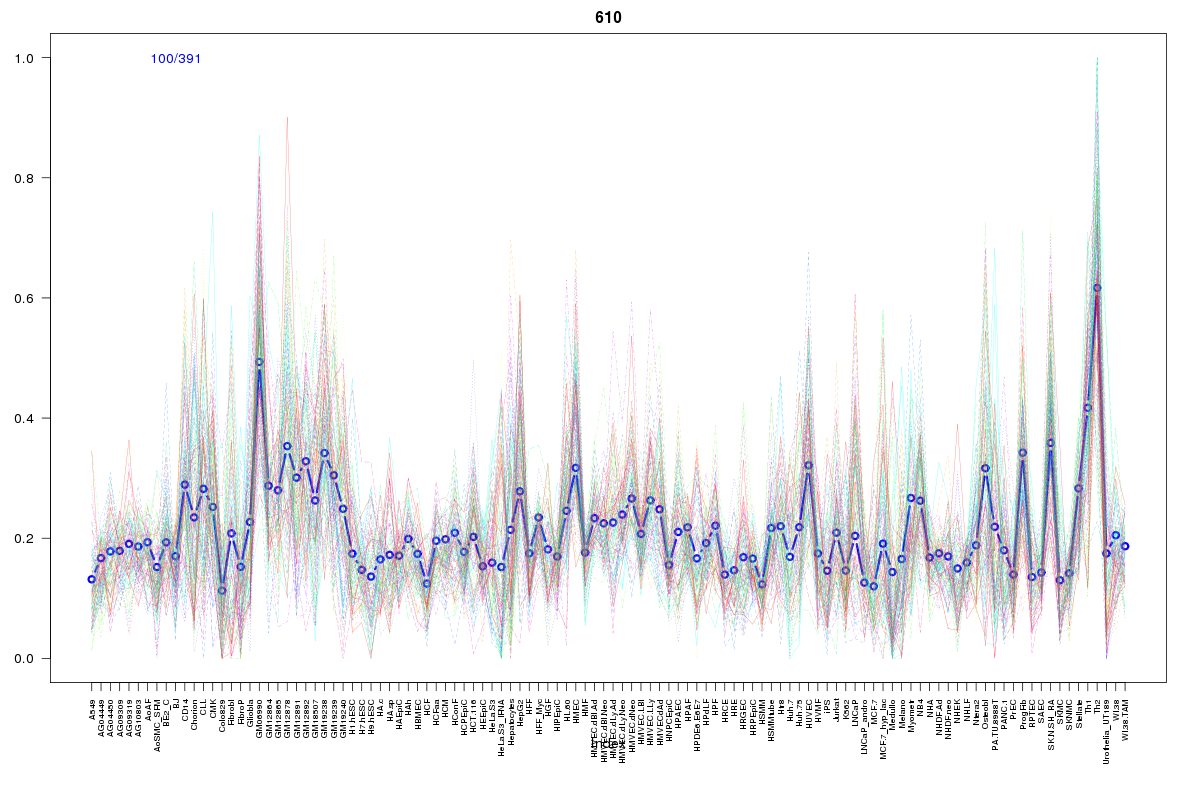 | 610 | 1 |
 | 629 | 1 |
 | 615 | 1 |
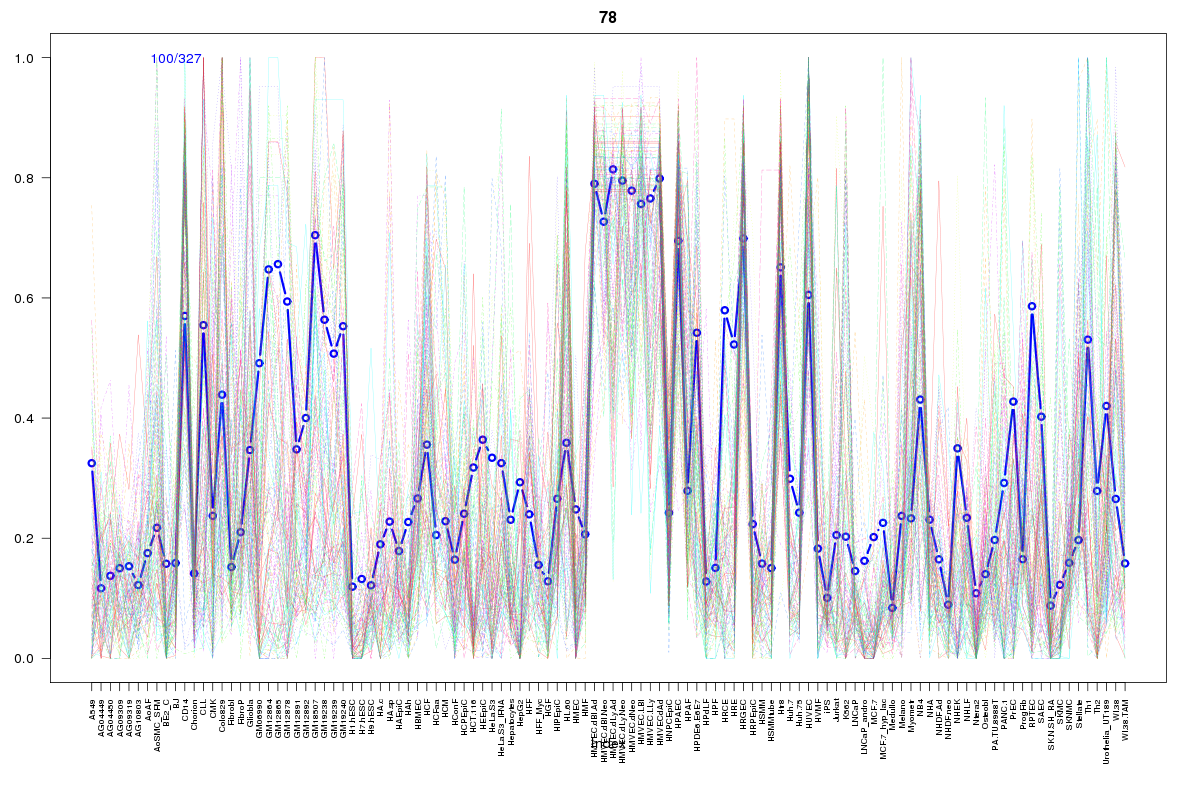 | 78 | 1 |
 | 1970 | 1 |
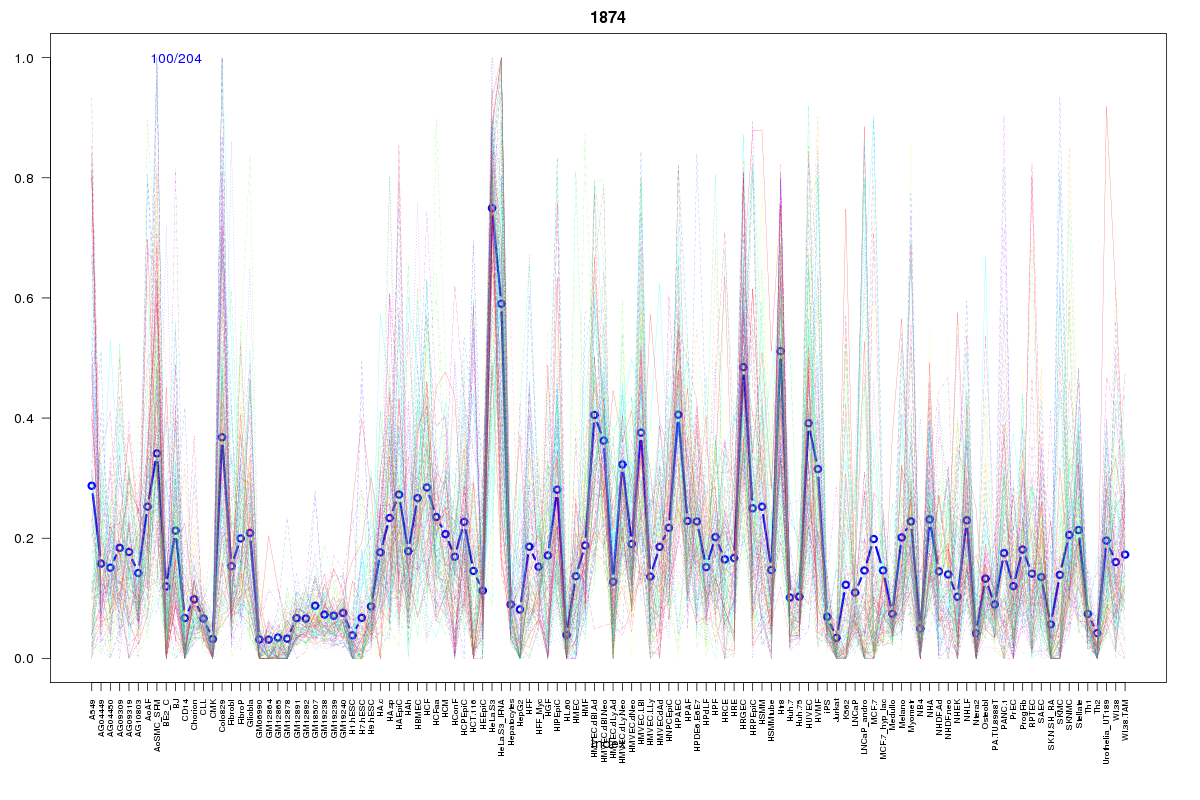 | 1874 | 1 |
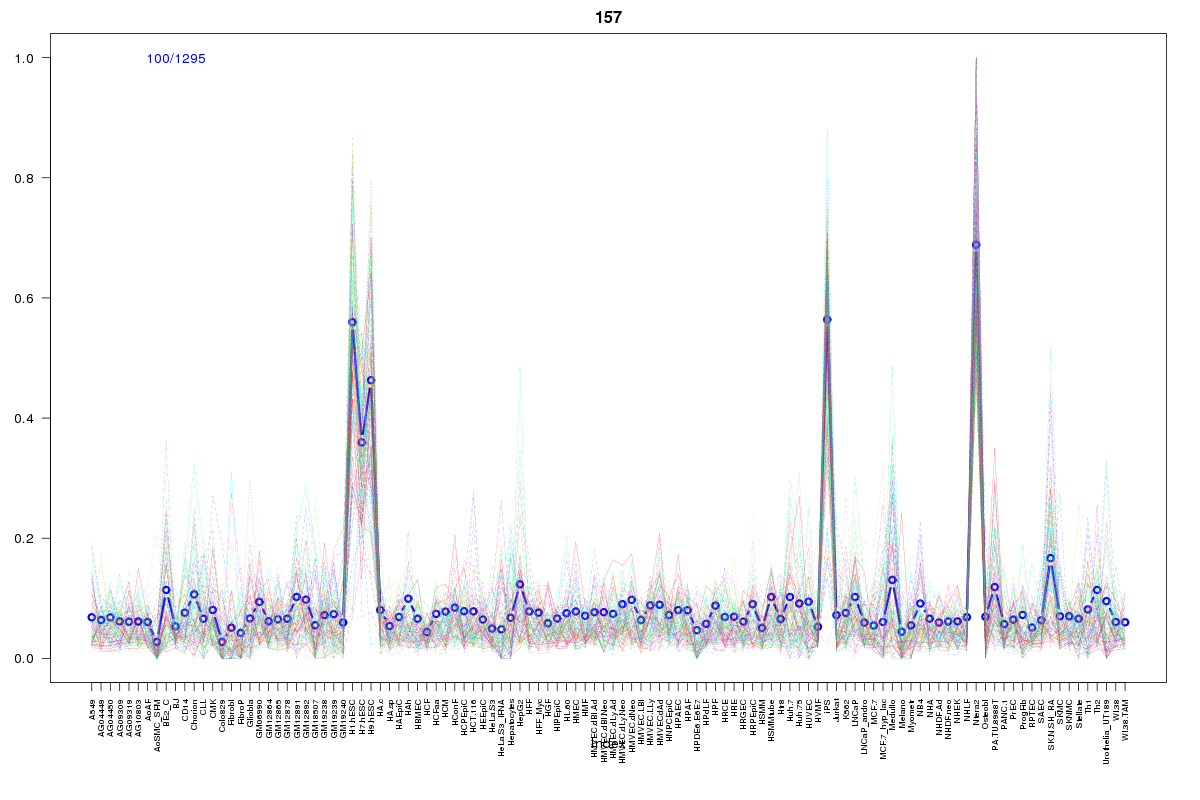 | 157 | 1 |
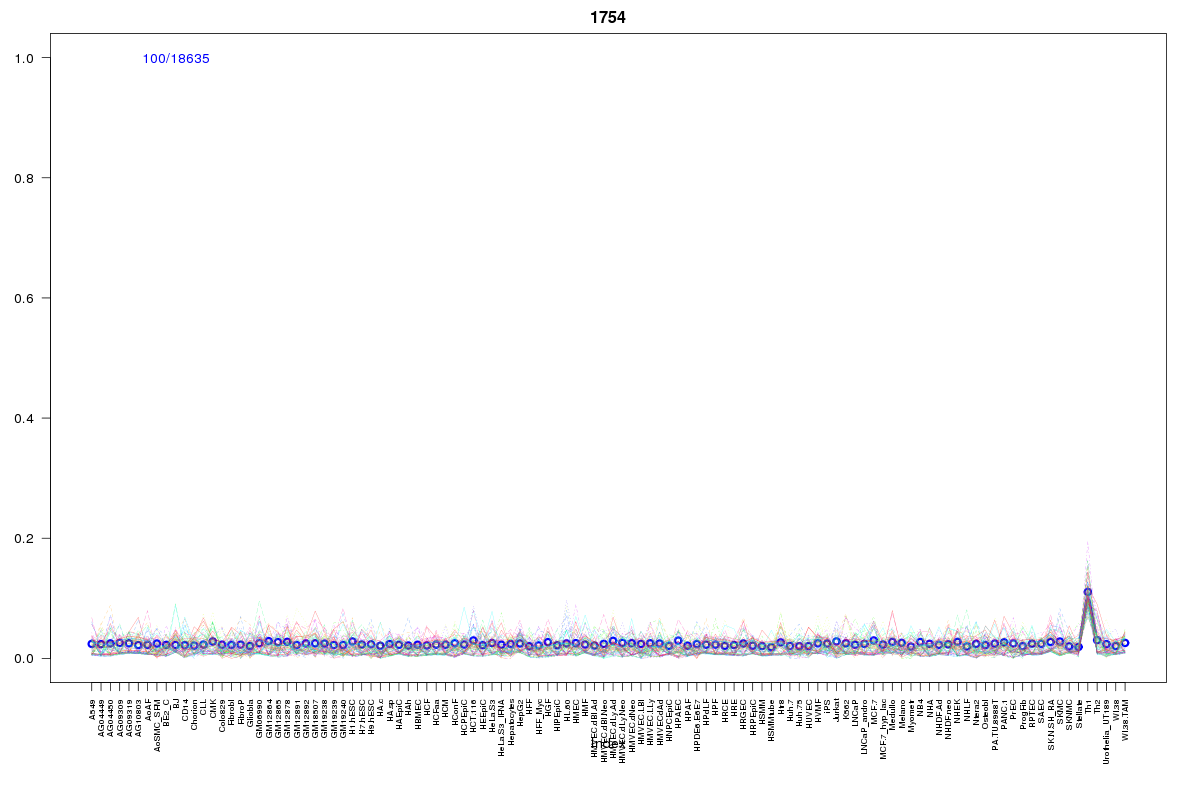 | 1754 | 1 |
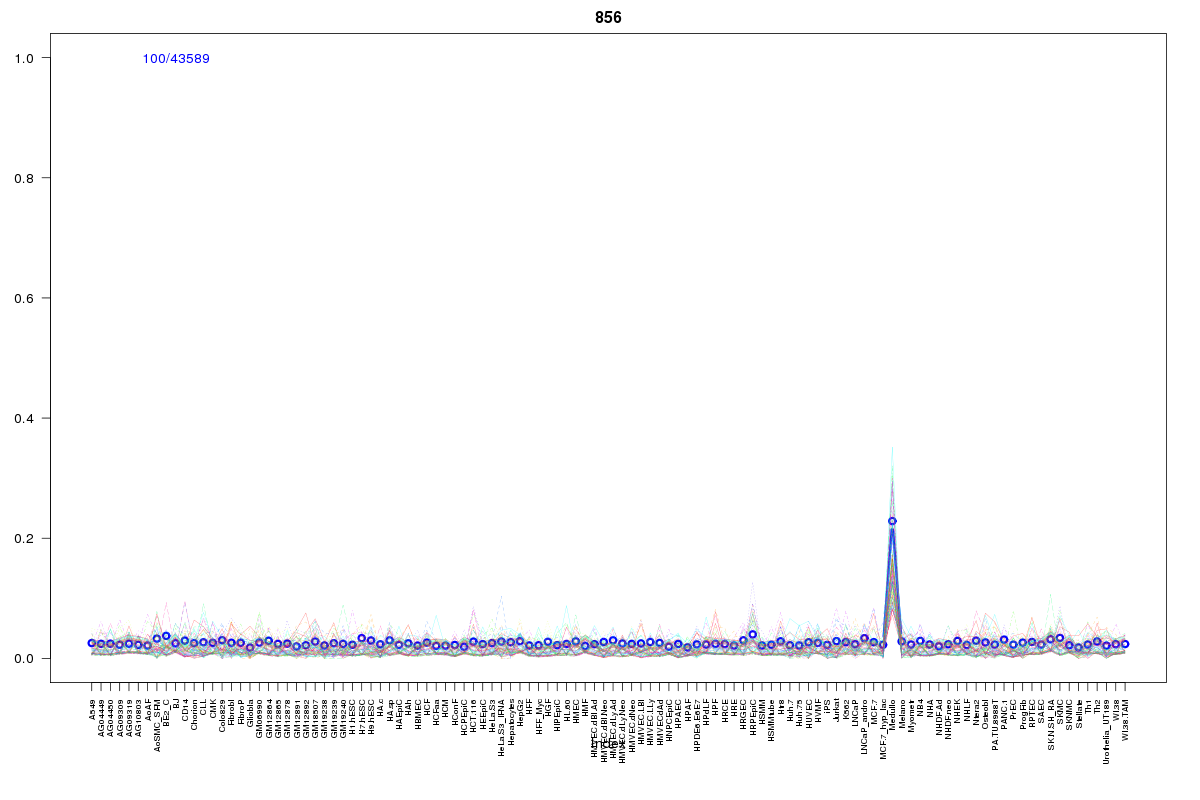 | 856 | 1 |
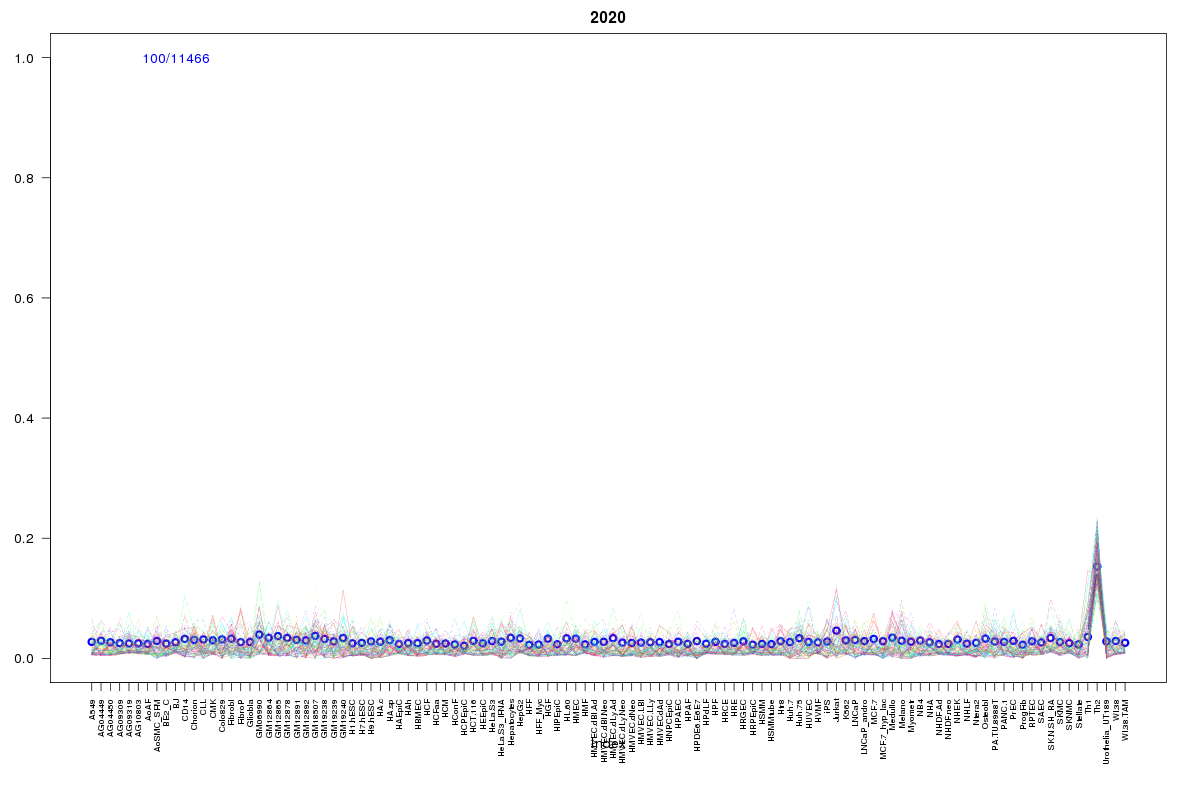 | 2020 | 1 |
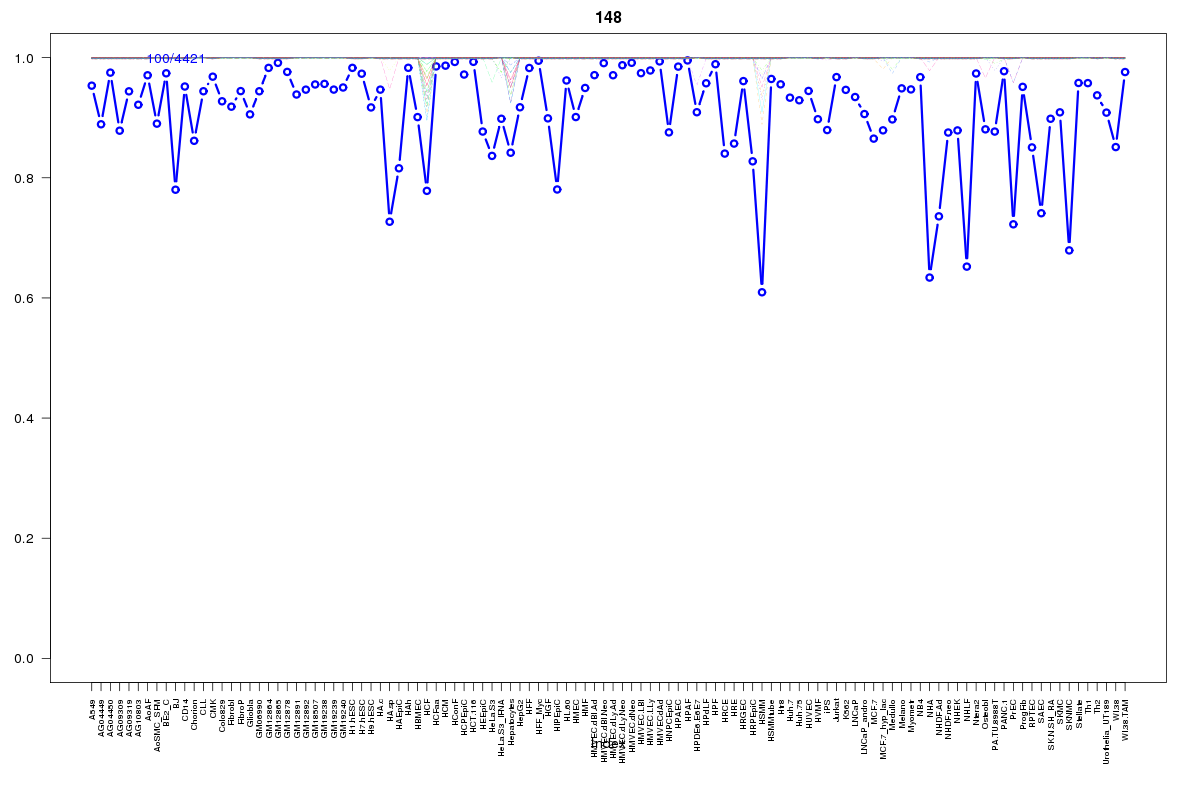 | 148 | 1 |
 | 1078 | 1 |
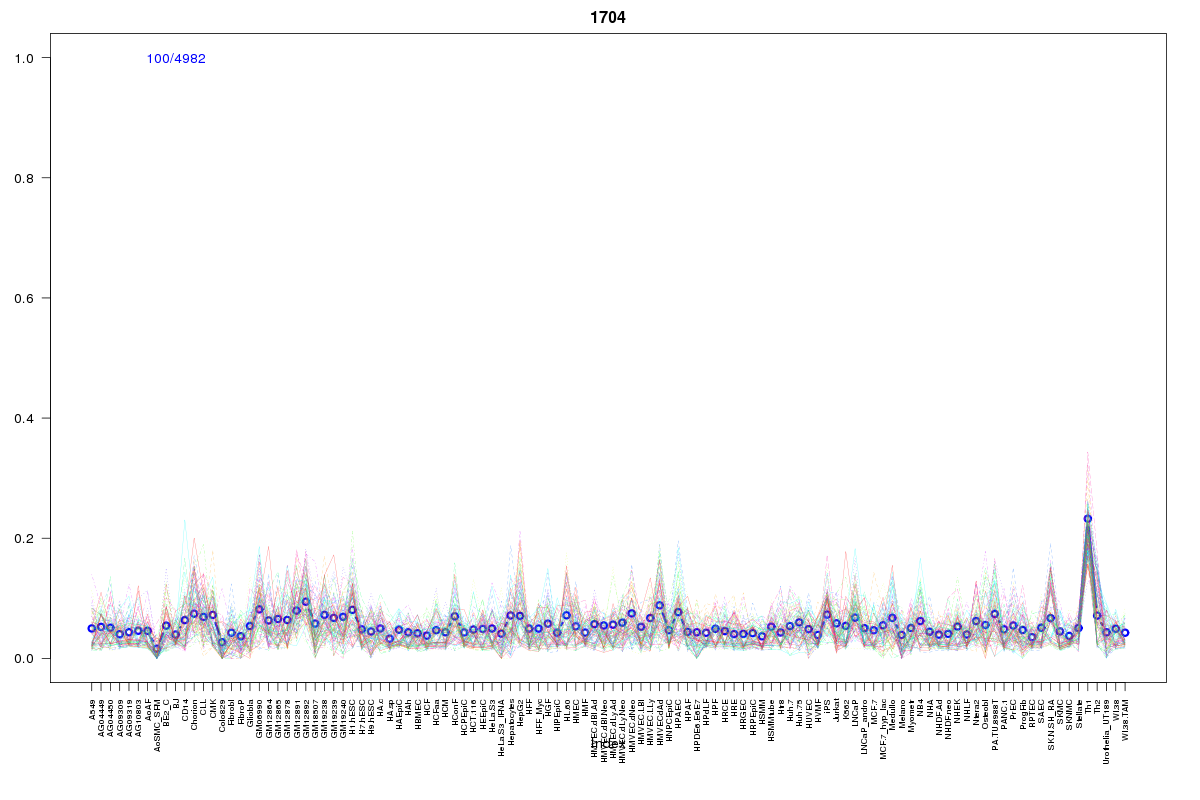 | 1704 | 1 |
Resources
BED file downloads
Connects to 33 DHS sitesTop 10 Correlated DHS Sites
p-values indiciate significant higher or lower correlation| Location | Cluster | P-value |
|---|---|---|
| chr1:16767880-16768030 | 610 | 0 |
| chr1:16694160-16694310 | 83 | 0 |
| chr1:16709785-16709935 | 1754 | 0.001 |
| chr1:16731405-16731555 | 1704 | 0.001 |
| chr1:16698420-16698570 | 78 | 0.001 |
| chr1:16769065-16769215 | 1755 | 0.001 |
| chr1:16694320-16694470 | 130 | 0.001 |
| chr1:16679185-16679335 | 1360 | 0.005 |
| chr1:16747560-16747710 | 2062 | 0.007 |
| chr1:16729660-16729810 | 1955 | 0.007 |
| chr1:16802105-16802255 | 1970 | 0.008 |
External Databases
UCSCEnsembl (ENSG00000157191)