Gene: TSPAN18
chr11: 44748014-44940869Expression Profile
(log scale)
Graphical Connections
Distribution of linked clusters:
You may find it interesting if many of the connected DHS sites belong to the same cluster.| Cluster Profile | Cluster ID | Number of DHS sites in this cluster |
|---|---|---|
 | 687 | 13 |
 | 934 | 8 |
 | 979 | 6 |
 | 935 | 5 |
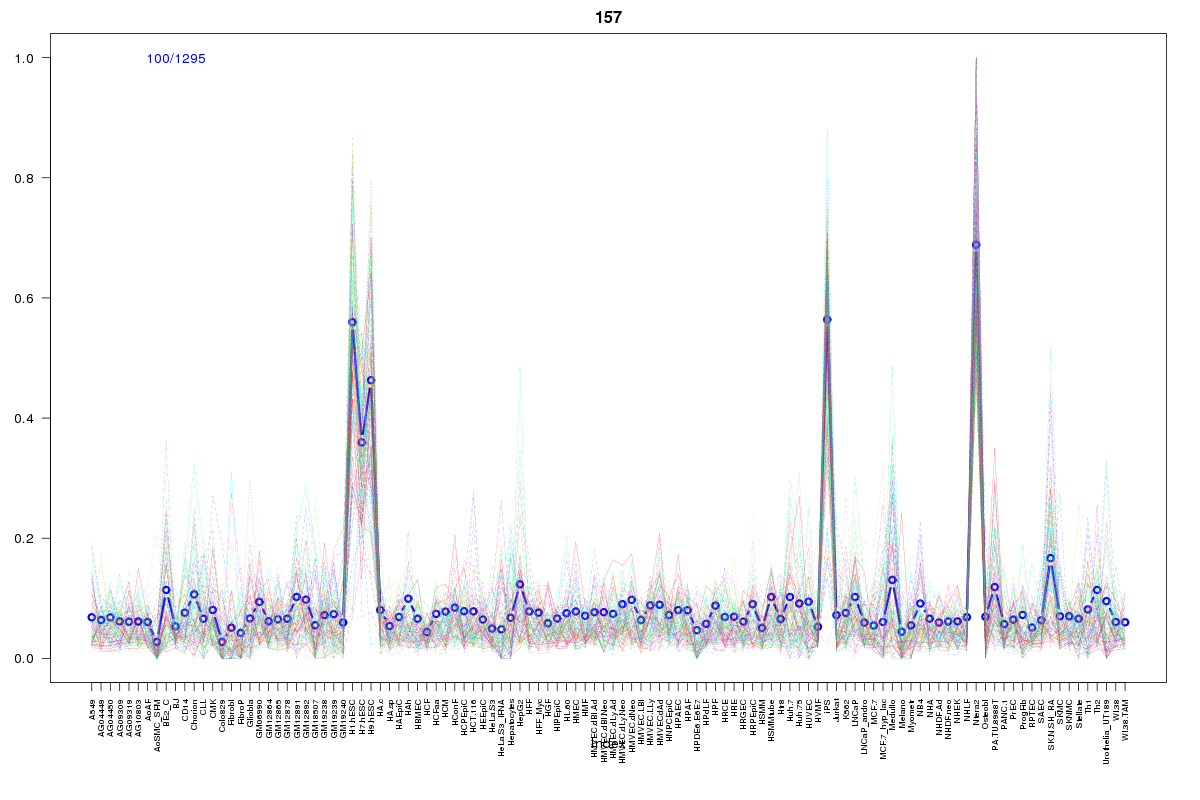 | 157 | 4 |
 | 10 | 4 |
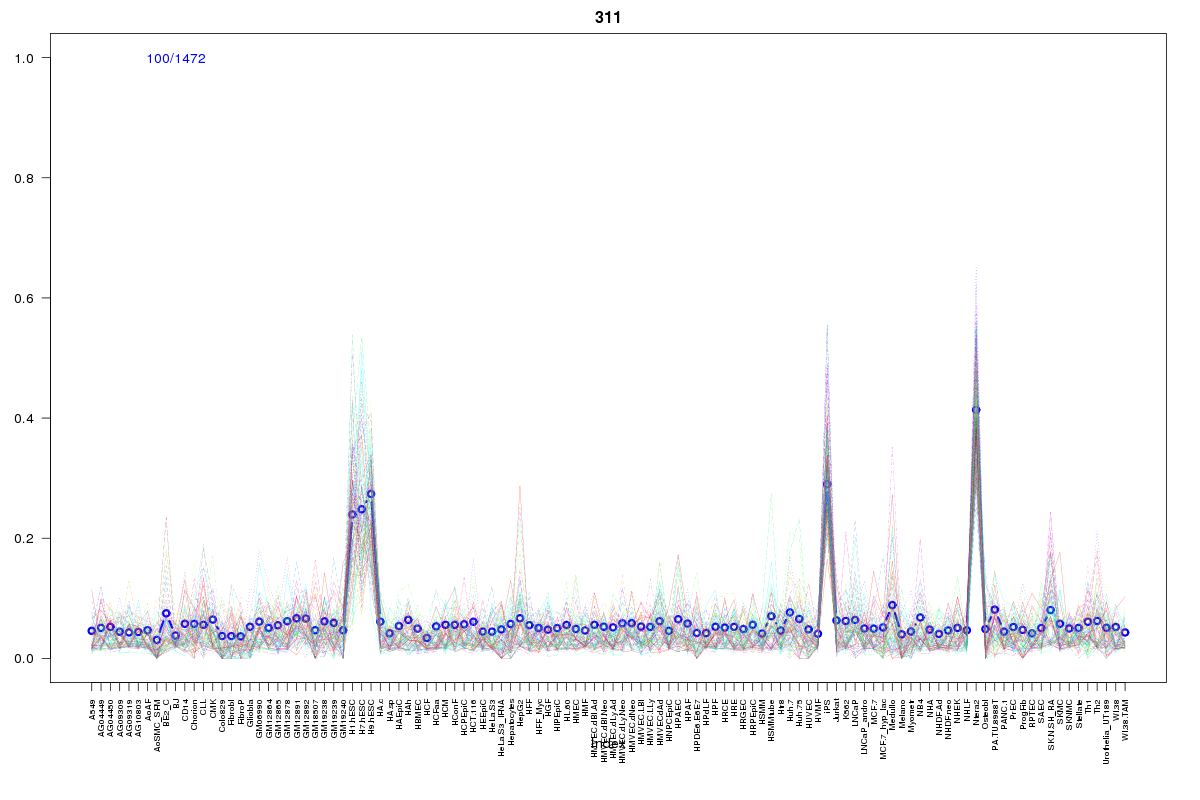 | 311 | 3 |
 | 402 | 3 |
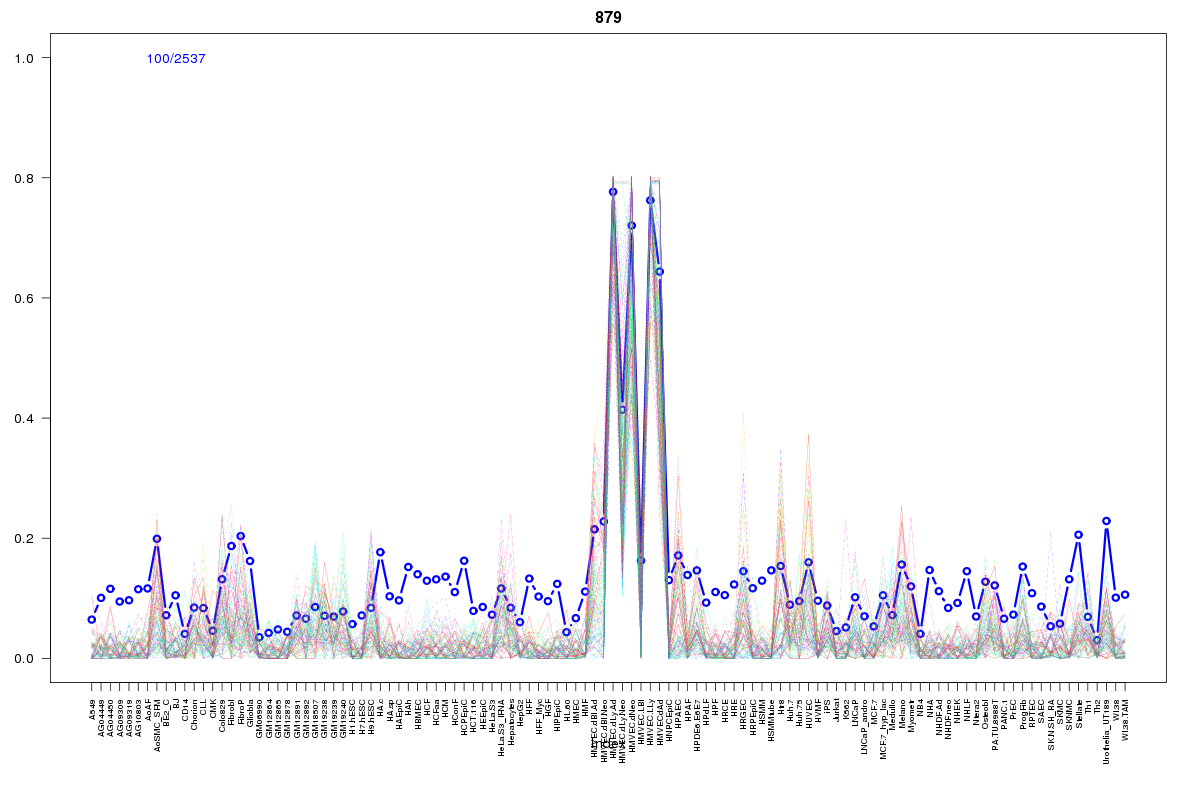 | 879 | 3 |
 | 952 | 2 |
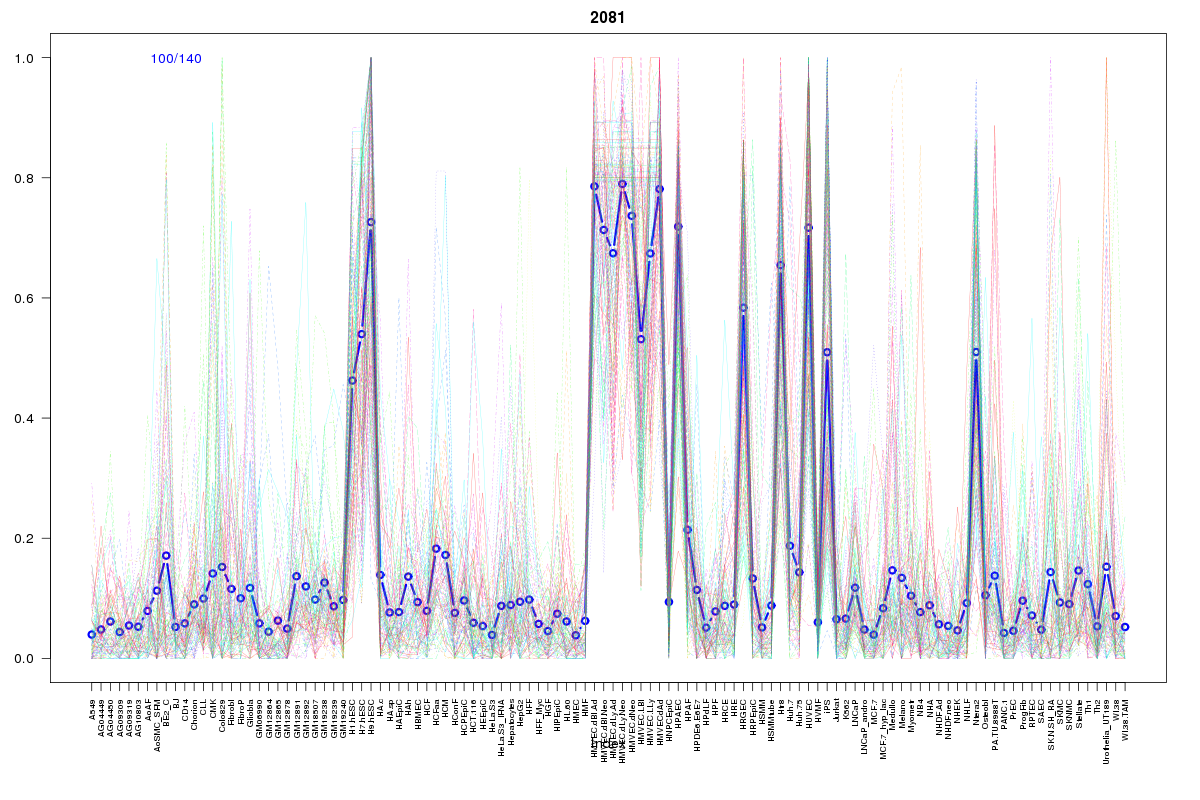 | 2081 | 2 |
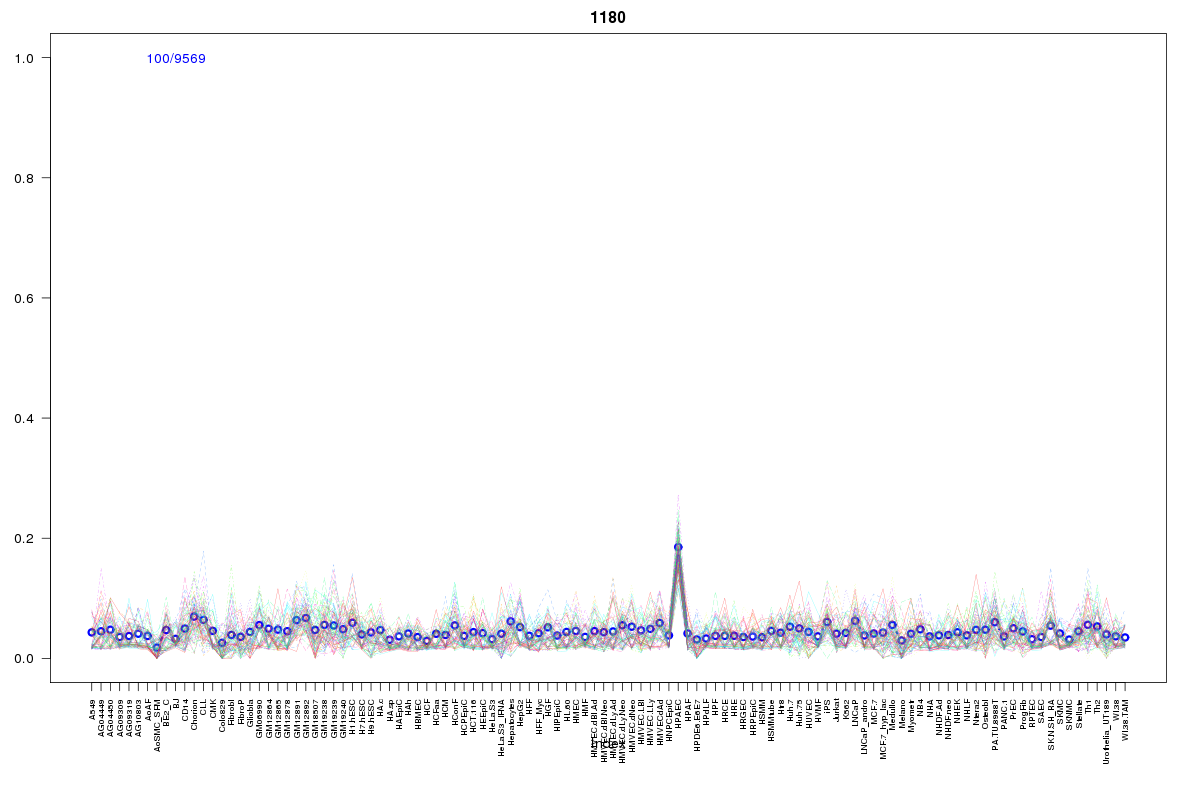 | 1180 | 2 |
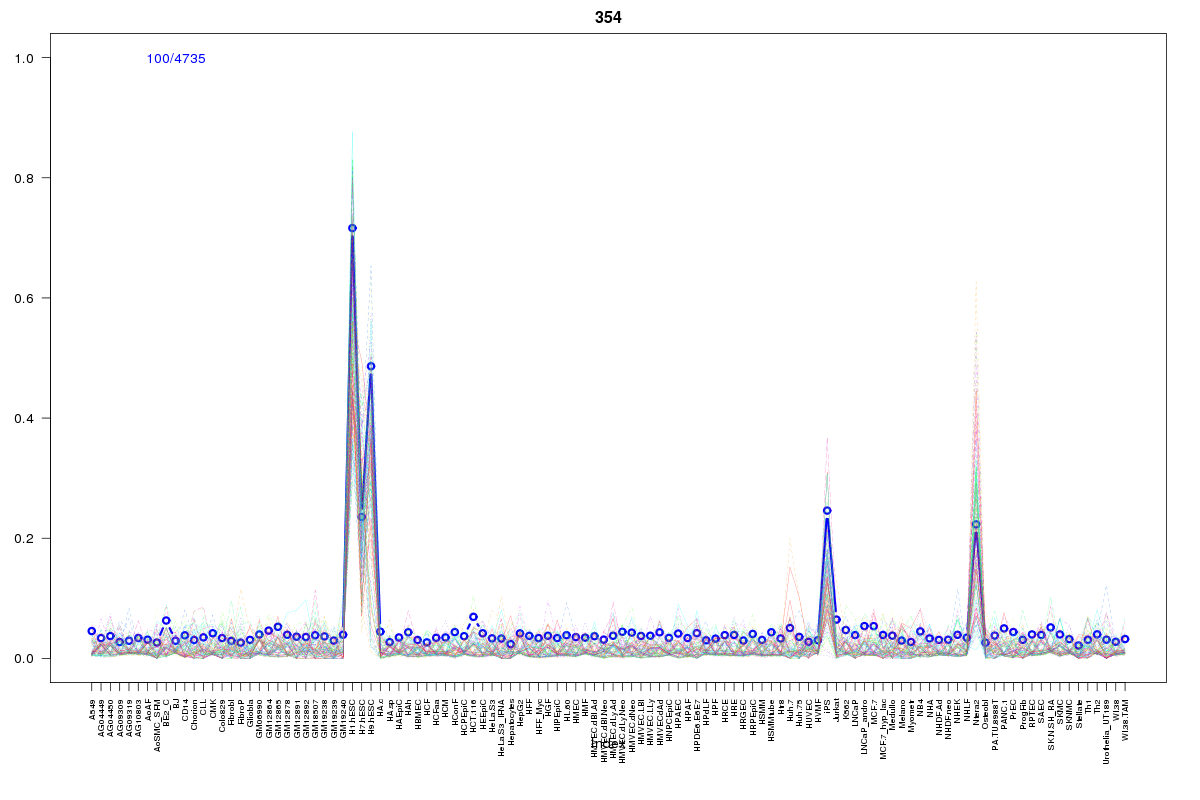 | 354 | 2 |
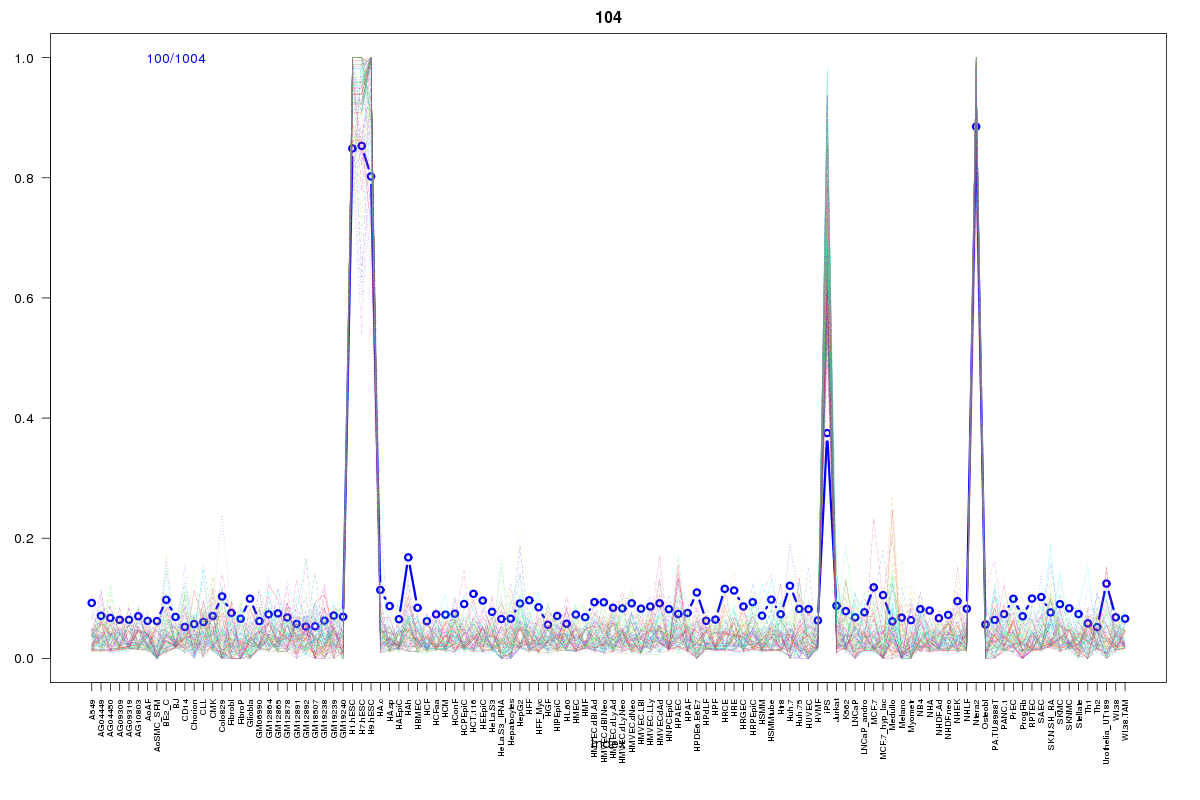 | 104 | 2 |
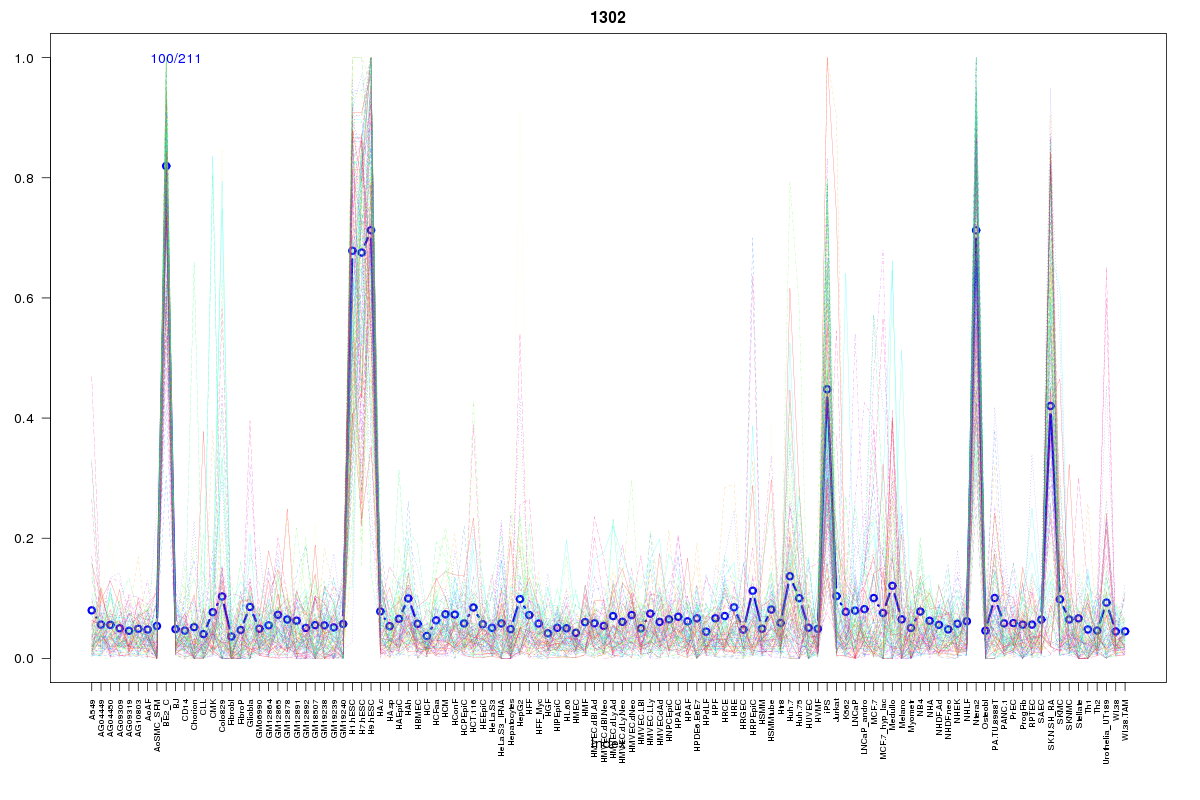 | 1302 | 2 |
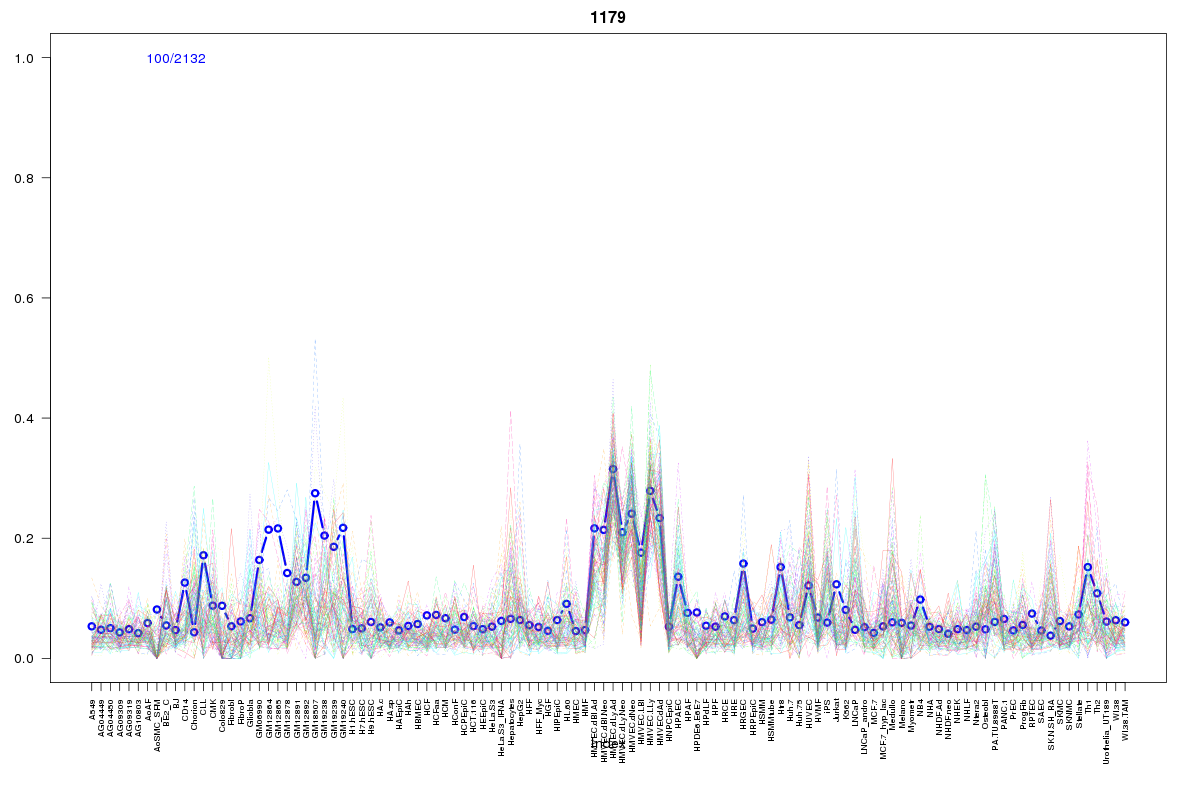 | 1179 | 2 |
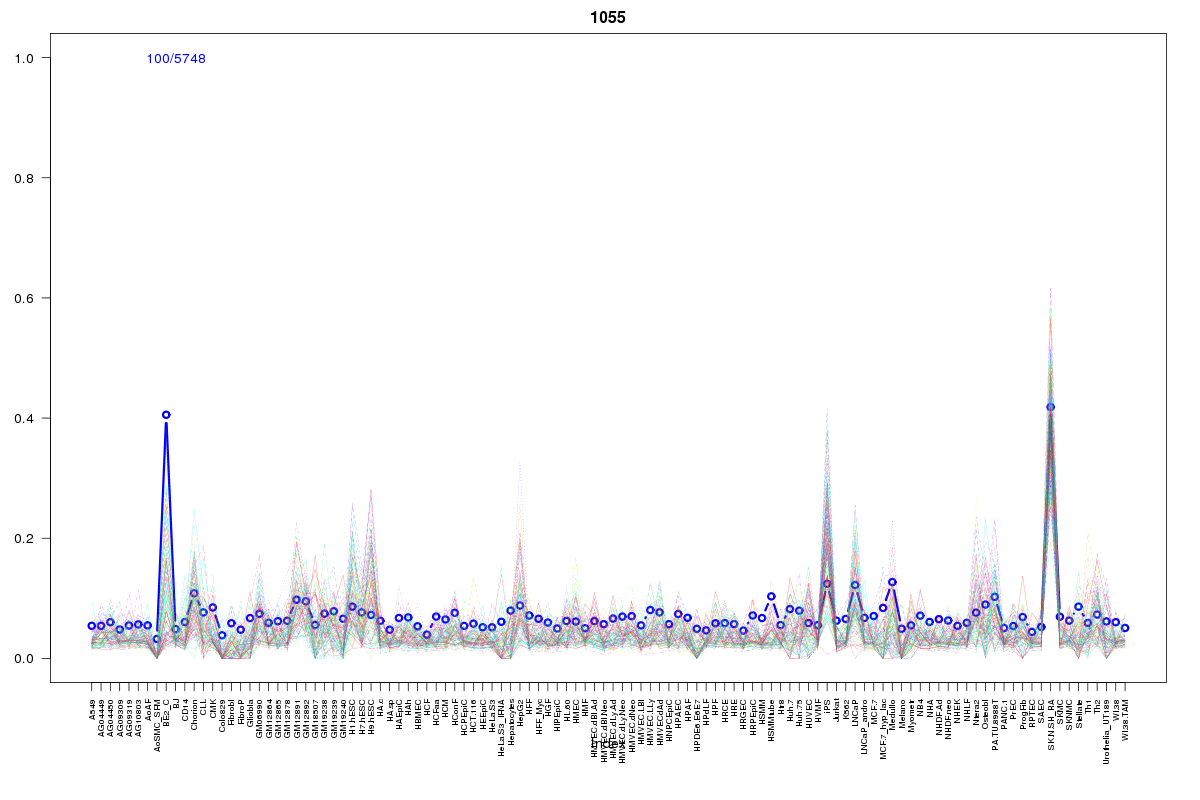 | 1055 | 2 |
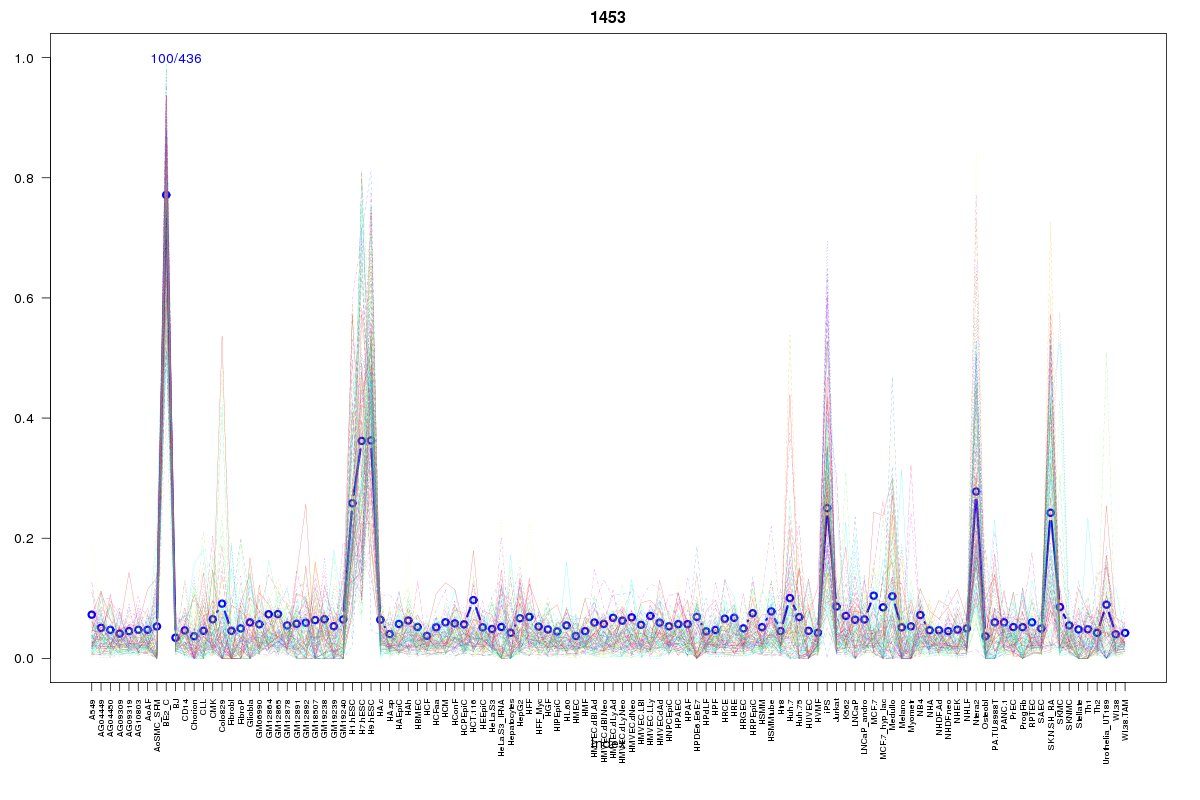 | 1453 | 2 |
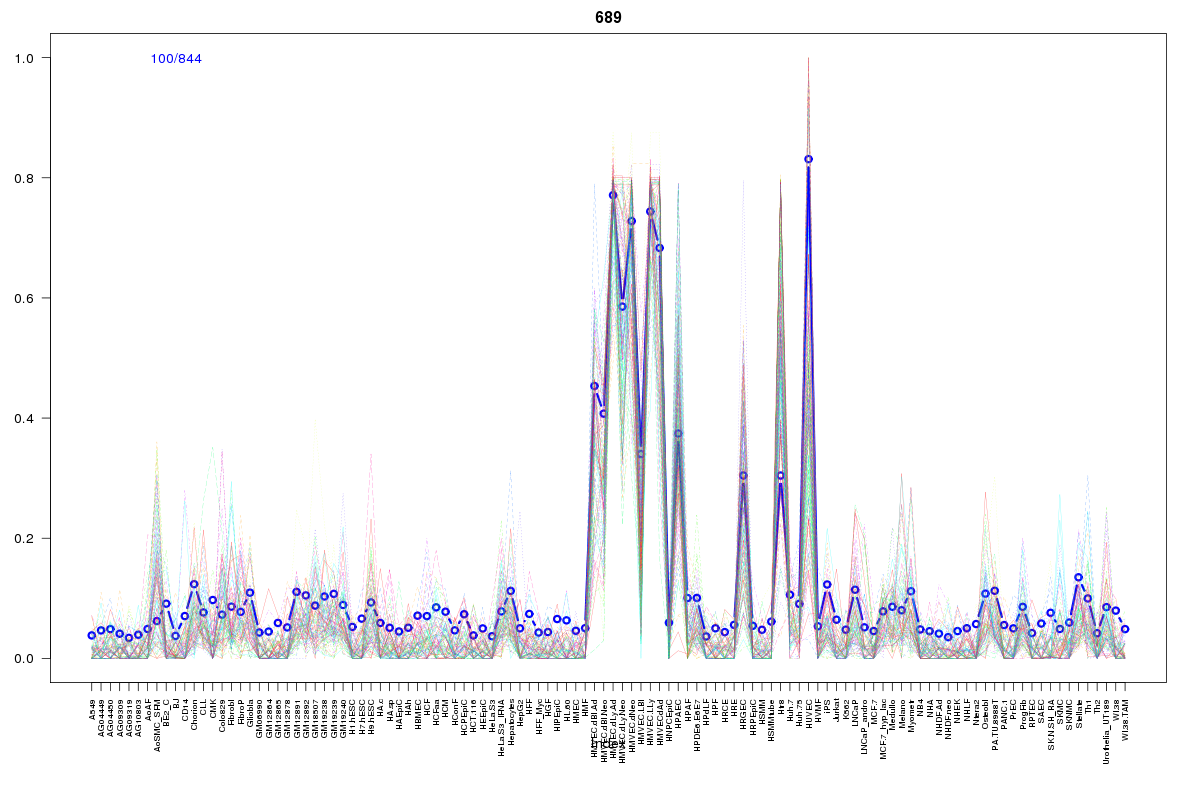 | 689 | 2 |
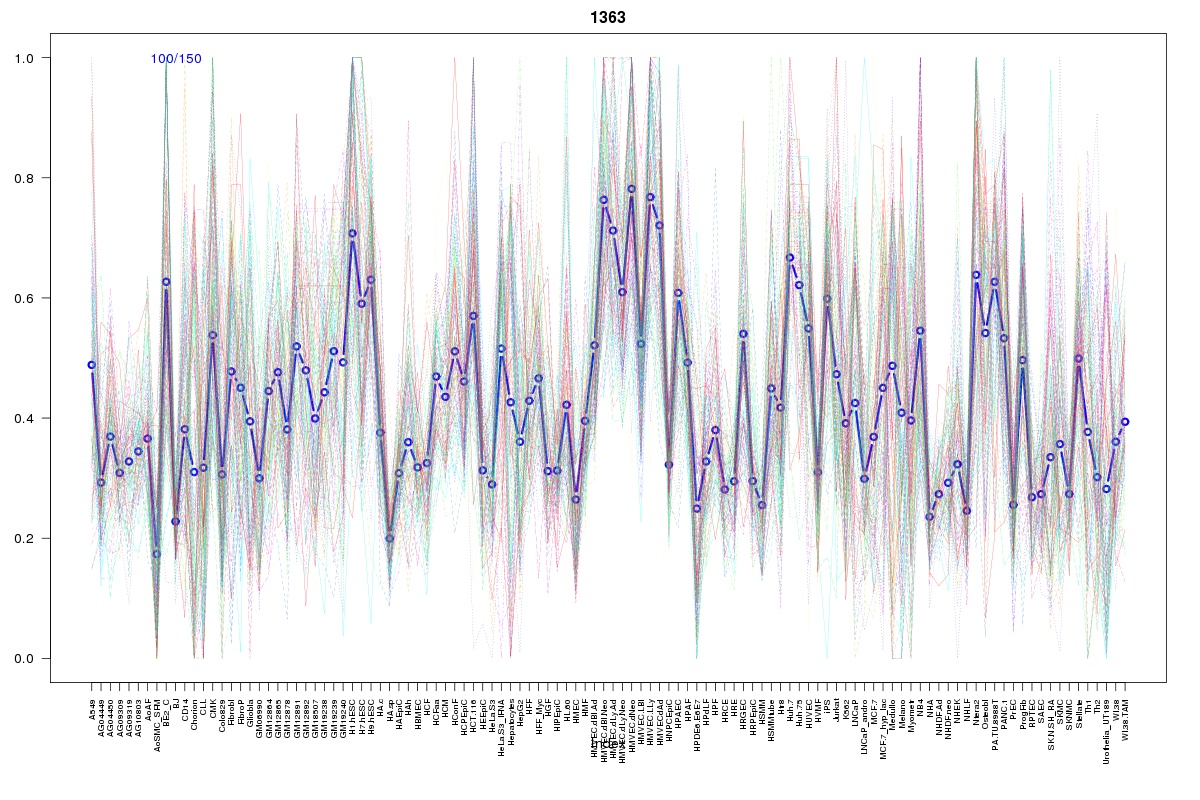 | 1363 | 2 |
 | 502 | 2 |
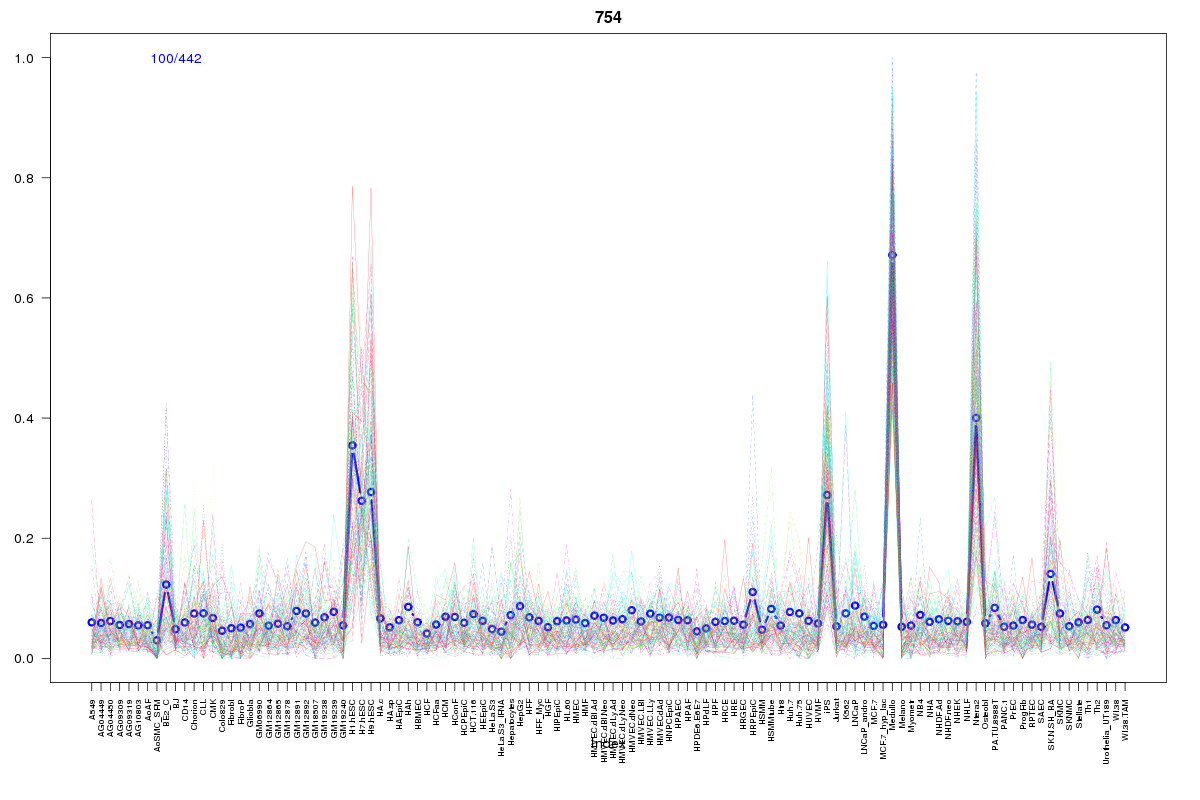 | 754 | 2 |
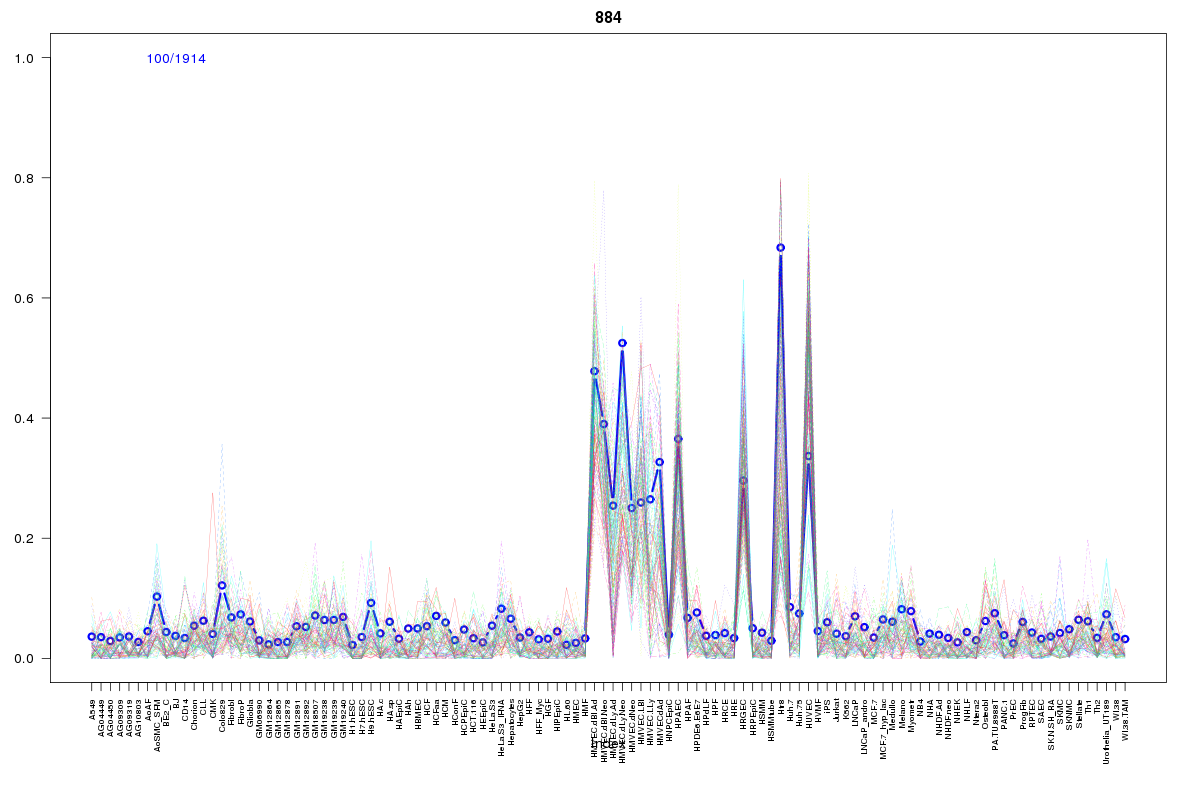 | 884 | 2 |
 | 860 | 2 |
 | 251 | 2 |
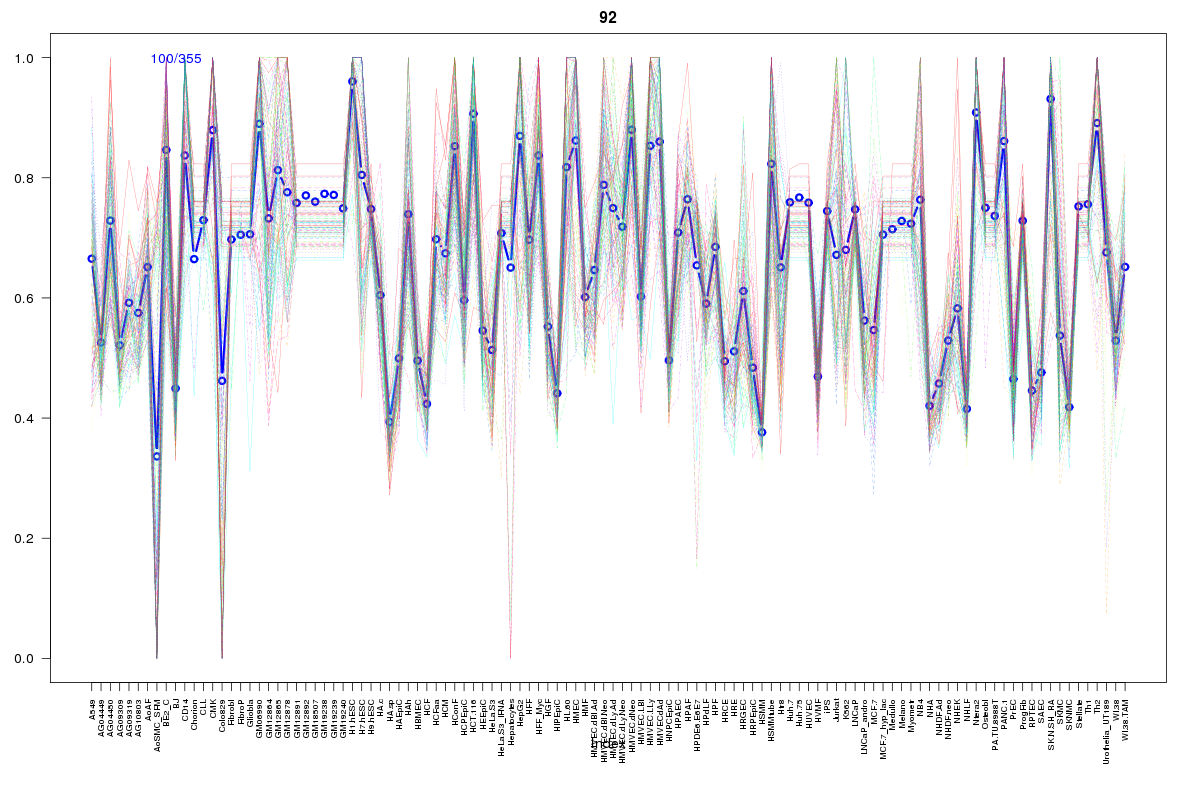 | 92 | 1 |
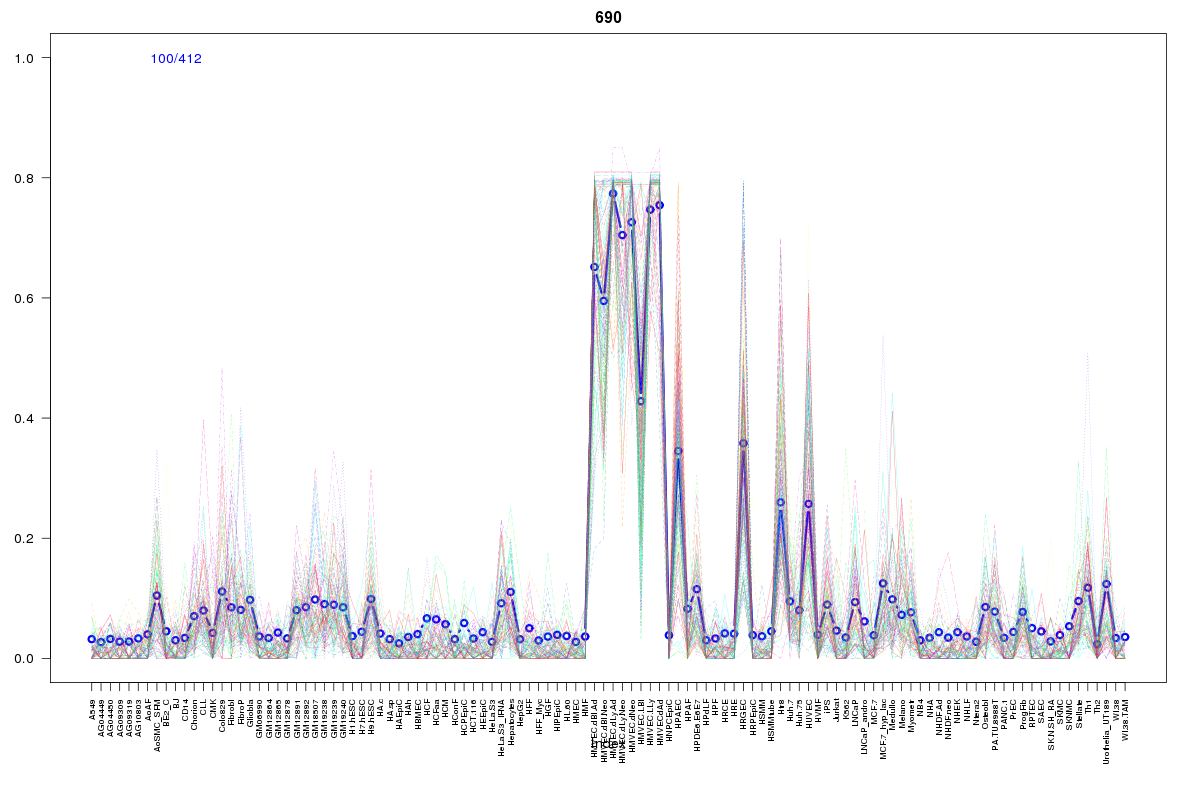 | 690 | 1 |
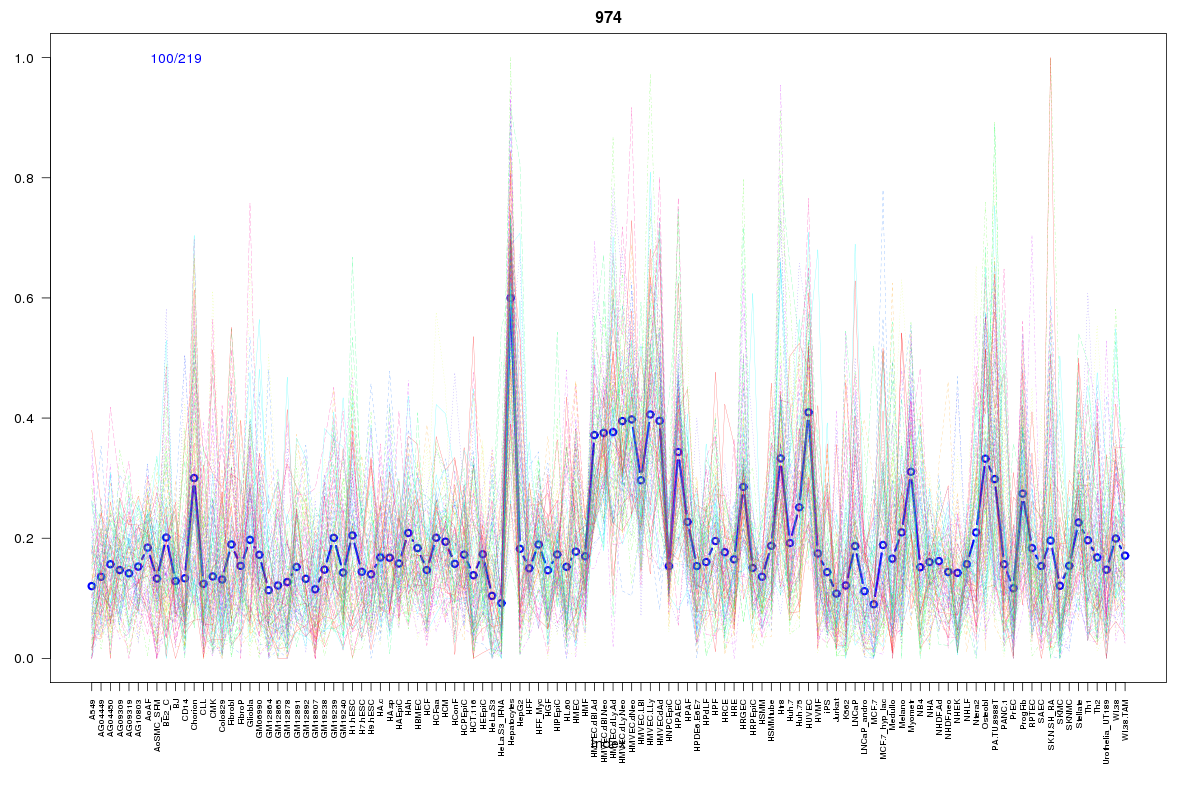 | 974 | 1 |
 | 108 | 1 |
 | 2052 | 1 |
 | 2279 | 1 |
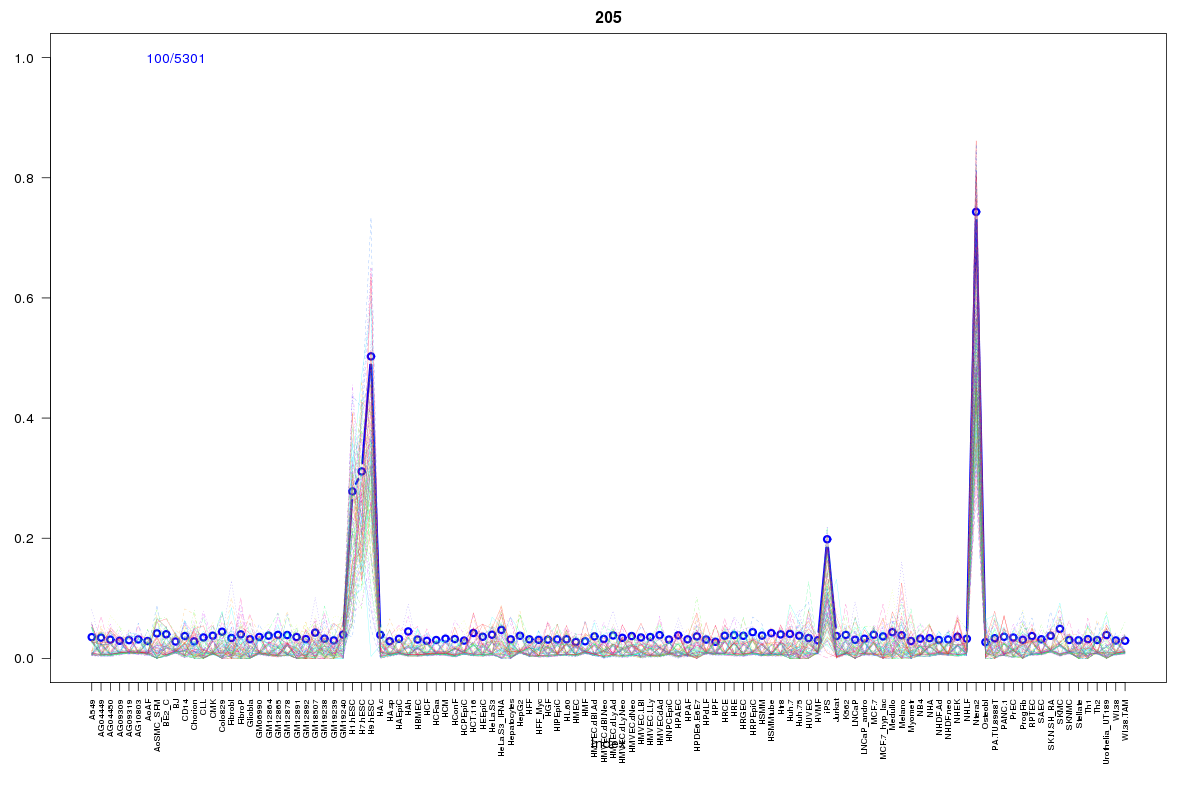 | 205 | 1 |
 | 1008 | 1 |
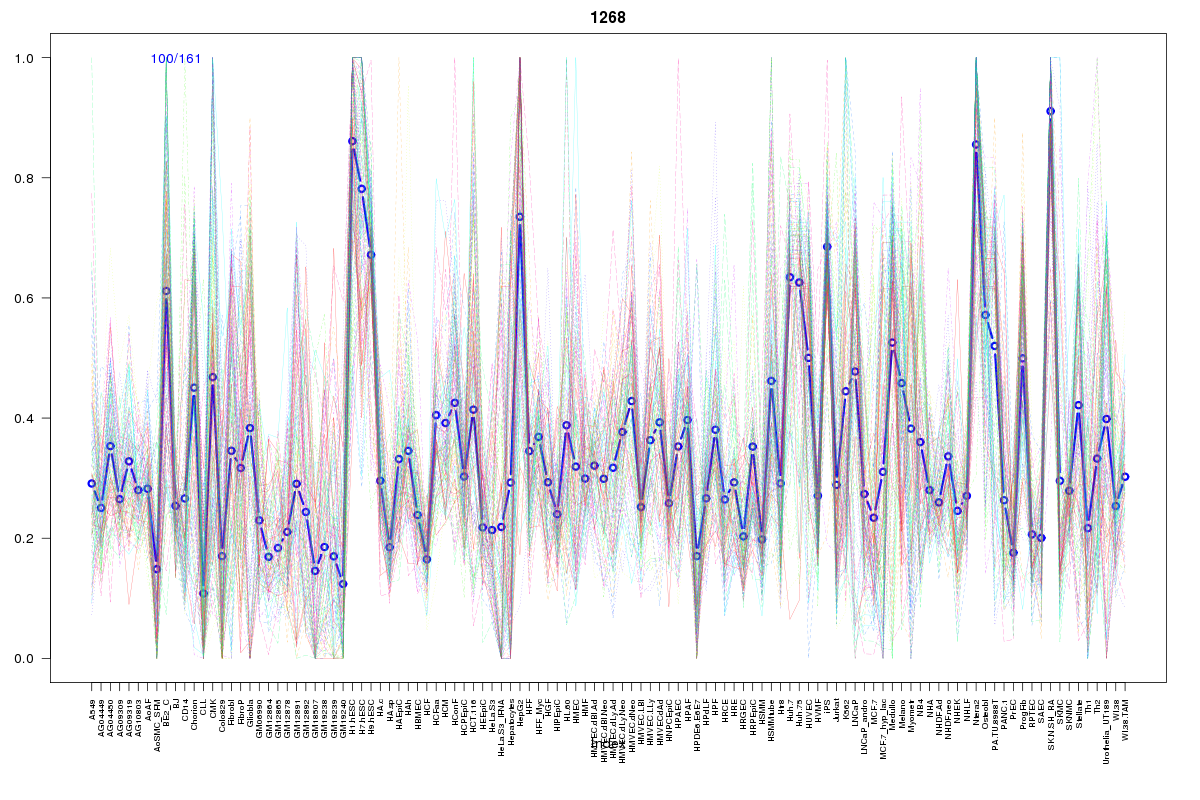 | 1268 | 1 |
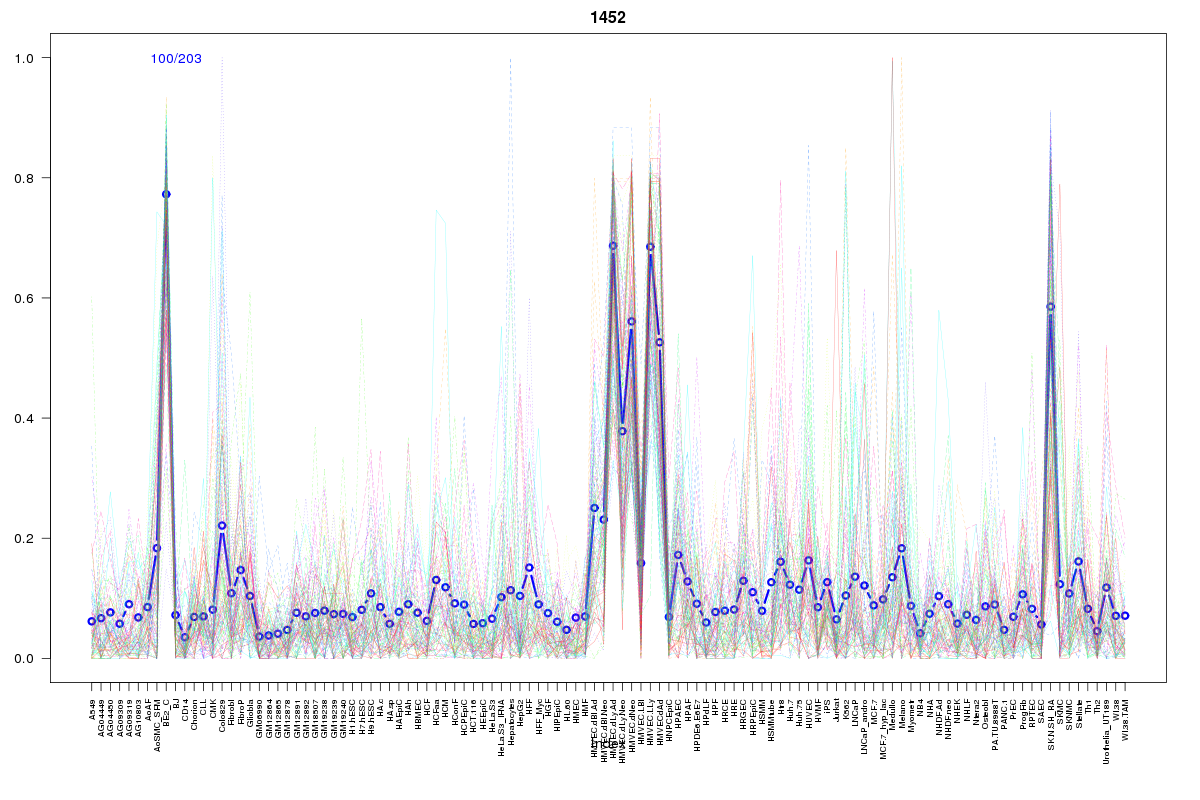 | 1452 | 1 |
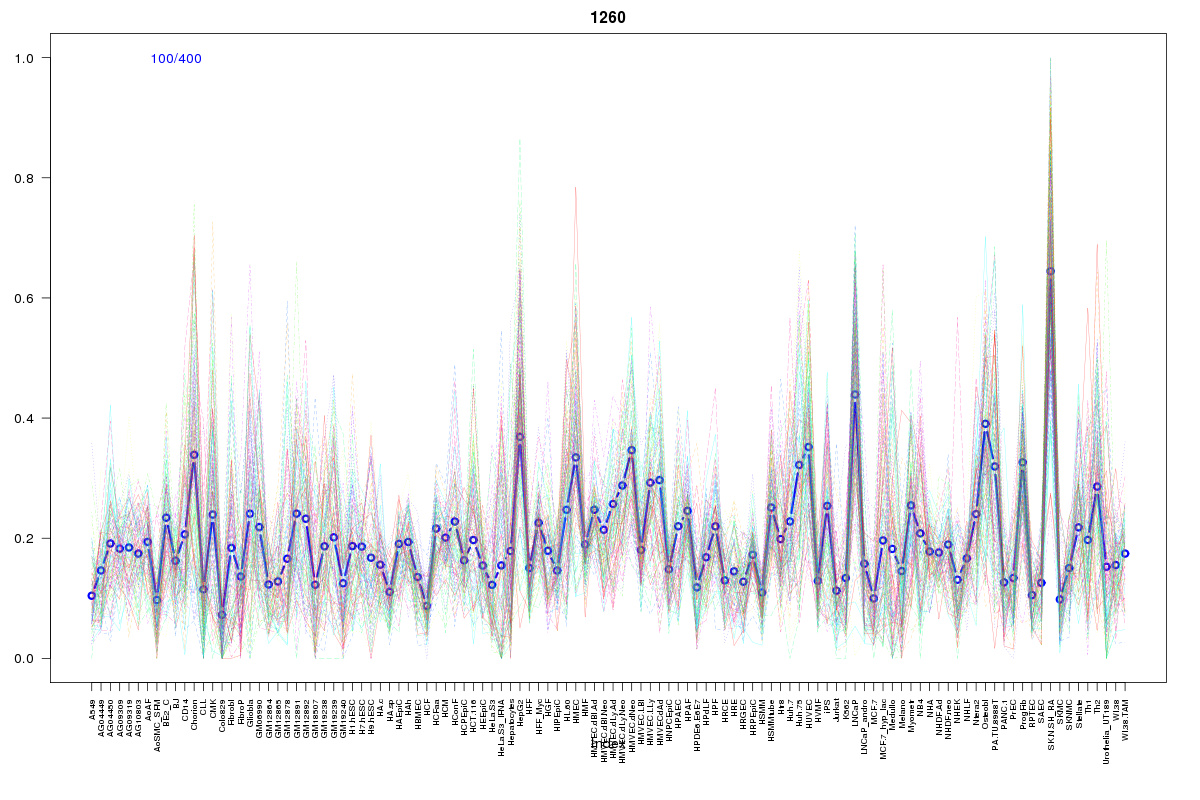 | 1260 | 1 |
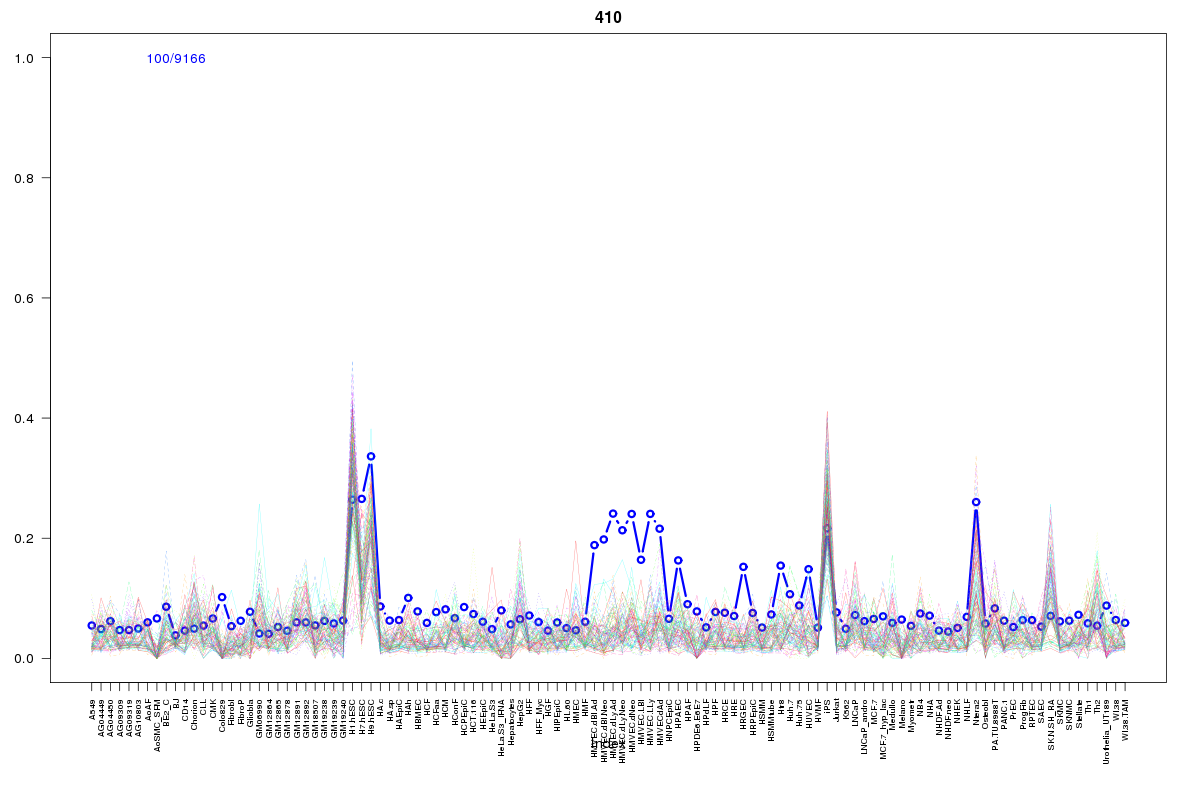 | 410 | 1 |
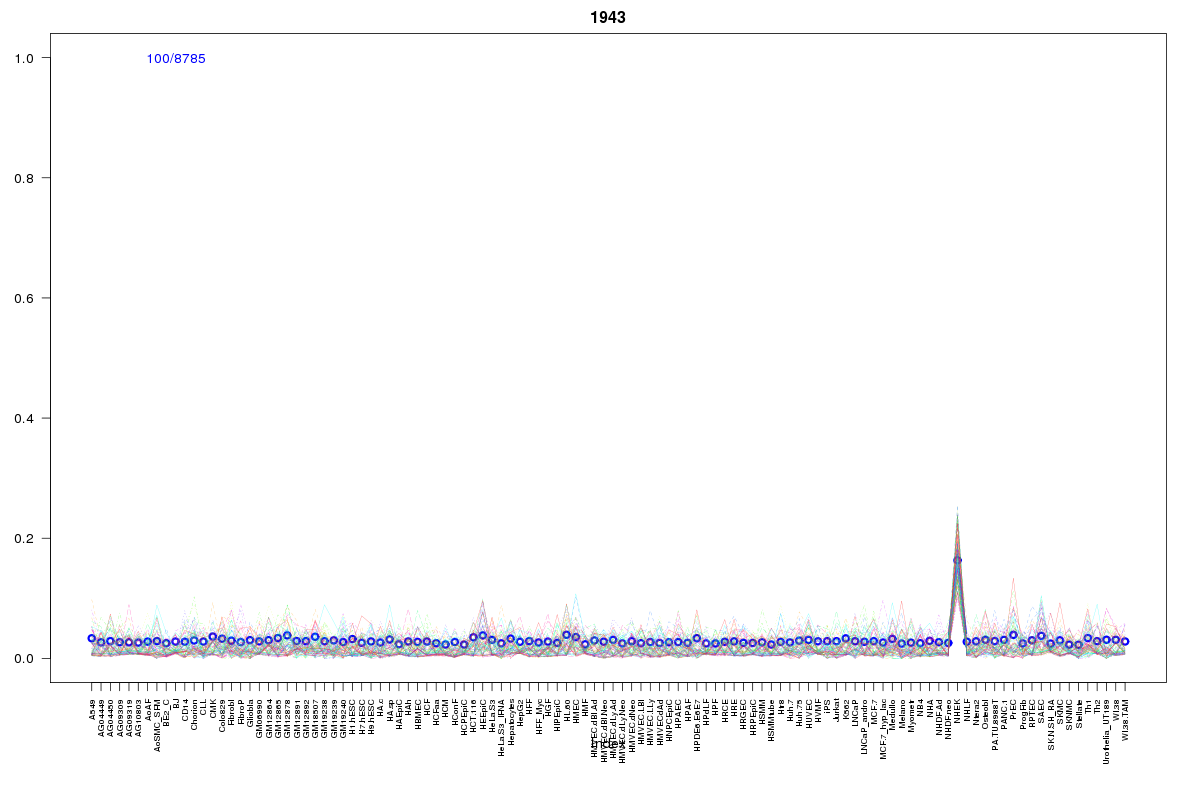 | 1943 | 1 |
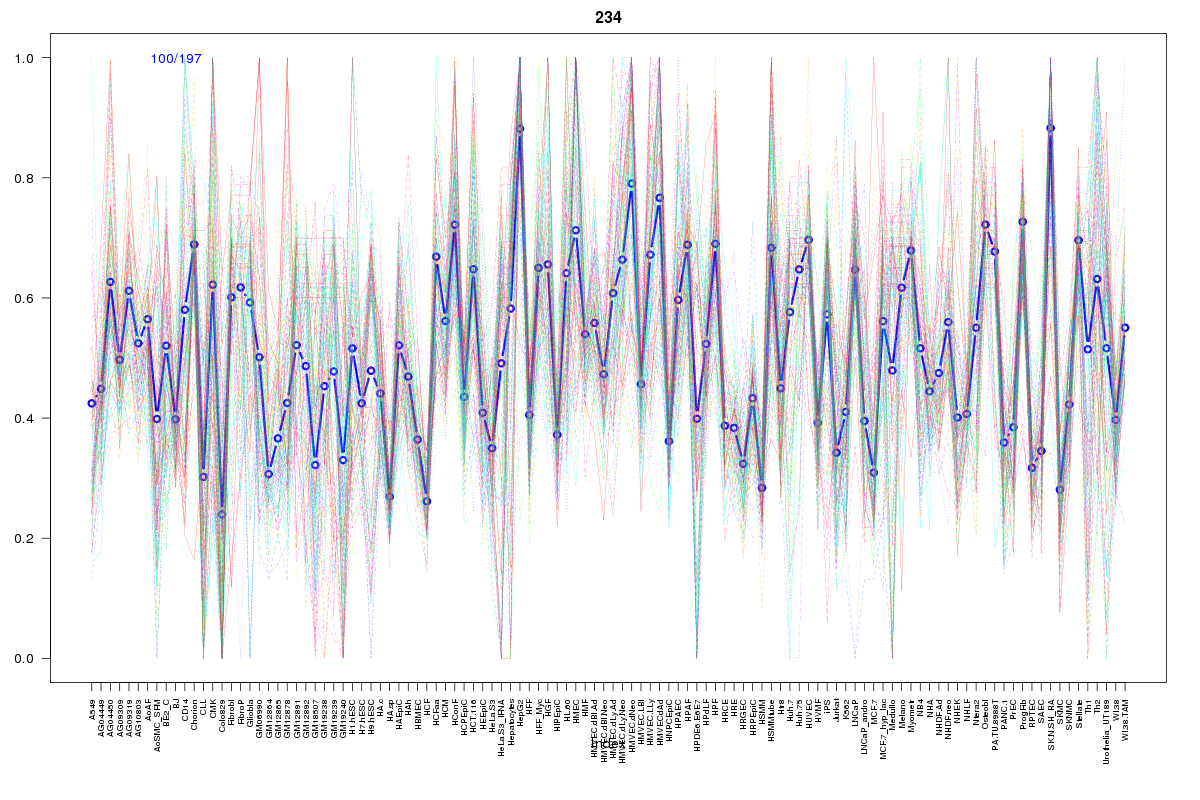 | 234 | 1 |
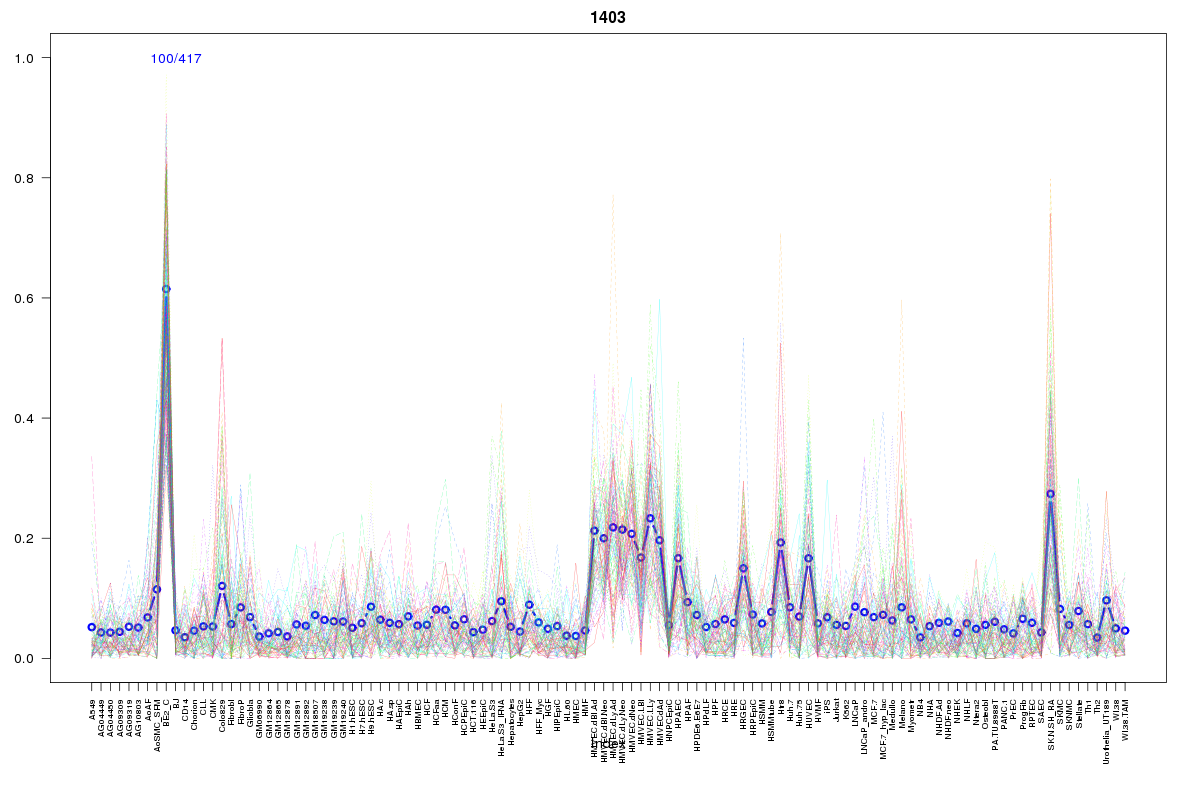 | 1403 | 1 |
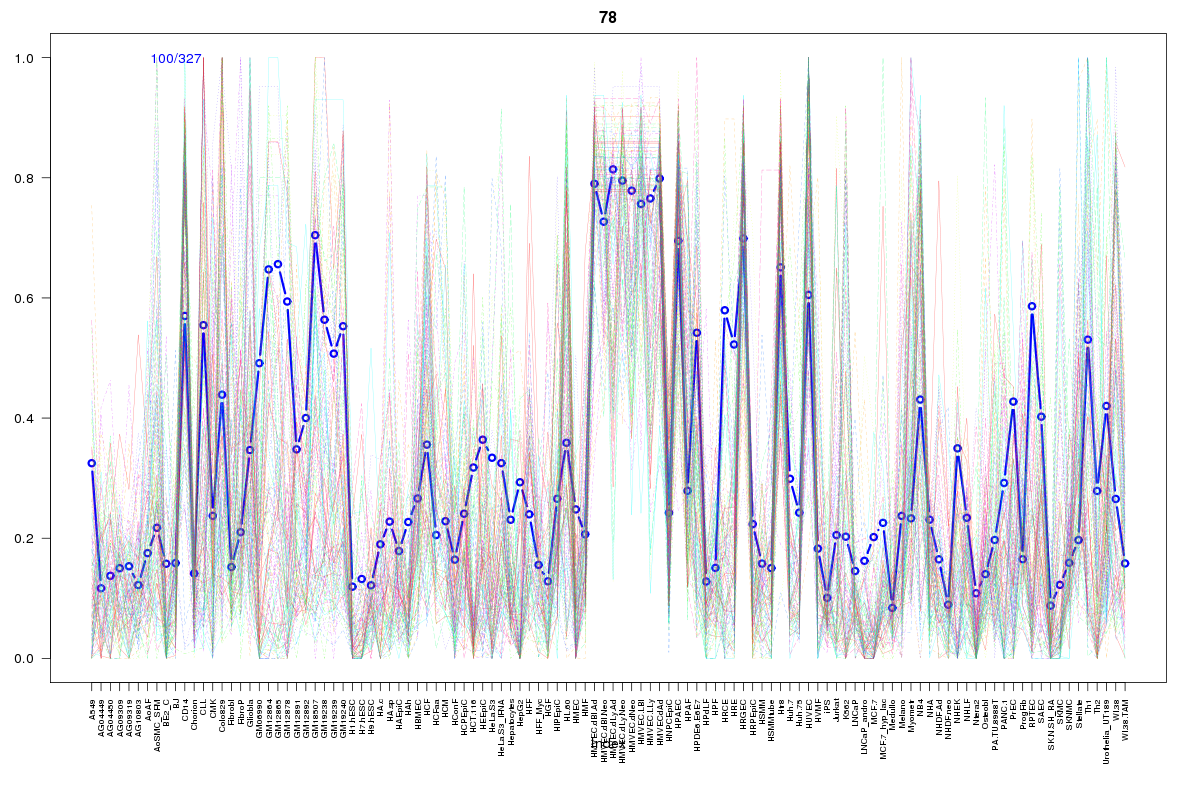 | 78 | 1 |
 | 655 | 1 |
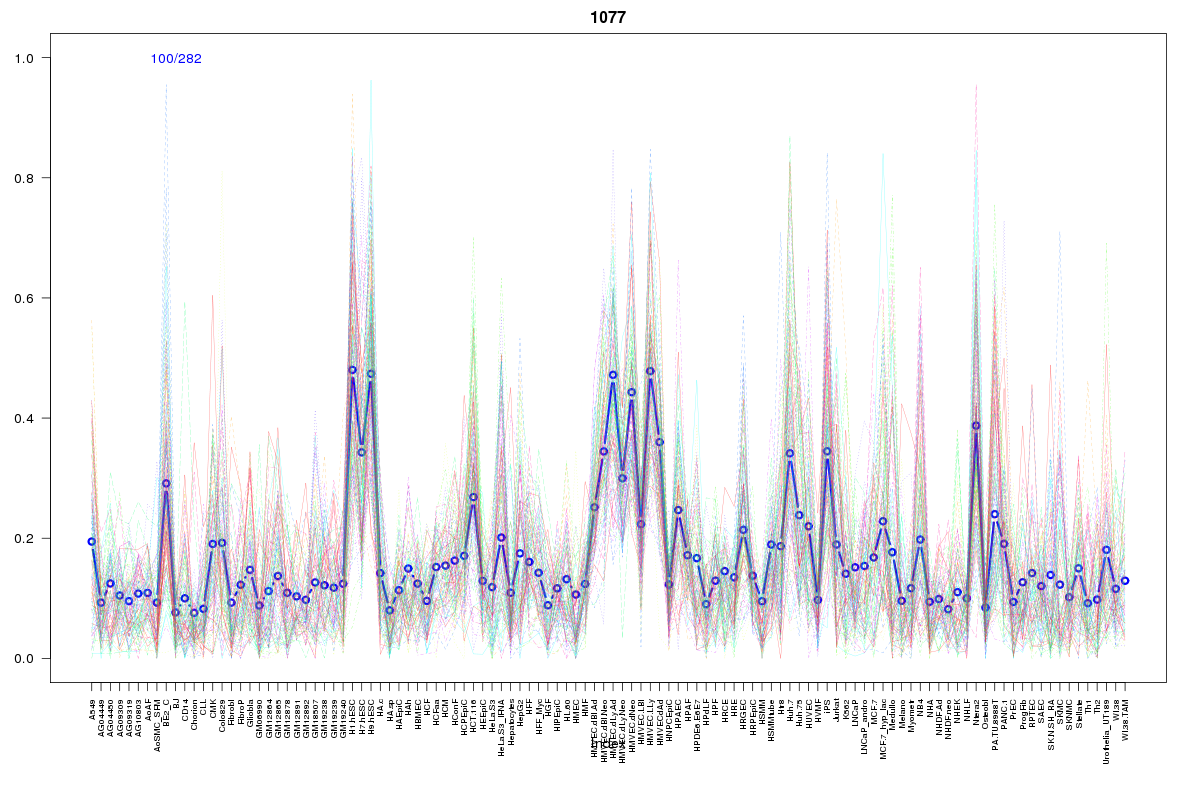 | 1077 | 1 |
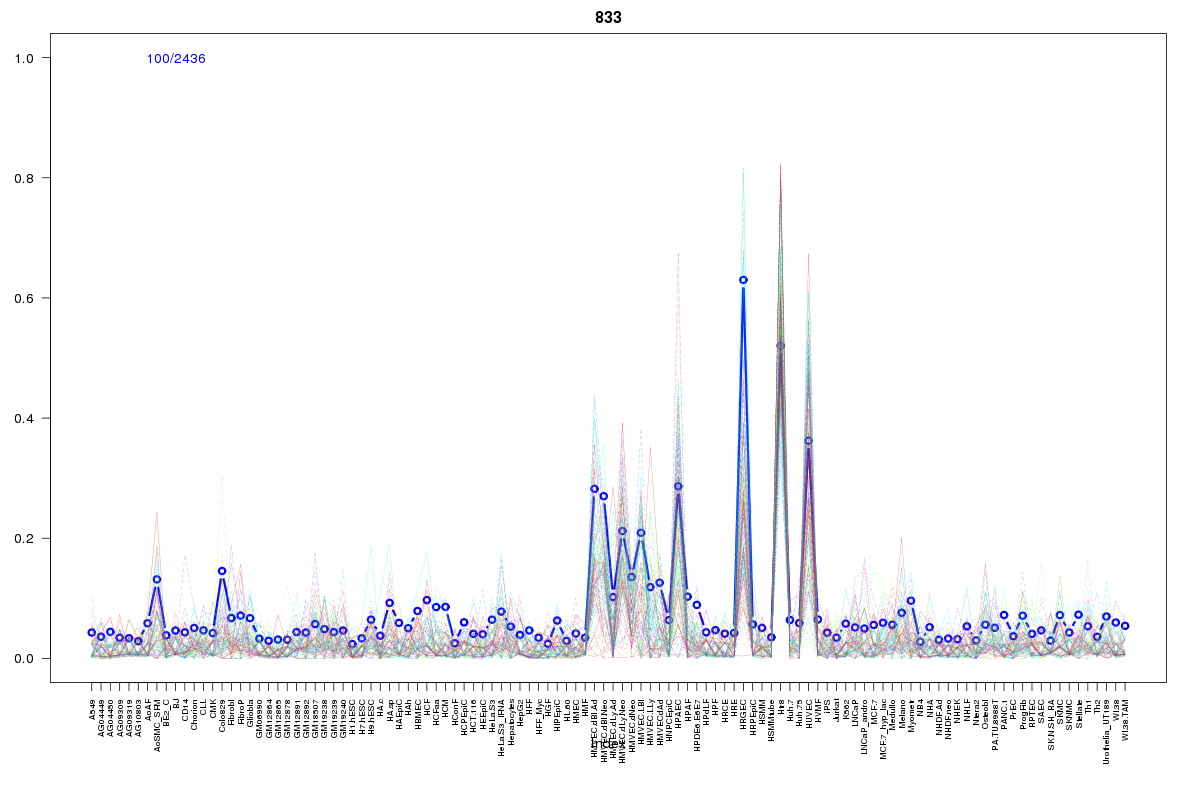 | 833 | 1 |
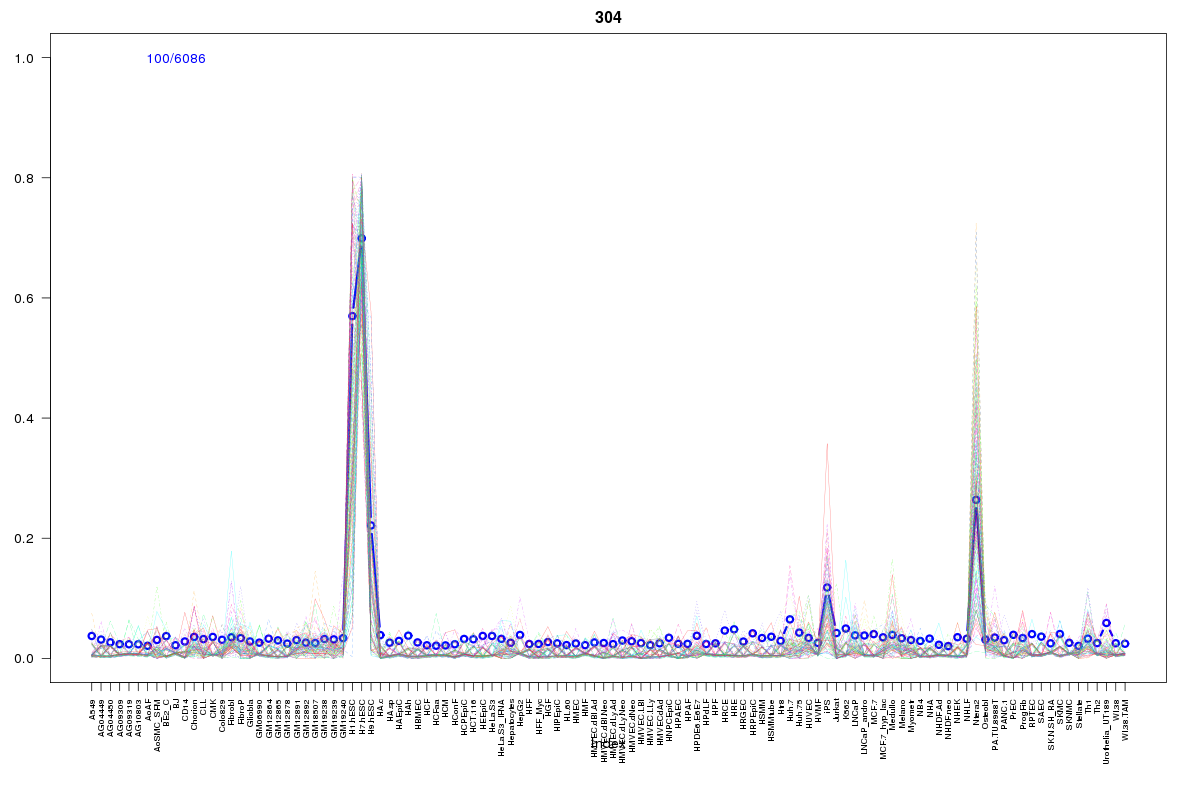 | 304 | 1 |
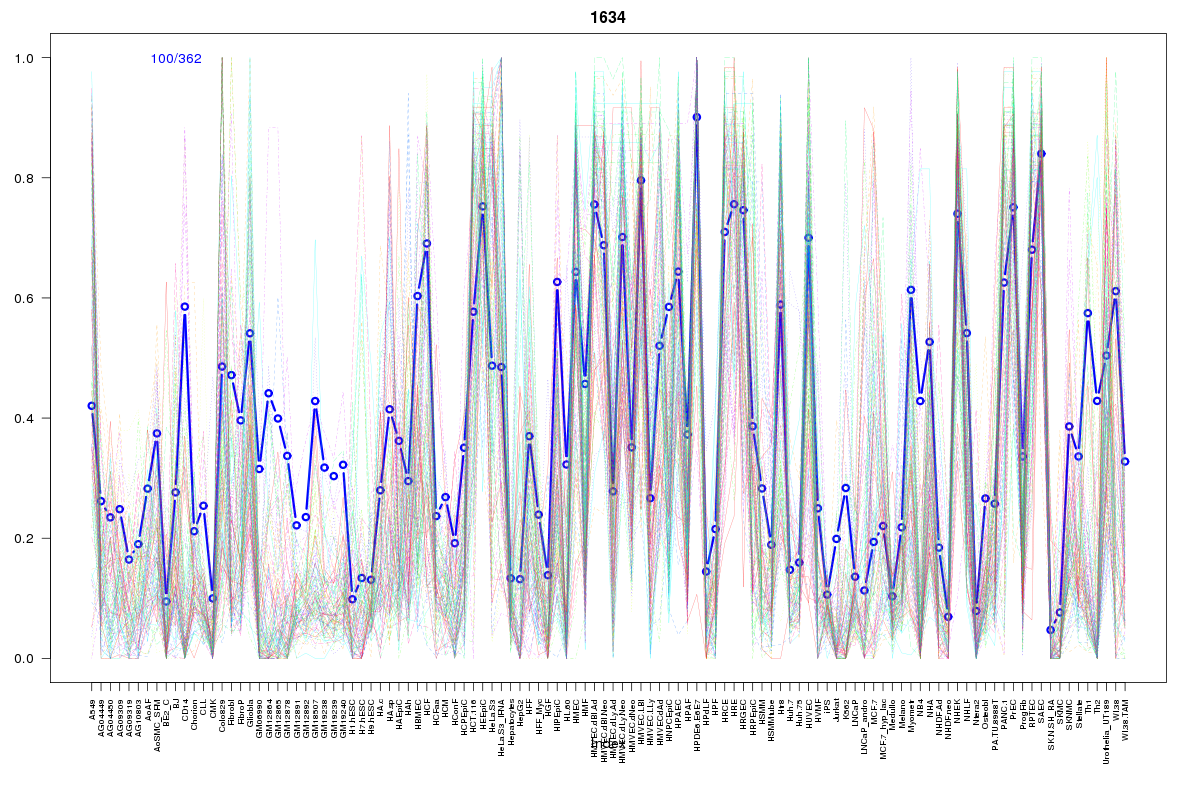 | 1634 | 1 |
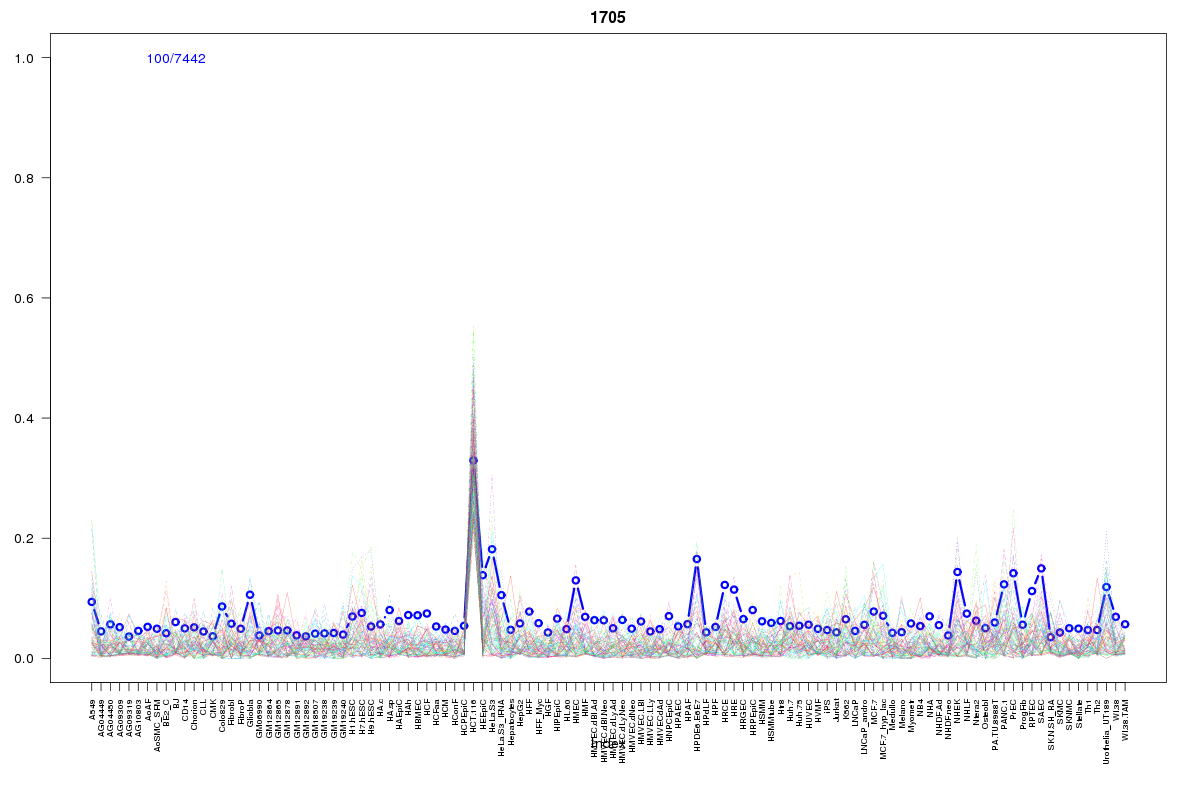 | 1705 | 1 |
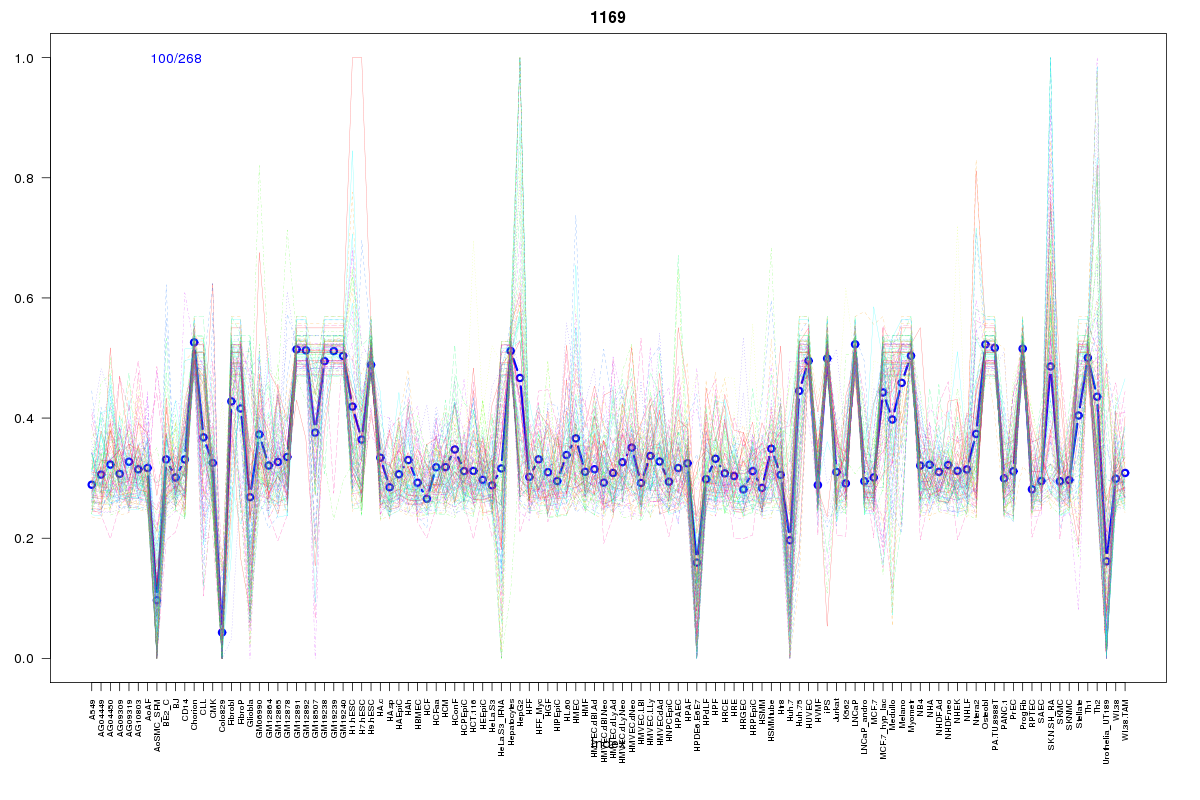 | 1169 | 1 |
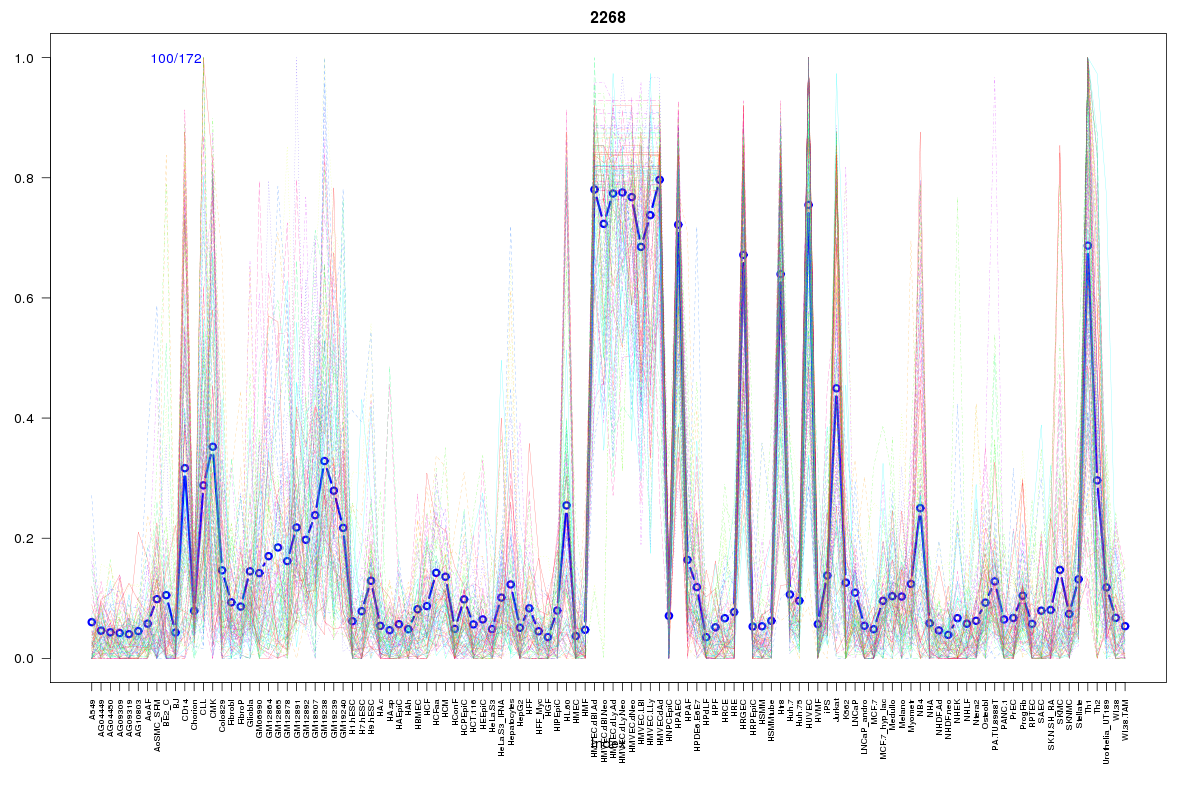 | 2268 | 1 |
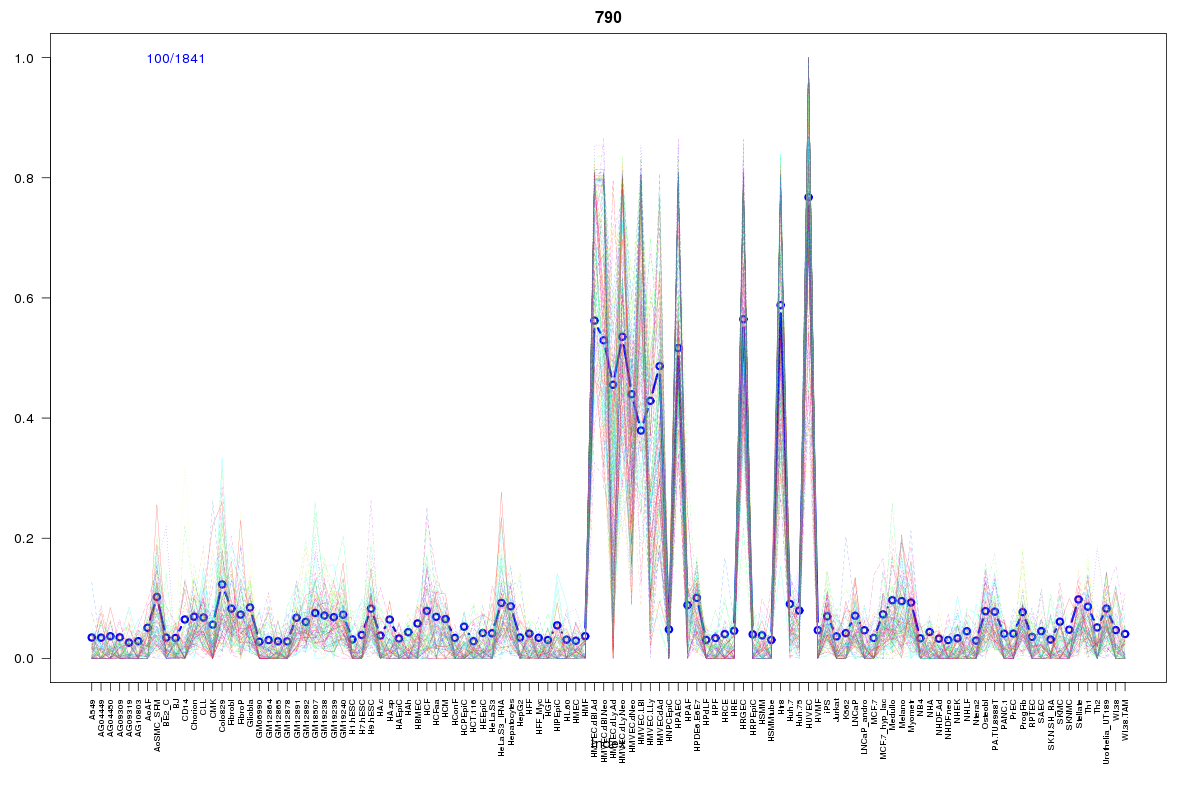 | 790 | 1 |
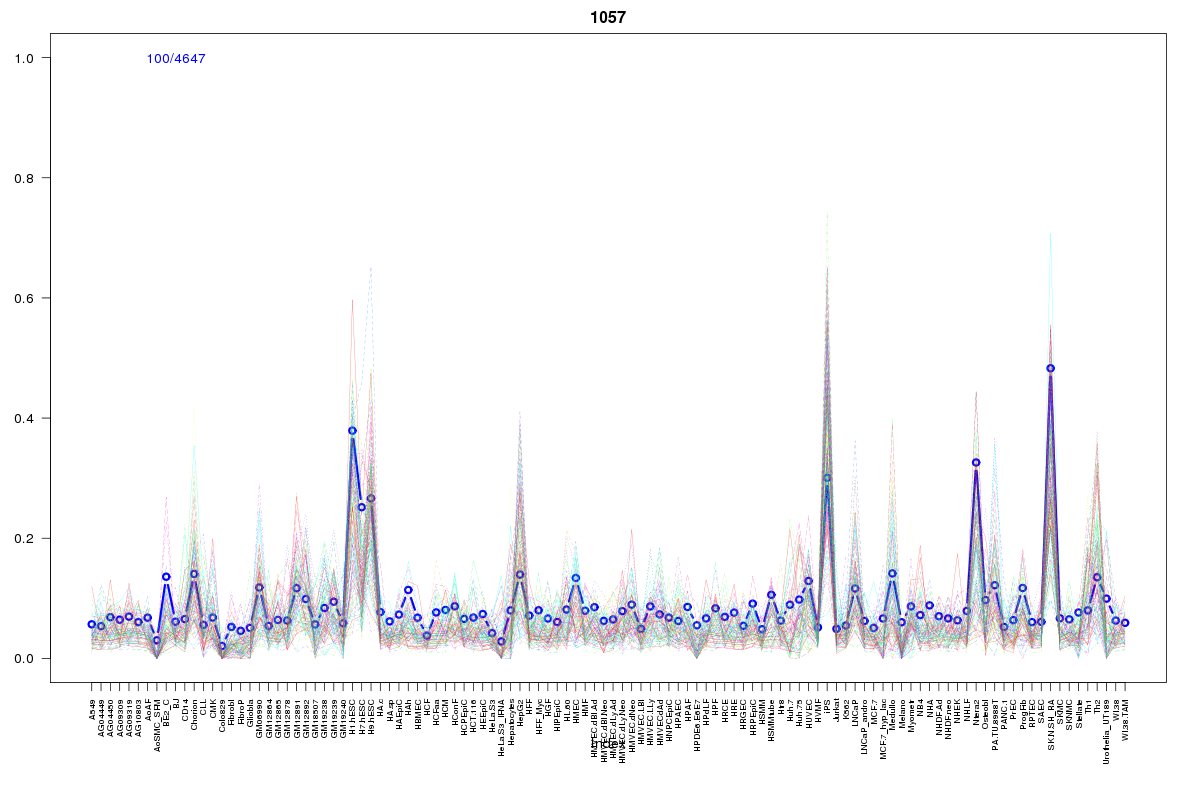 | 1057 | 1 |
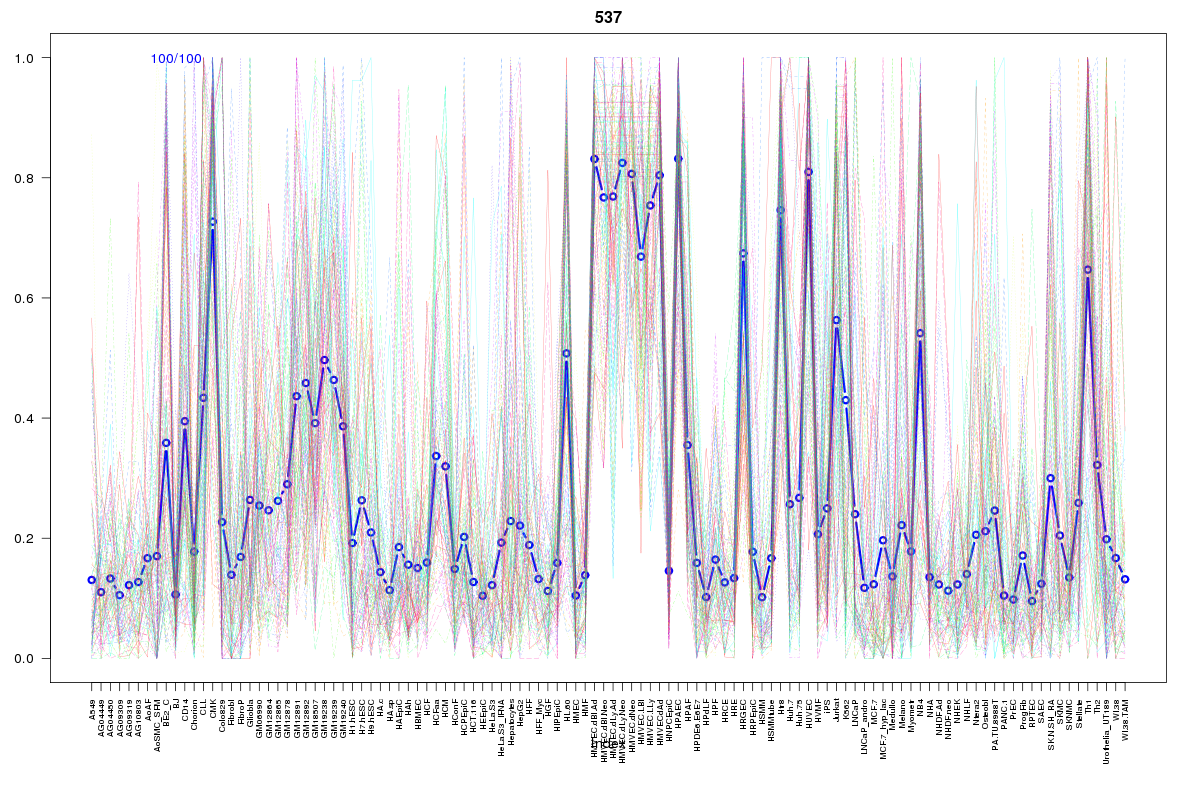 | 537 | 1 |
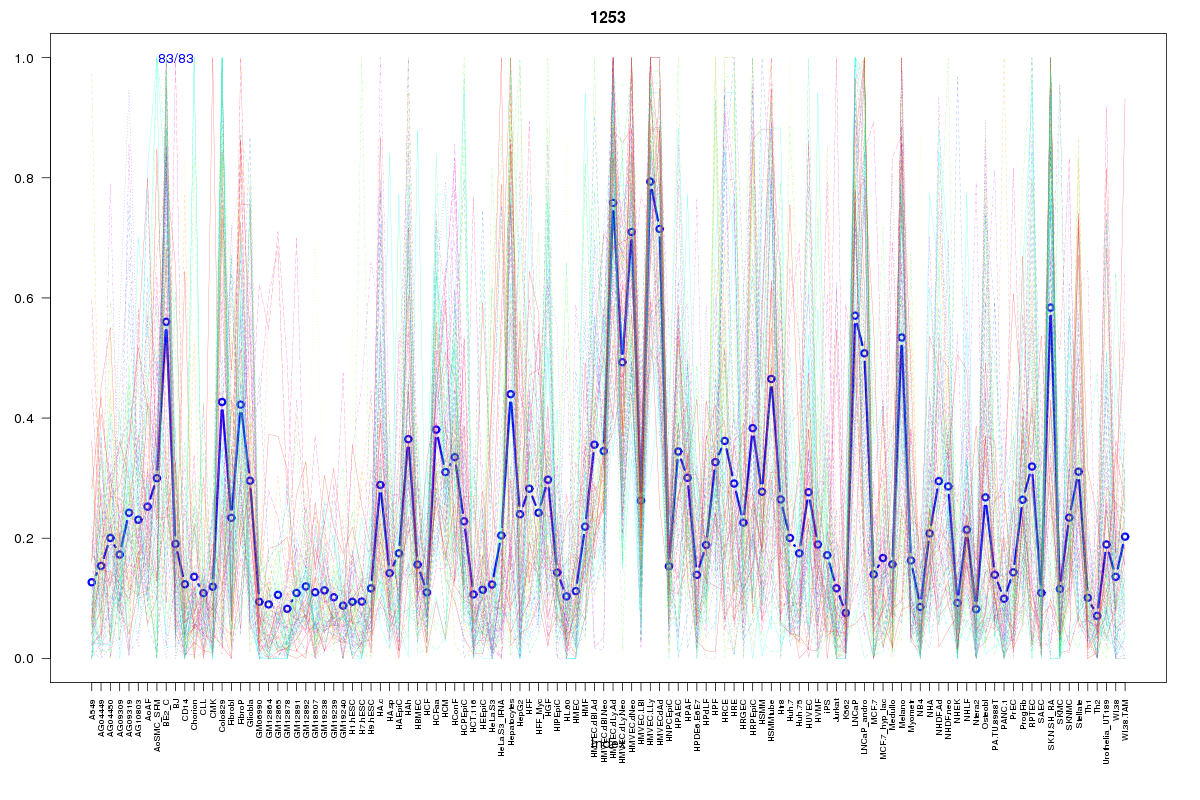 | 1253 | 1 |
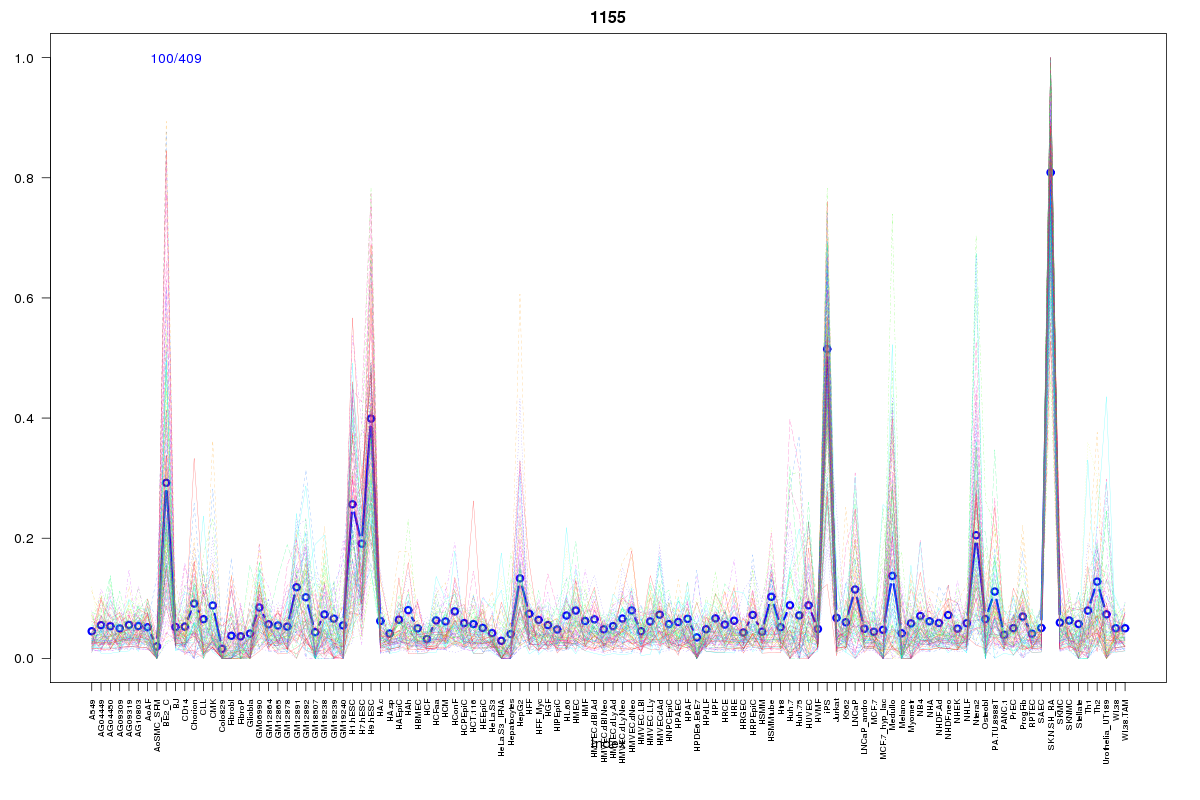 | 1155 | 1 |
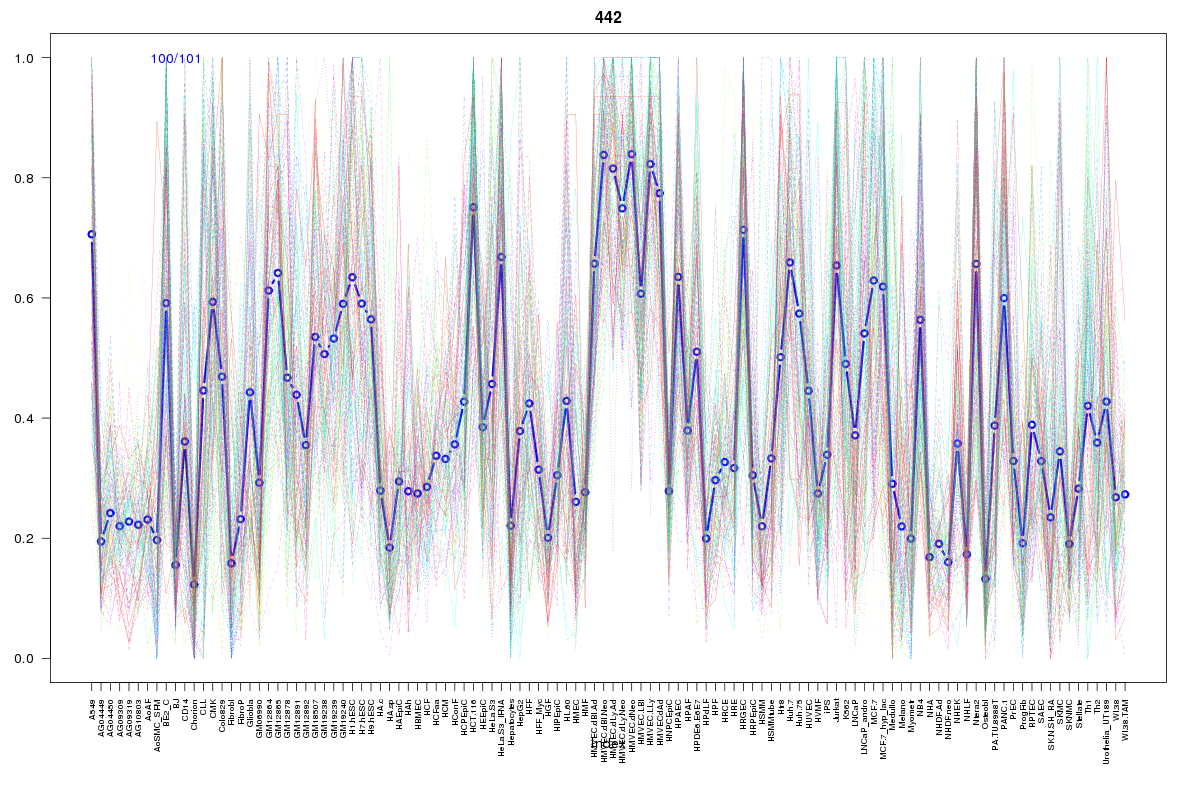 | 442 | 1 |
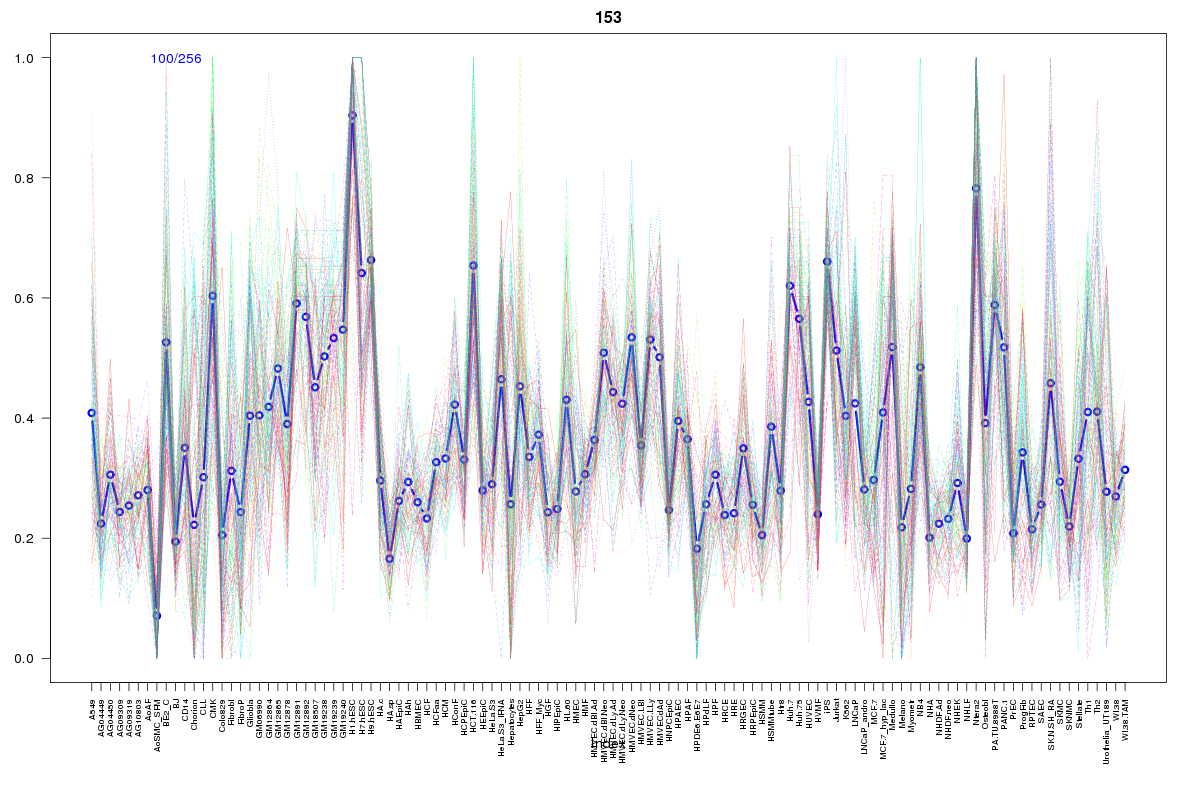 | 153 | 1 |
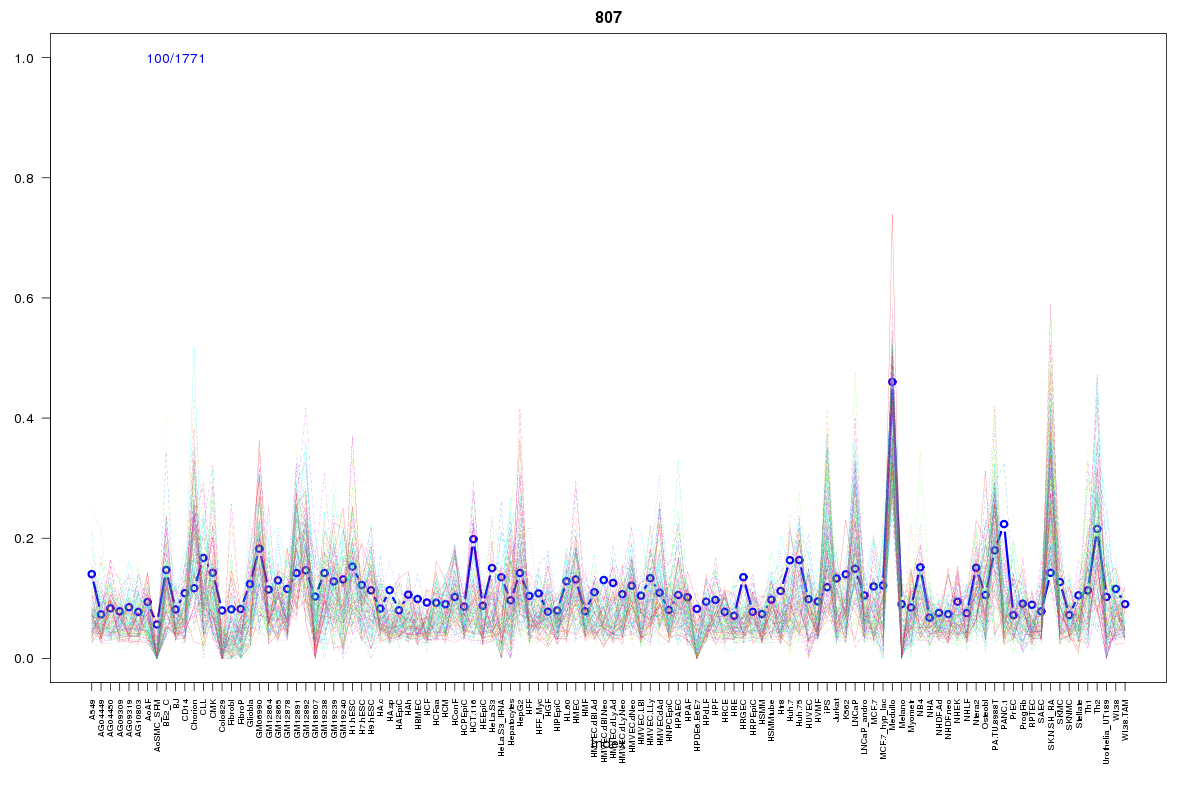 | 807 | 1 |
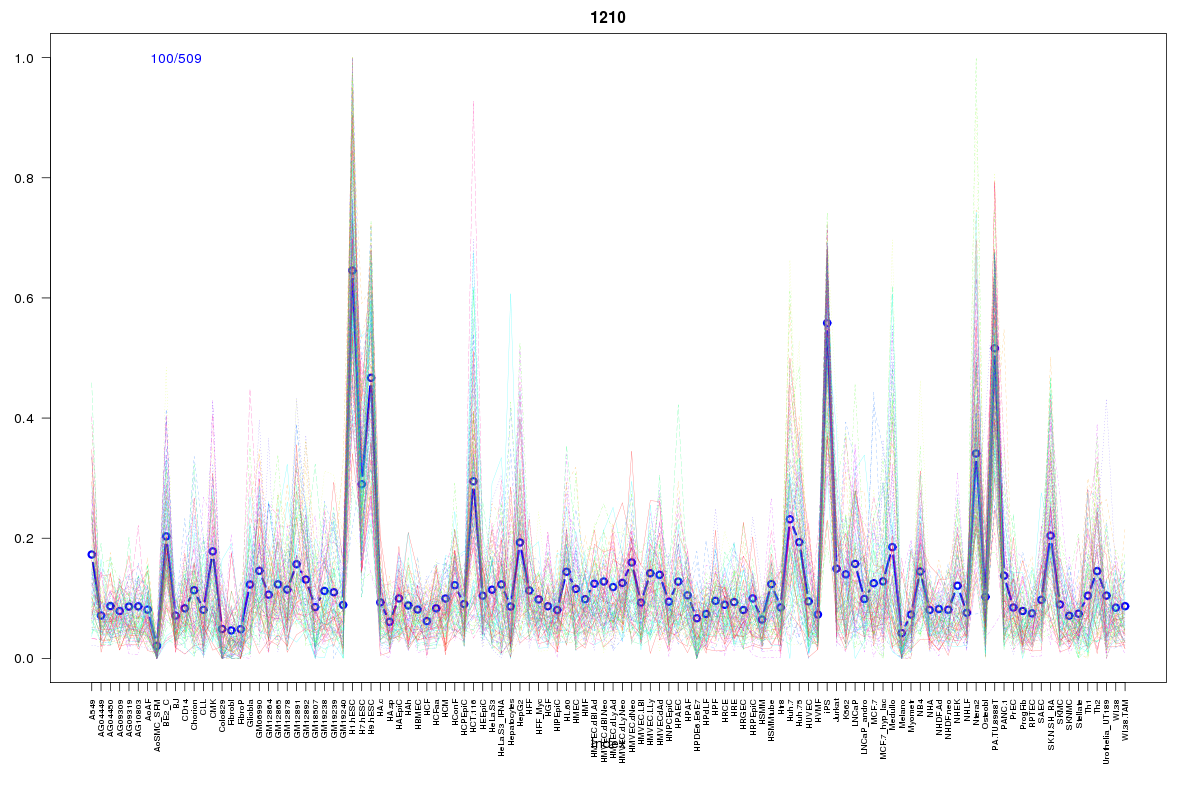 | 1210 | 1 |
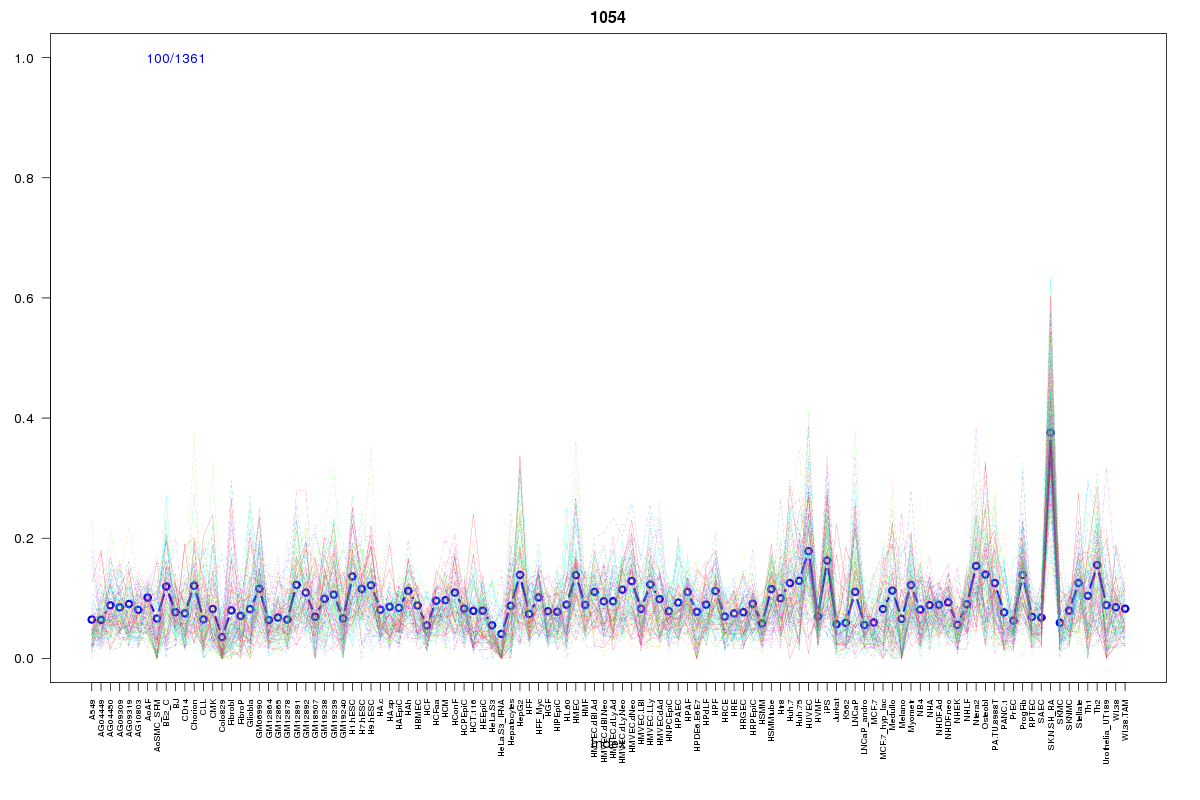 | 1054 | 1 |
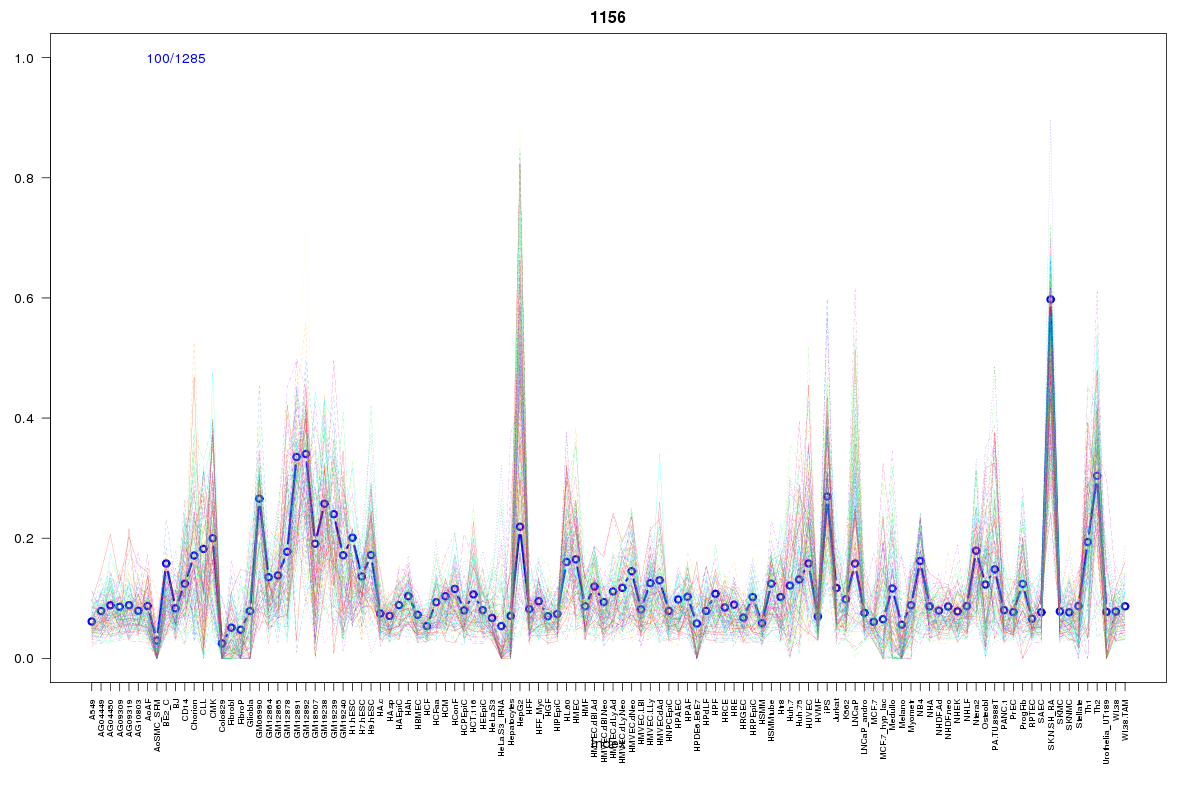 | 1156 | 1 |
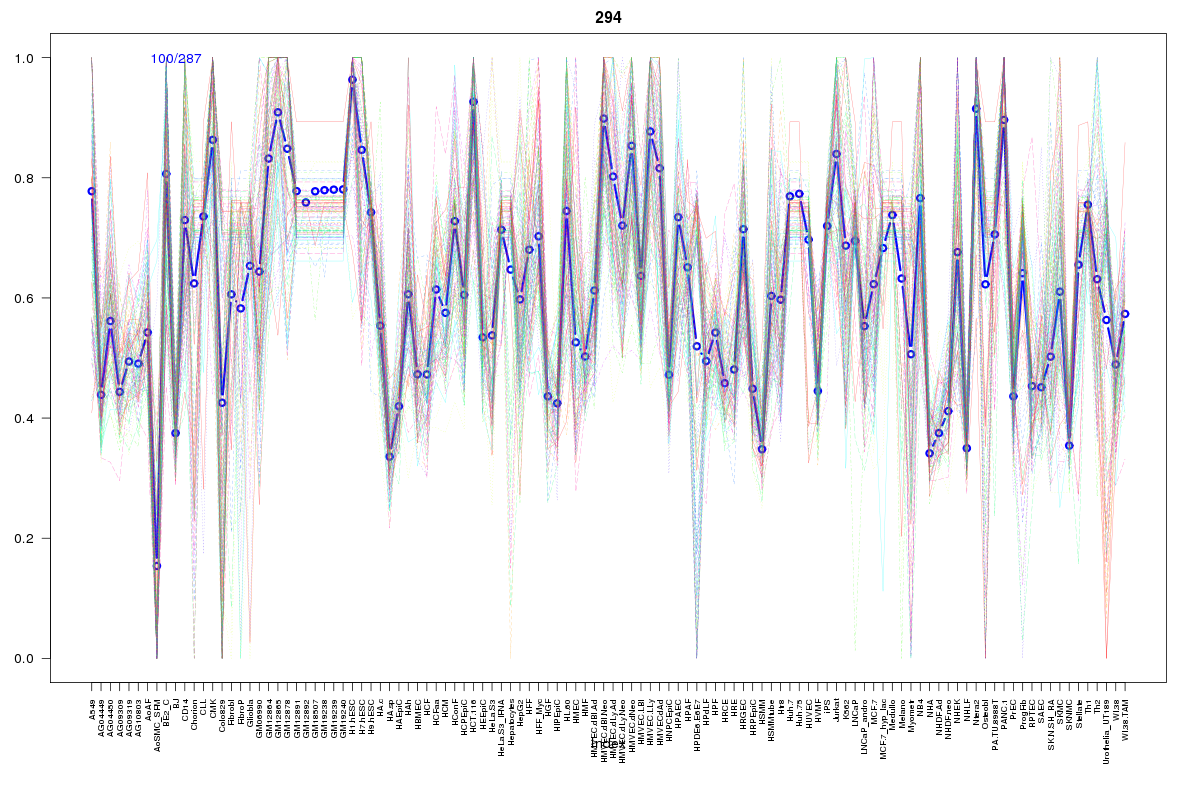 | 294 | 1 |
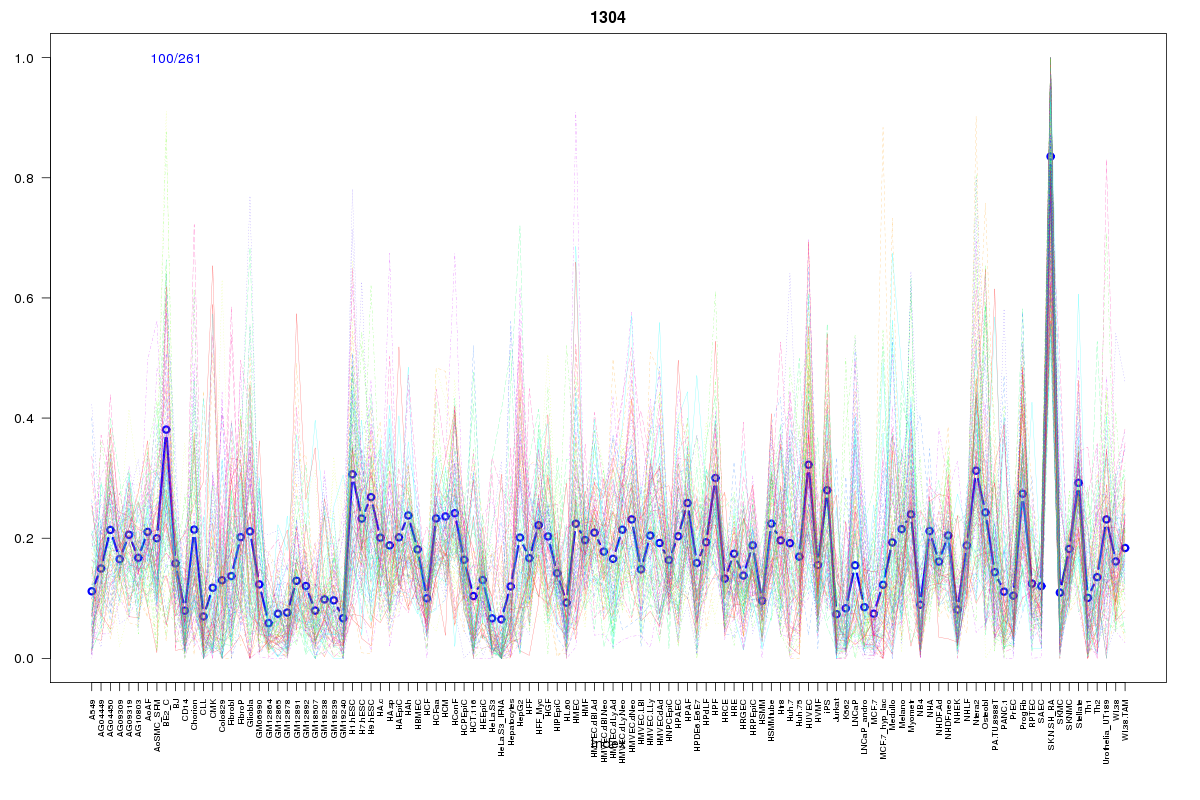 | 1304 | 1 |
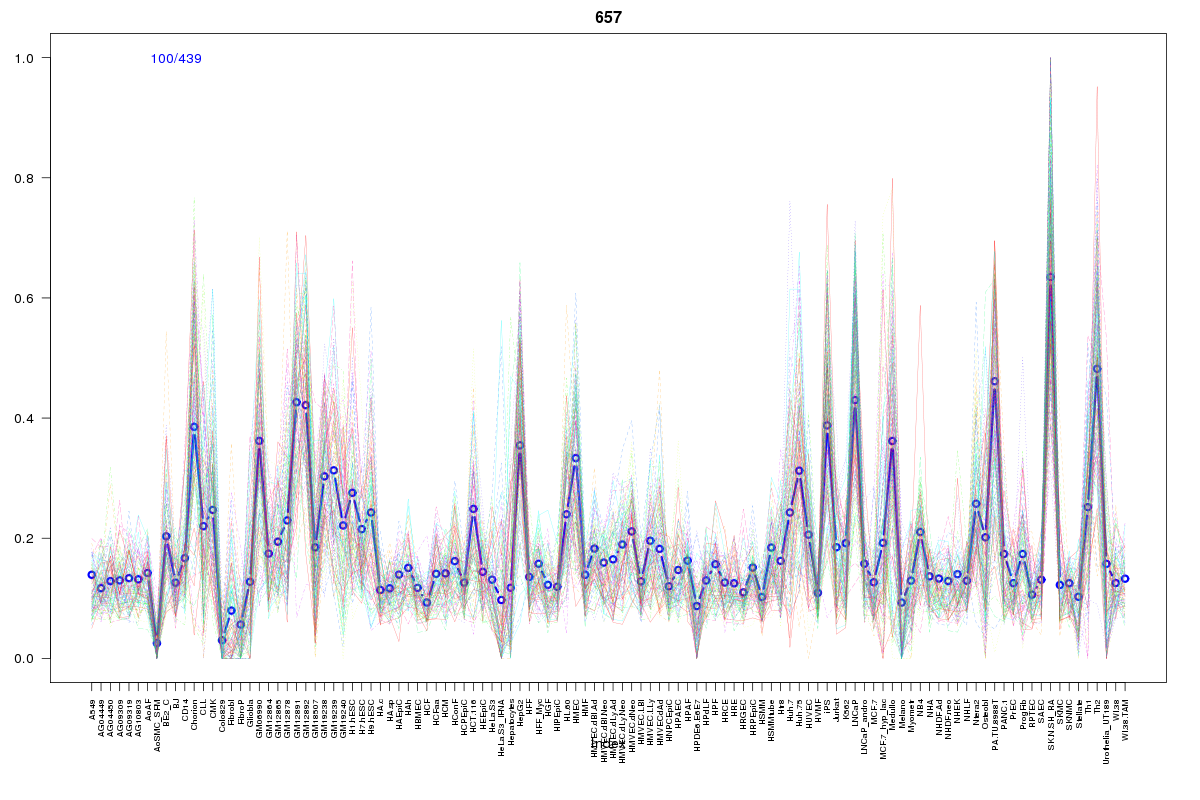 | 657 | 1 |
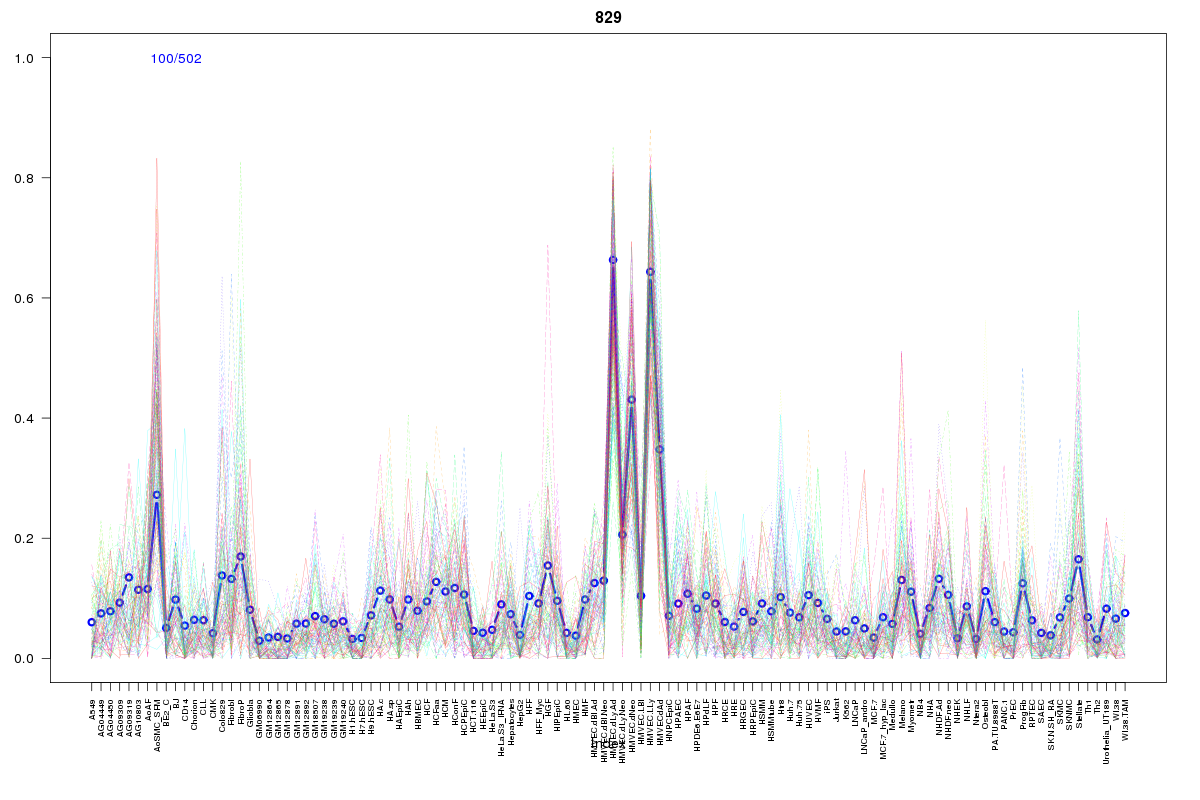 | 829 | 1 |
Resources
BED file downloads
Connects to 120 DHS sitesTop 10 Correlated DHS Sites
p-values indiciate significant higher or lower correlationExternal Databases
UCSCEnsembl (ENSG00000157570)