Gene: ADIPOR1
chr1: 202909950-202927517Expression Profile
(log scale)
Graphical Connections
Distribution of linked clusters:
You may find it interesting if many of the connected DHS sites belong to the same cluster.| Cluster Profile | Cluster ID | Number of DHS sites in this cluster |
|---|---|---|
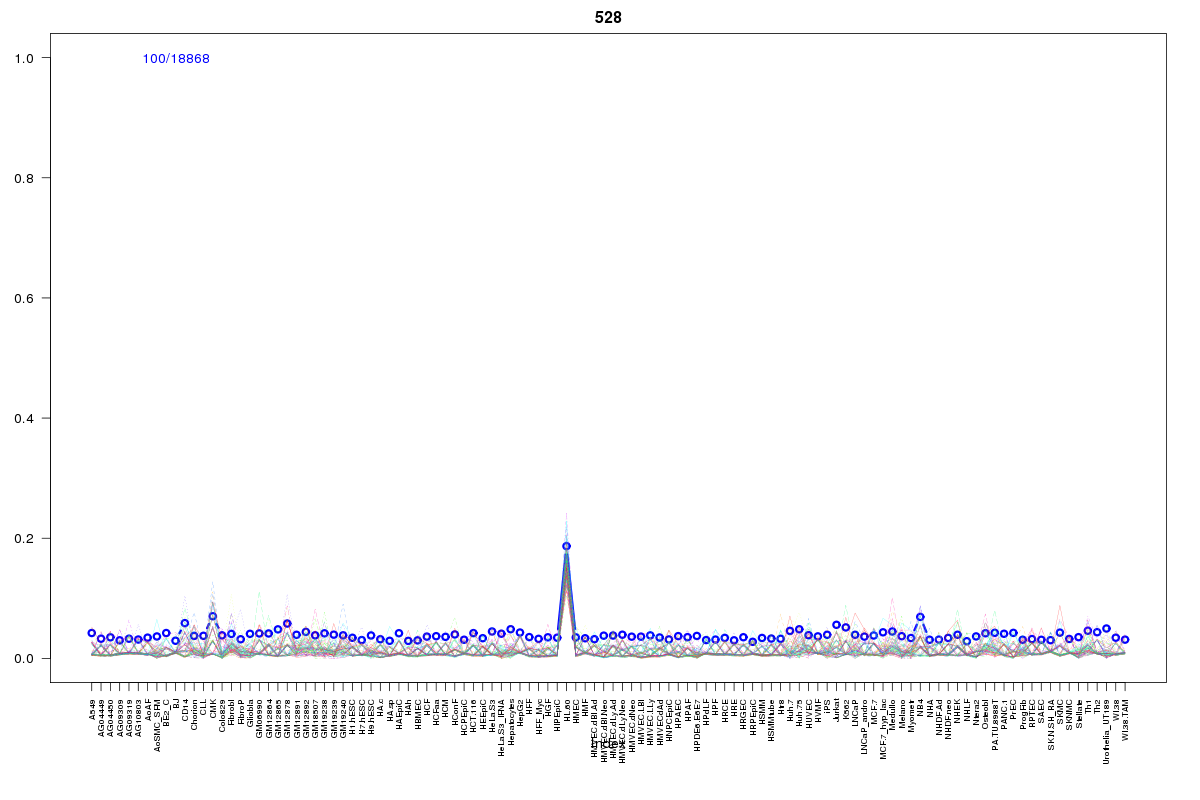 | 528 | 5 |
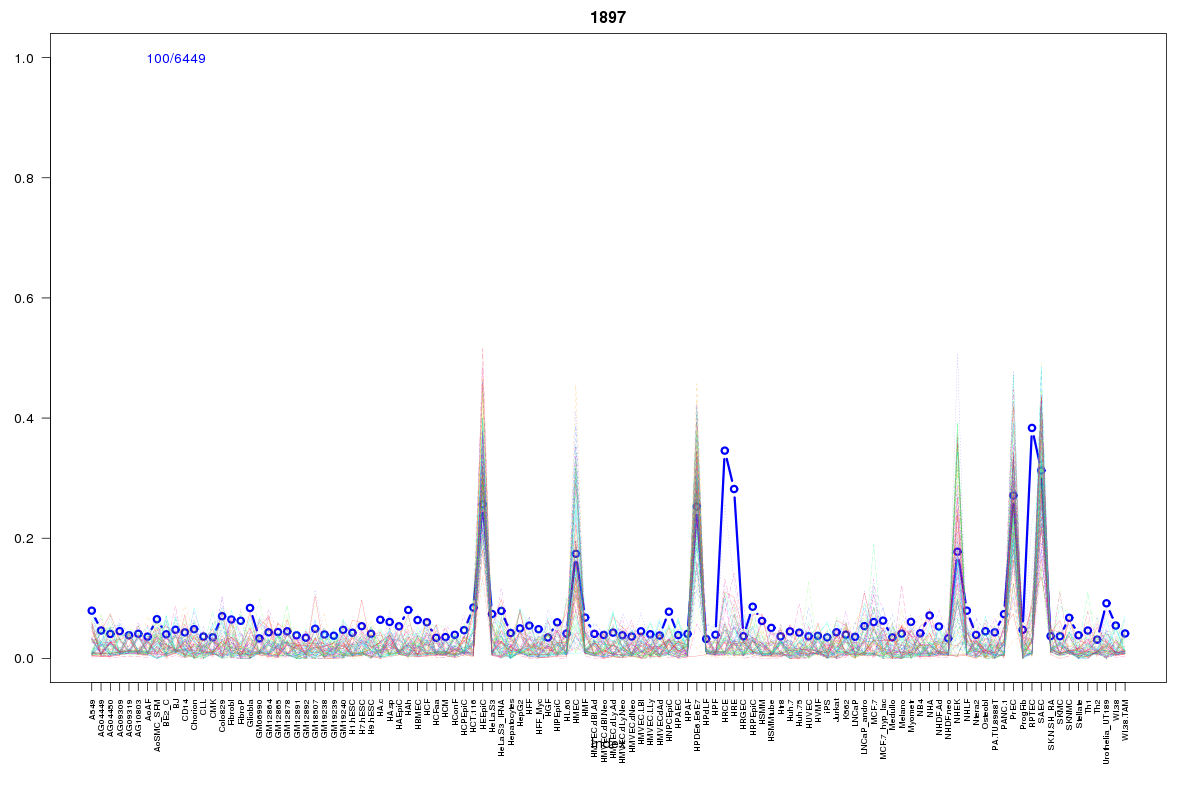 | 1897 | 2 |
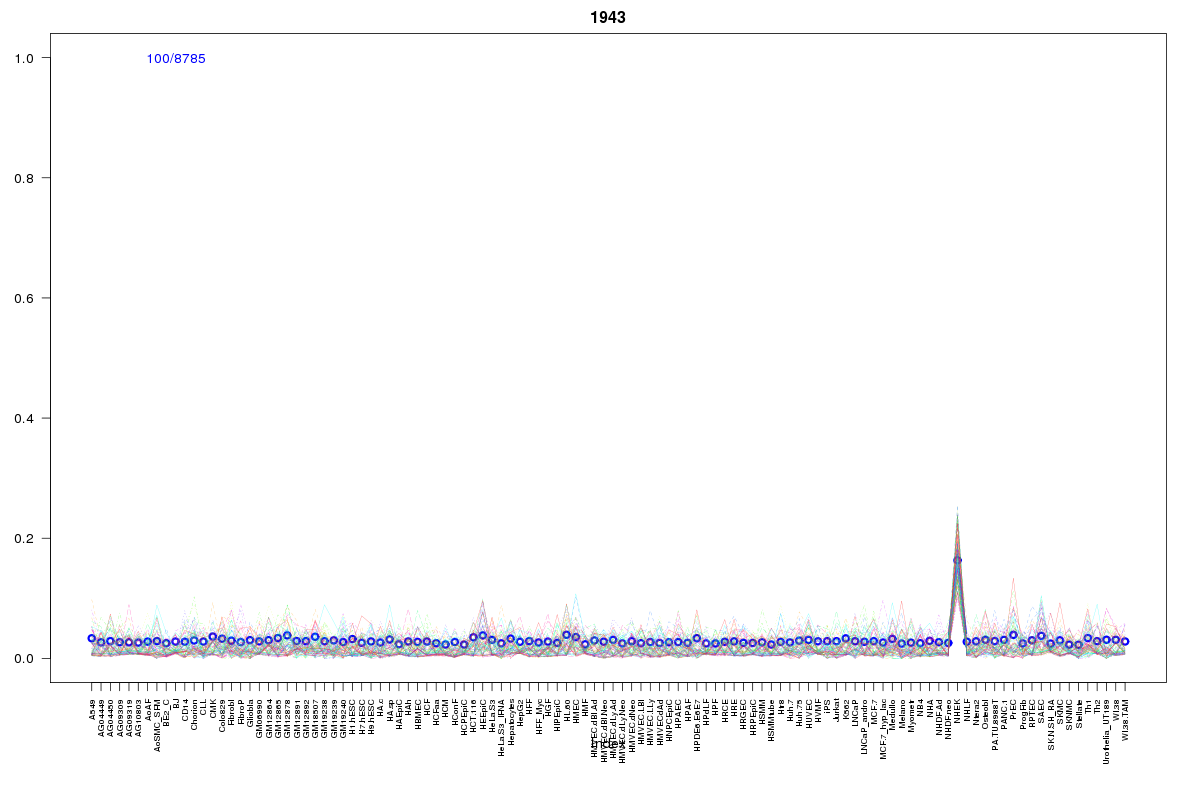 | 1943 | 2 |
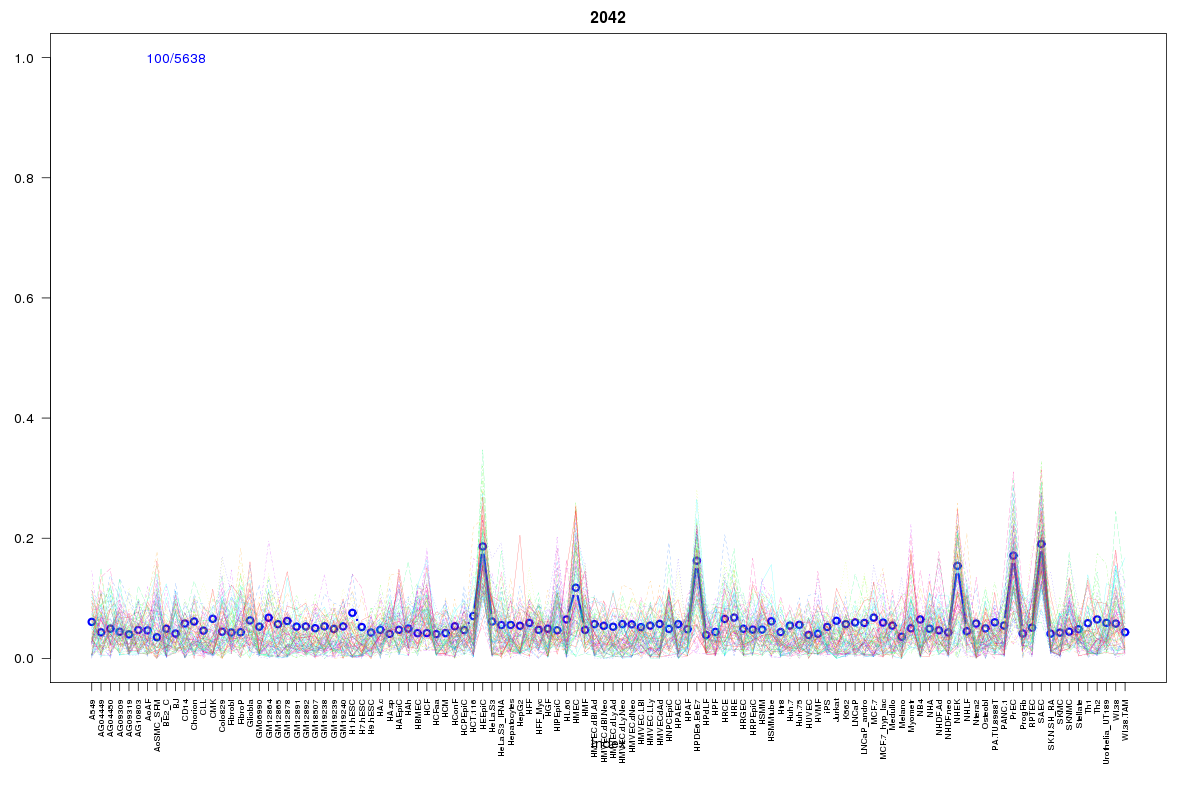 | 2042 | 2 |
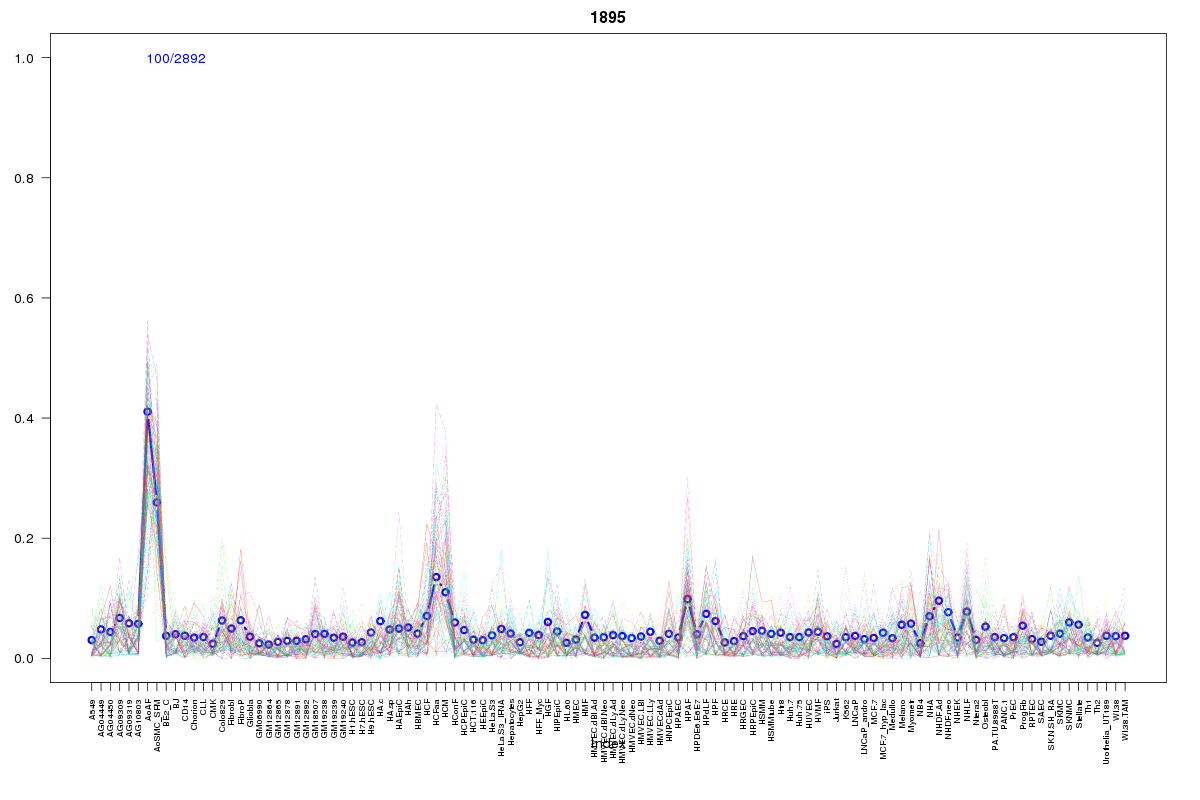 | 1895 | 1 |
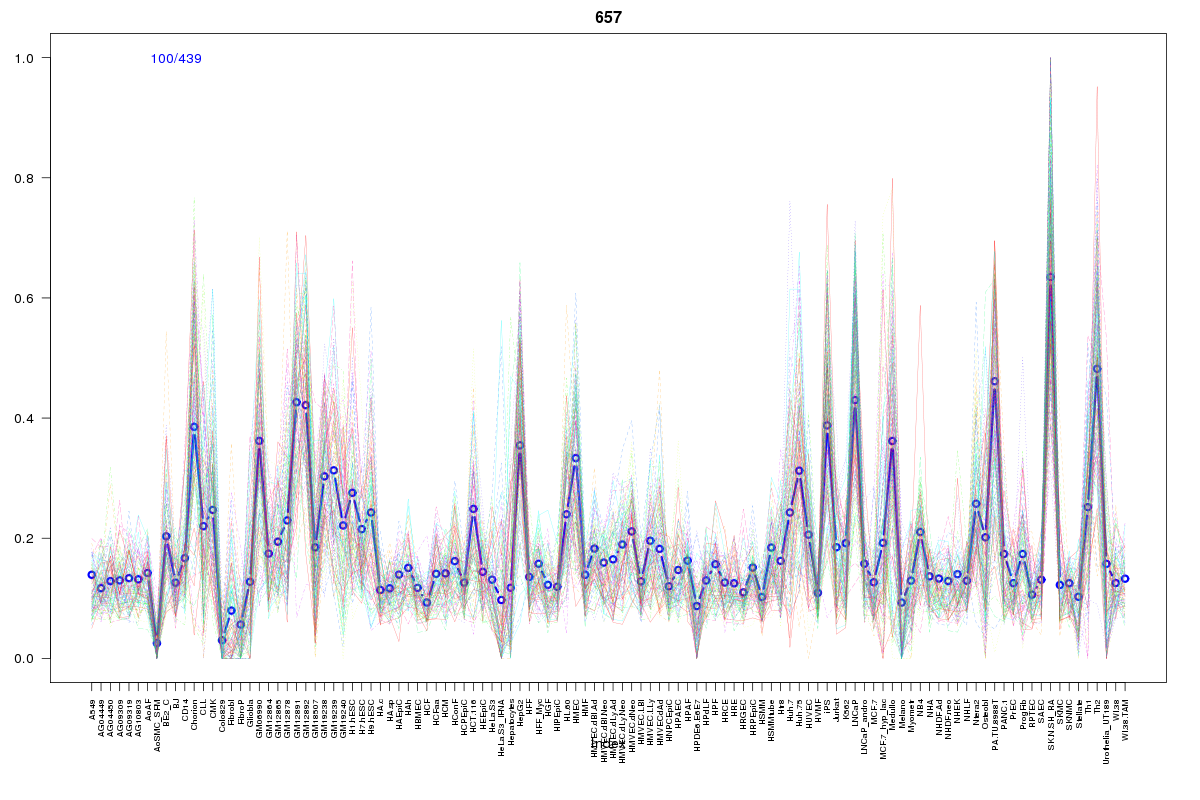 | 657 | 1 |
 | 2156 | 1 |
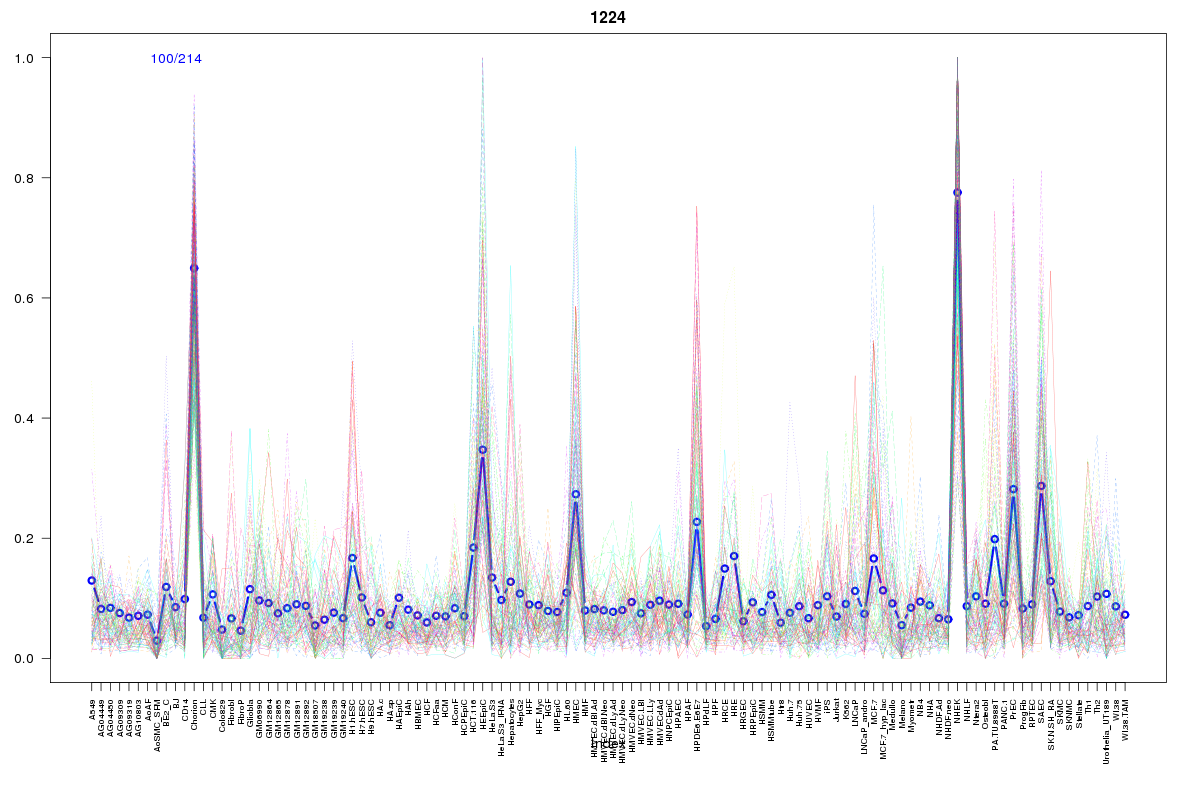 | 1224 | 1 |
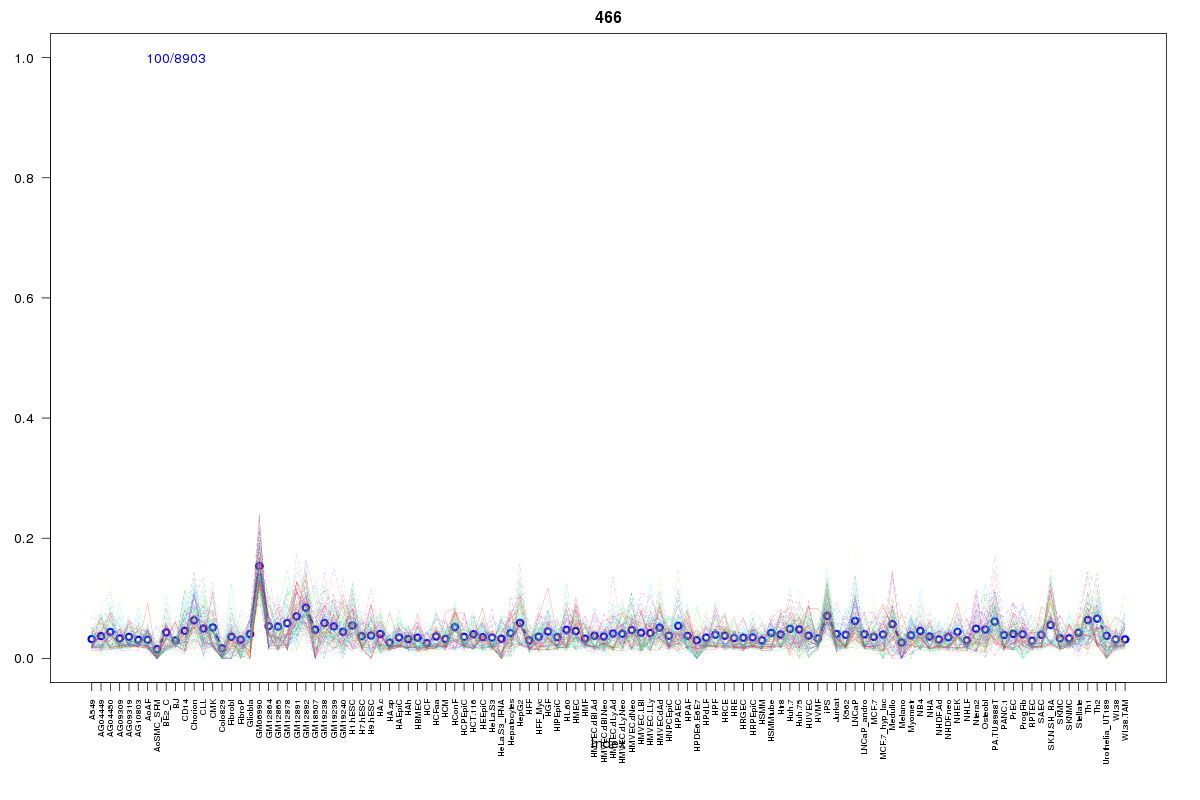 | 466 | 1 |
 | 192 | 1 |
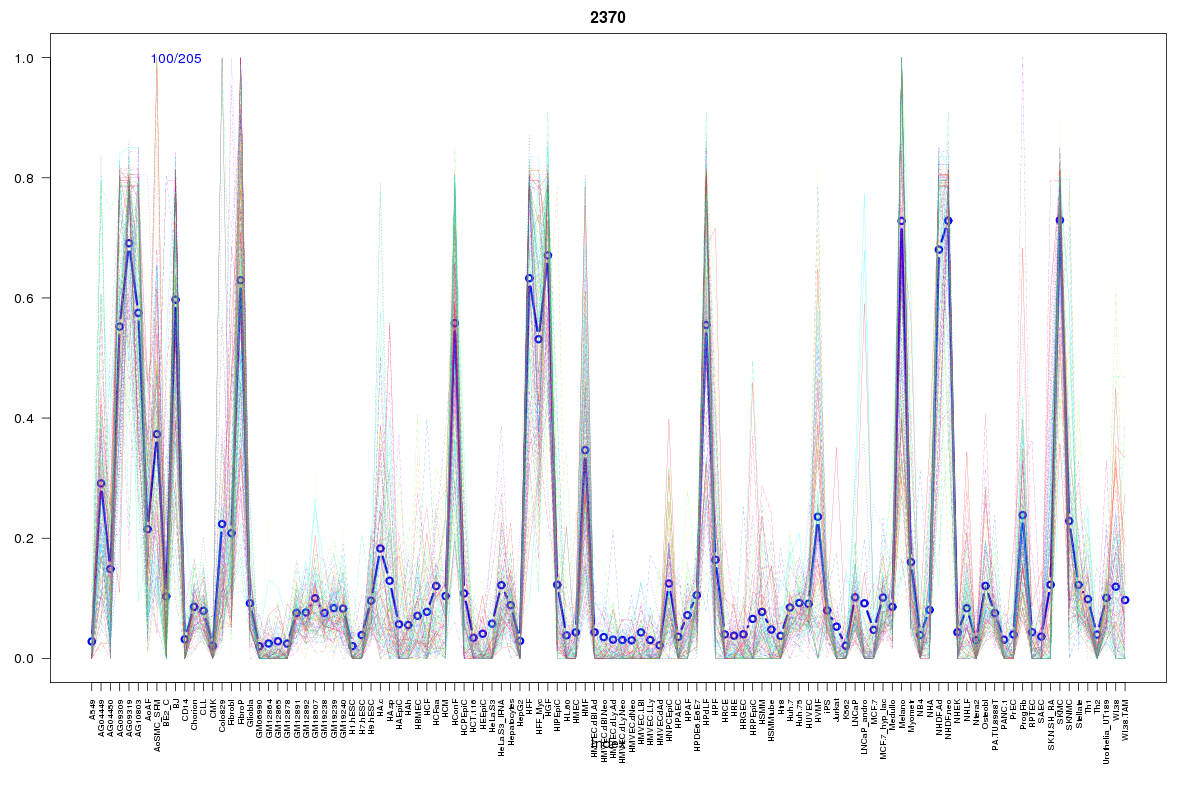 | 2370 | 1 |
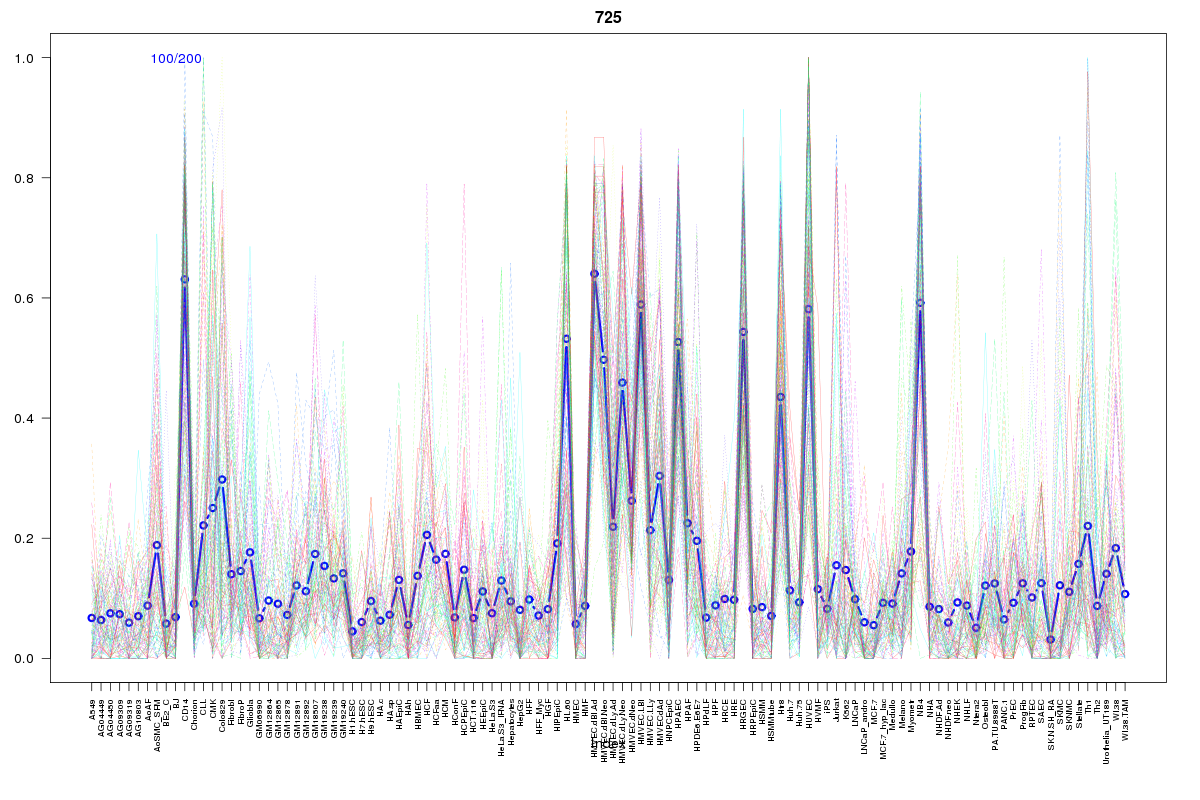 | 725 | 1 |
 | 1605 | 1 |
 | 1779 | 1 |
 | 1755 | 1 |
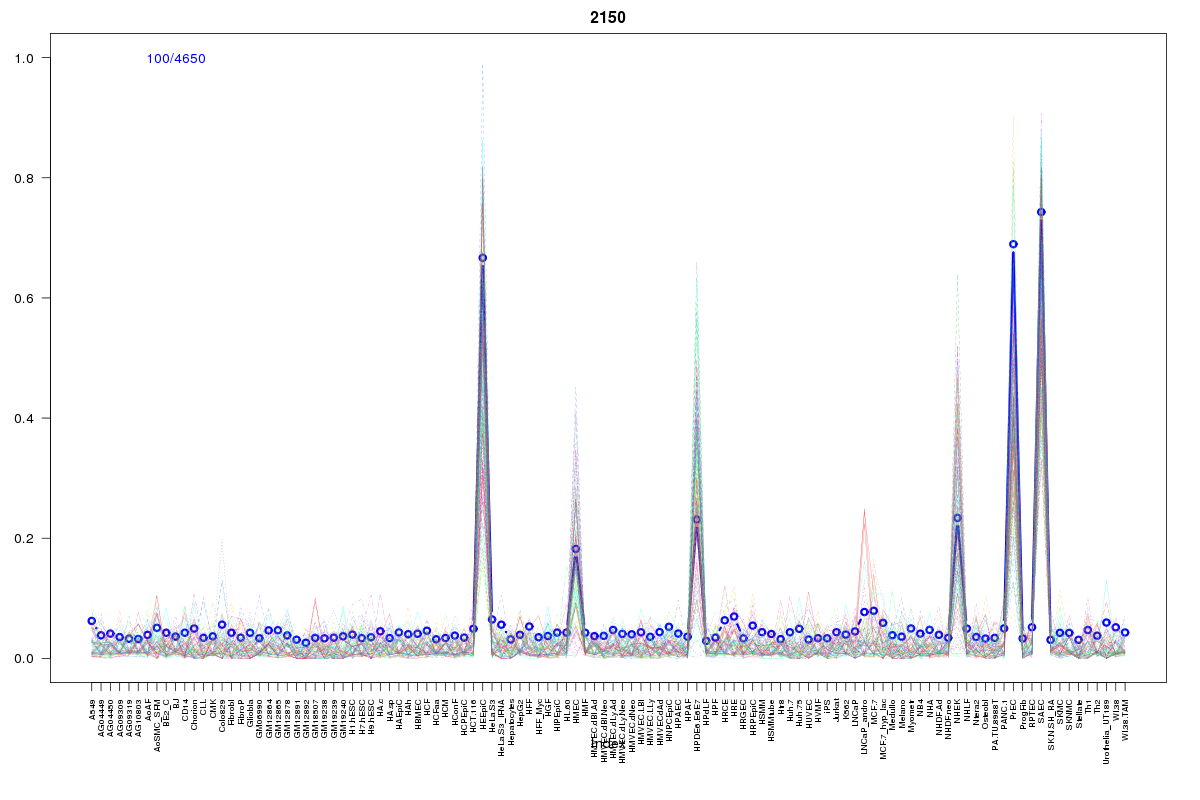 | 2150 | 1 |
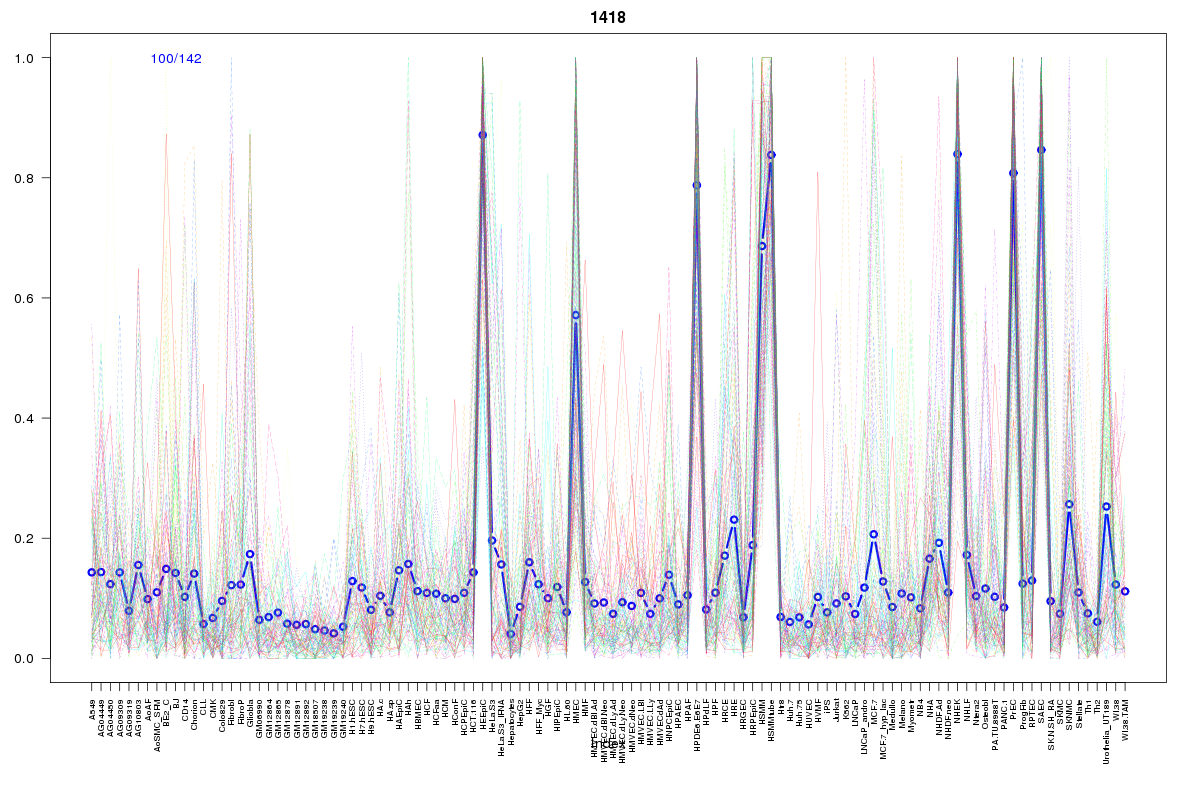 | 1418 | 1 |
 | 66 | 1 |
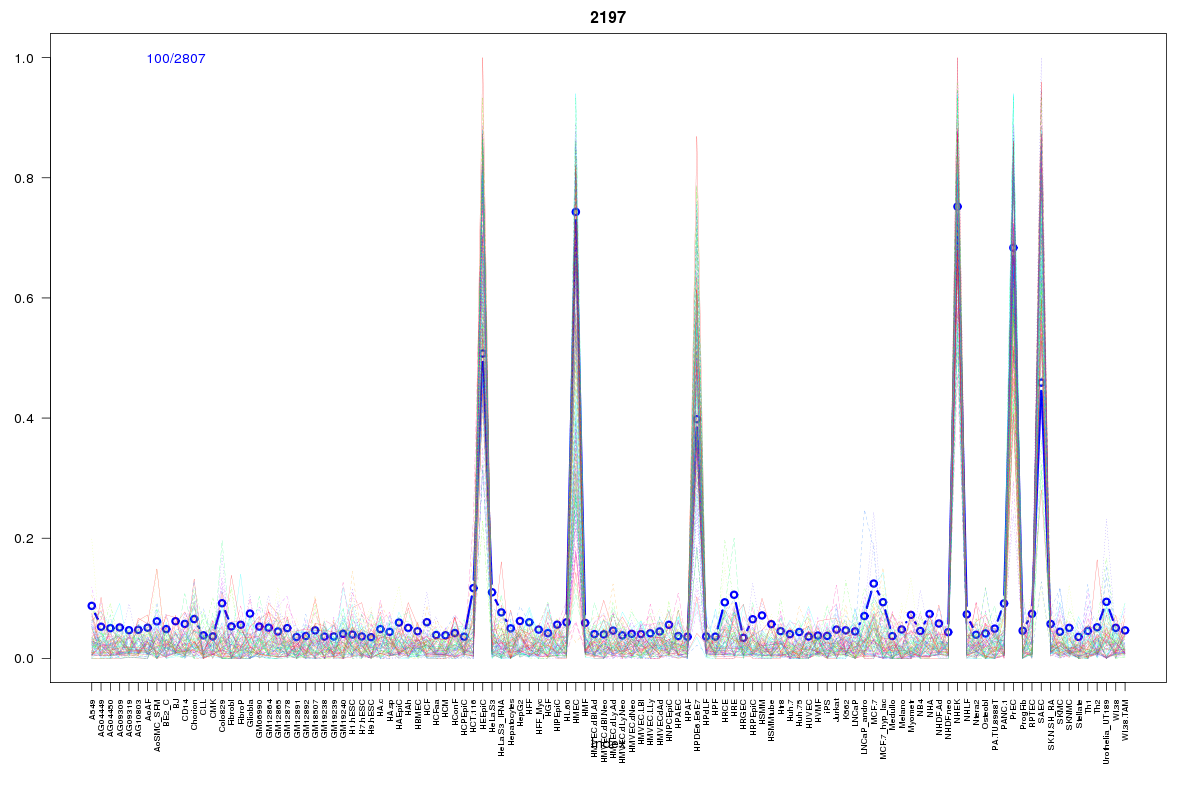 | 2197 | 1 |
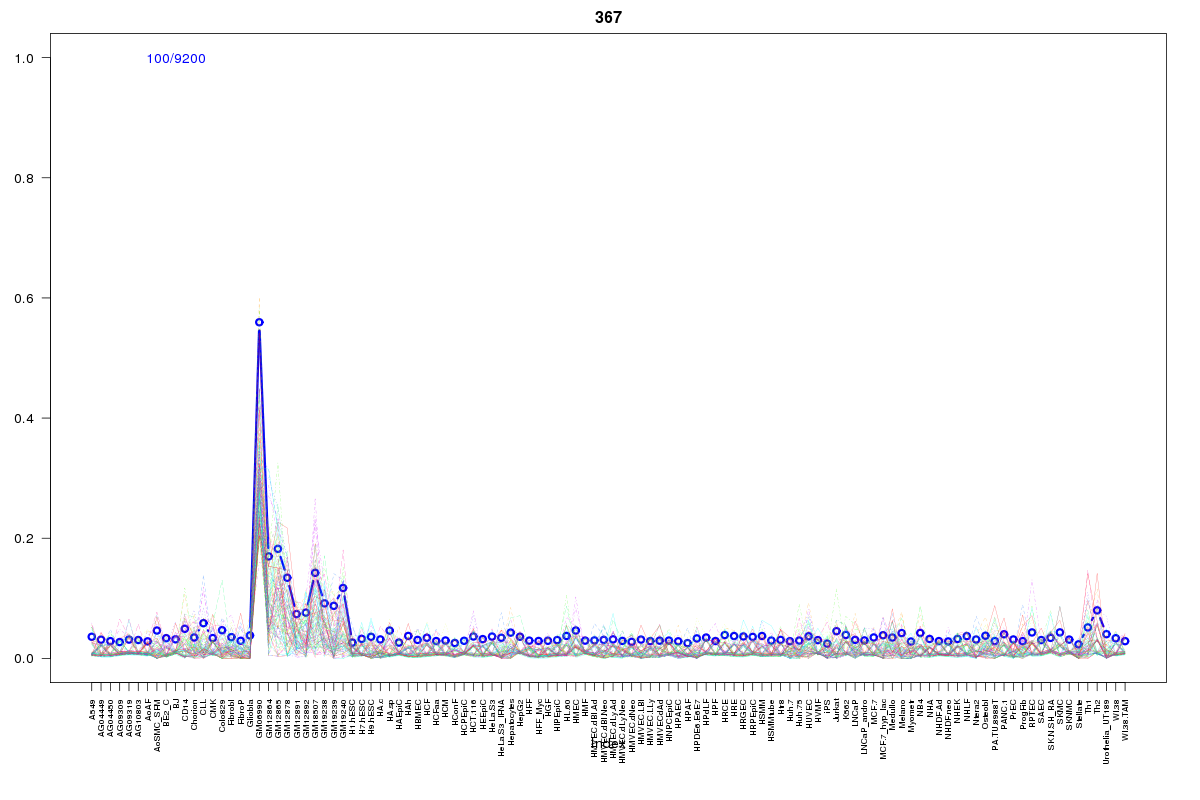 | 367 | 1 |
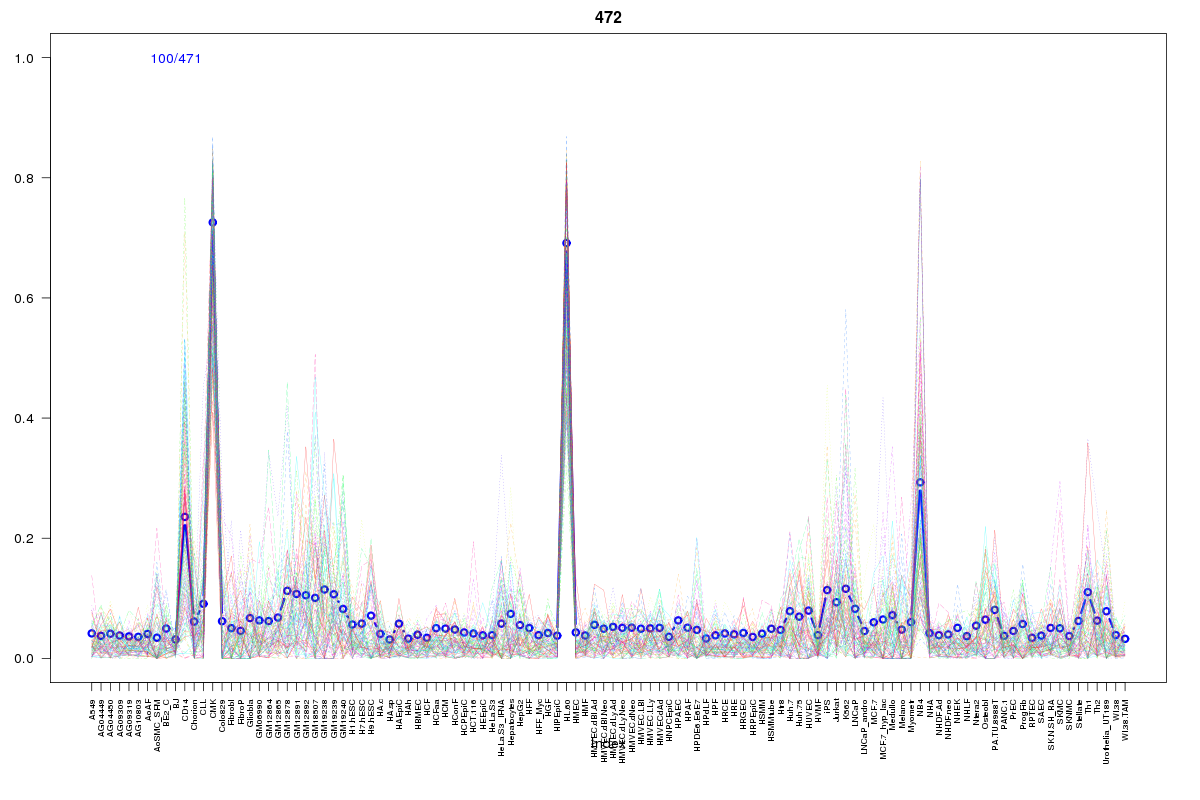 | 472 | 1 |
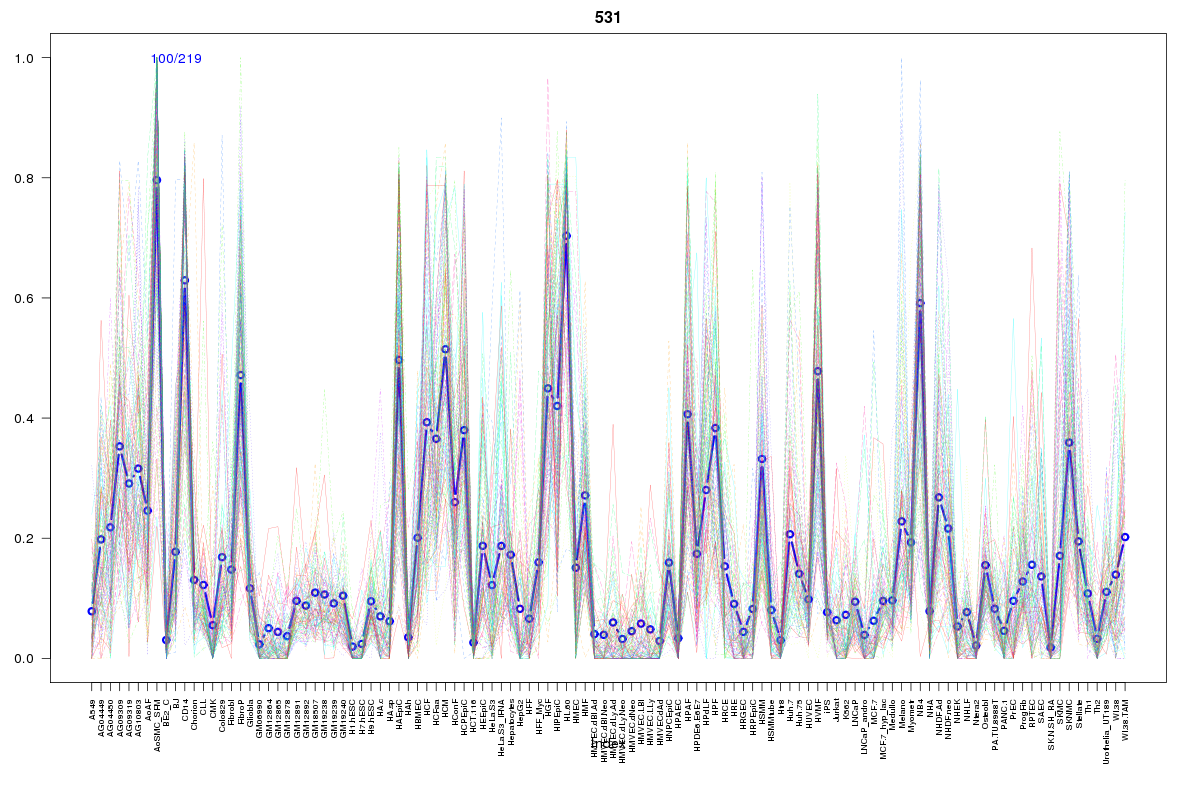 | 531 | 1 |
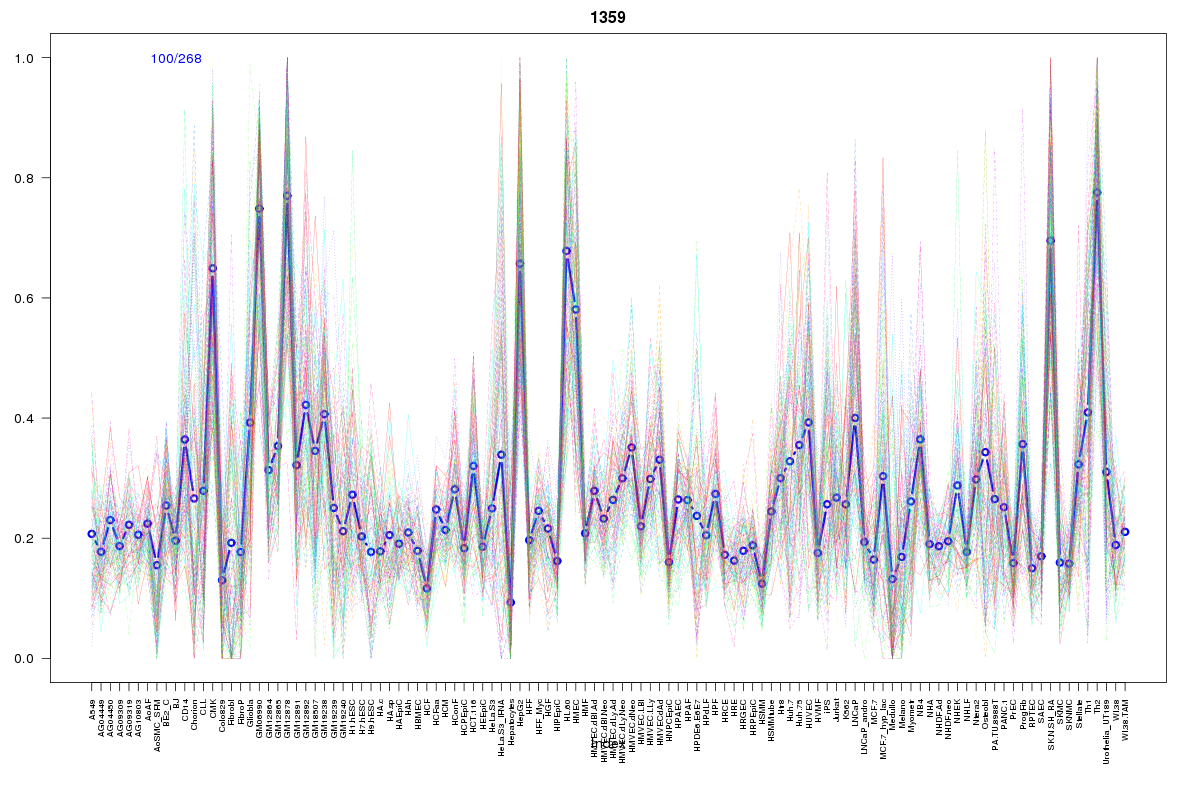 | 1359 | 1 |
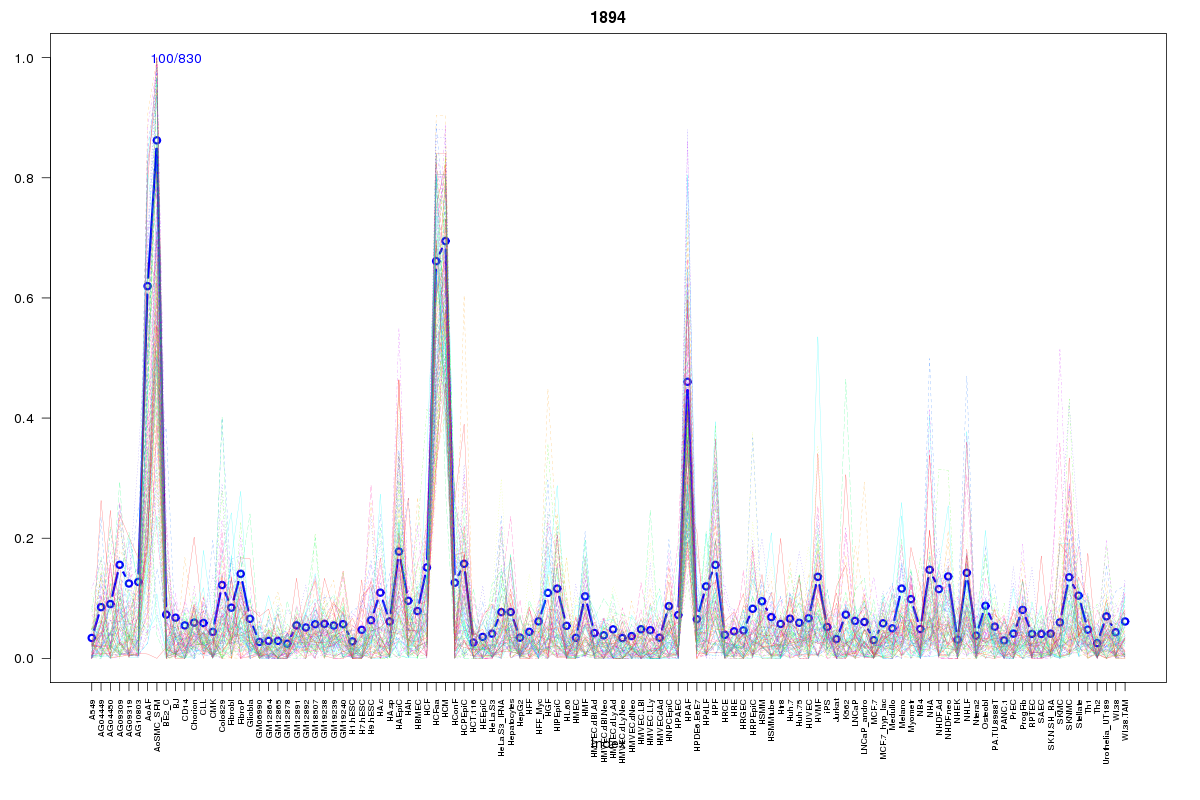 | 1894 | 1 |
 | 568 | 1 |
Resources
BED file downloads
Connects to 32 DHS sitesTop 10 Correlated DHS Sites
p-values indiciate significant higher or lower correlation| Location | Cluster | P-value |
|---|---|---|
| chr1:202932785-202932935 | 1943 | 0.008 |
| chr1:203009020-203009170 | 1224 | 0.009 |
| chr1:202920145-202920295 | 1943 | 0.009 |
| chr1:202813500-202813650 | 2150 | 0.01 |
| chr1:203025125-203025275 | 466 | 0.01 |
| chr1:202928920-202929070 | 2042 | 0.014 |
| chr1:202923560-202923710 | 1605 | 0.016 |
| chr1:202921860-202922010 | 725 | 0.016 |
| chr1:202934340-202934490 | 1418 | 0.018 |
| chr1:202895960-202896110 | 192 | 0.02 |
| chr1:202928485-202928635 | 1779 | 0.02 |
External Databases
UCSCEnsembl (ENSG00000159346)