Gene: UBE2Q1
chr1: 154521052-154531109Expression Profile
(log scale)
Graphical Connections
Distribution of linked clusters:
You may find it interesting if many of the connected DHS sites belong to the same cluster.| Cluster Profile | Cluster ID | Number of DHS sites in this cluster |
|---|---|---|
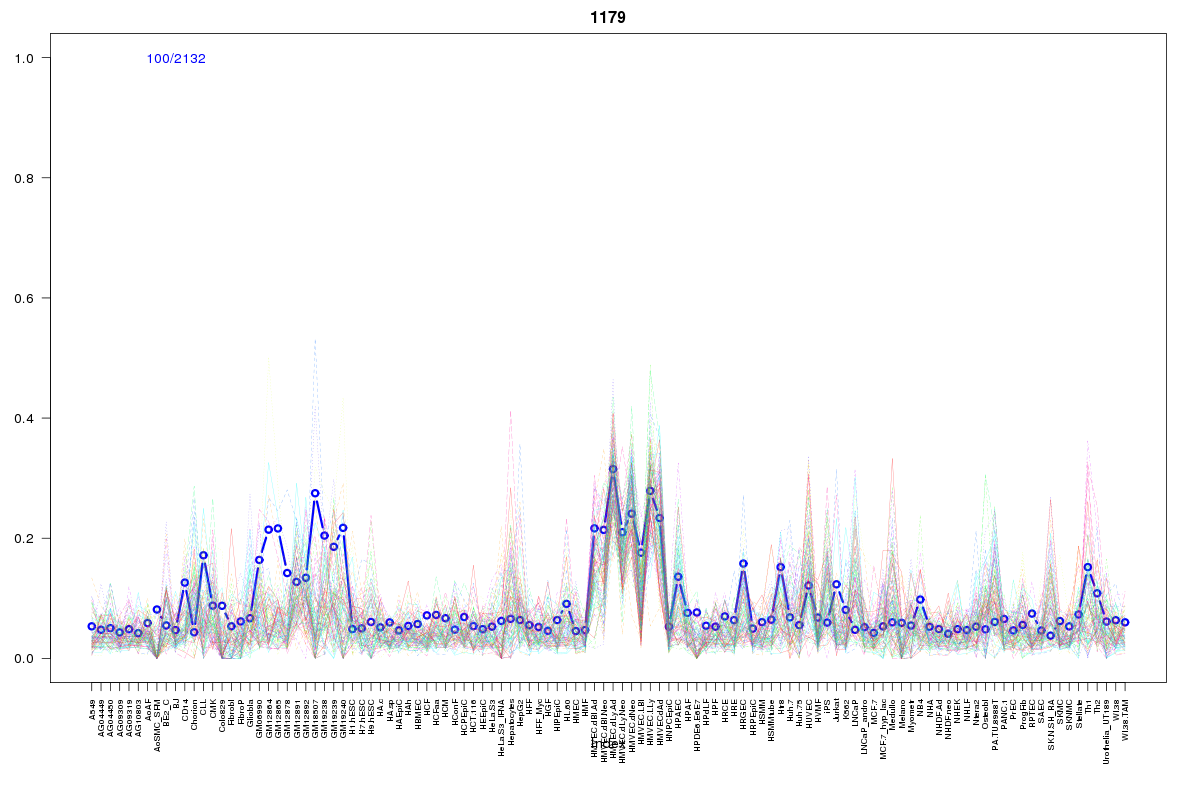 | 1179 | 3 |
 | 1056 | 2 |
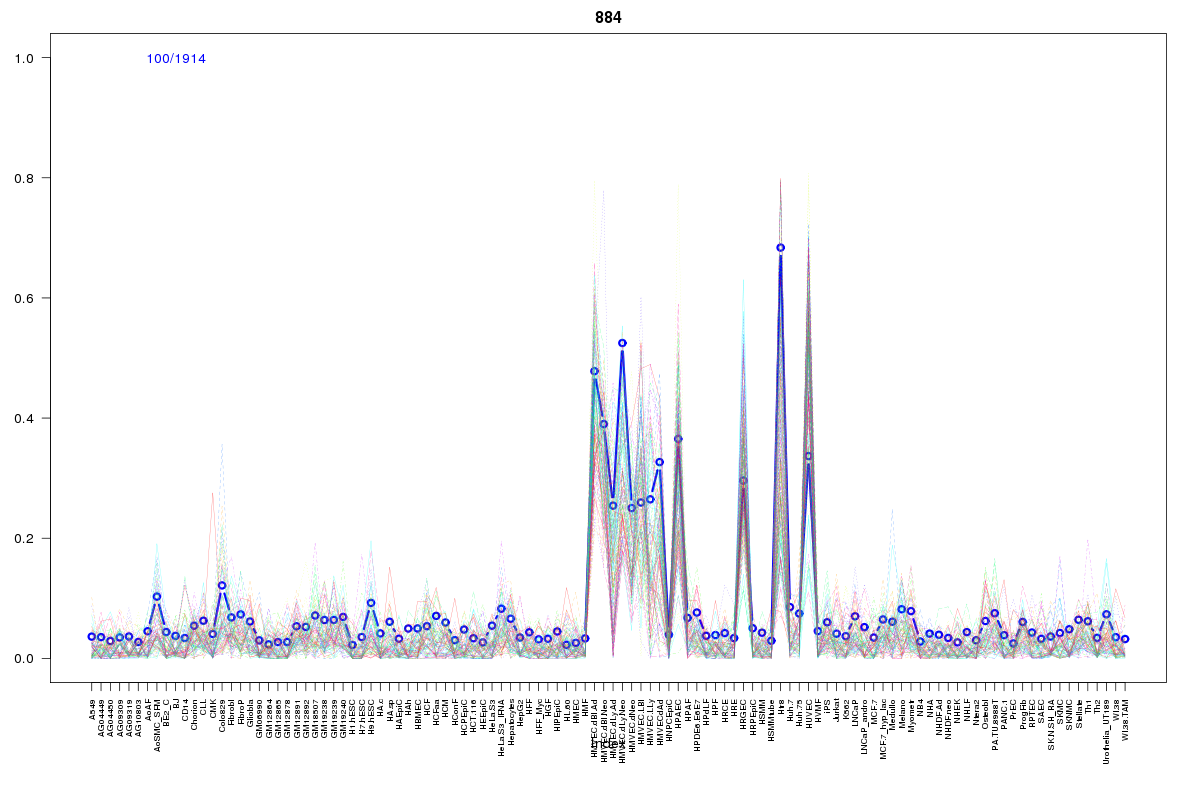 | 884 | 2 |
 | 935 | 2 |
 | 687 | 2 |
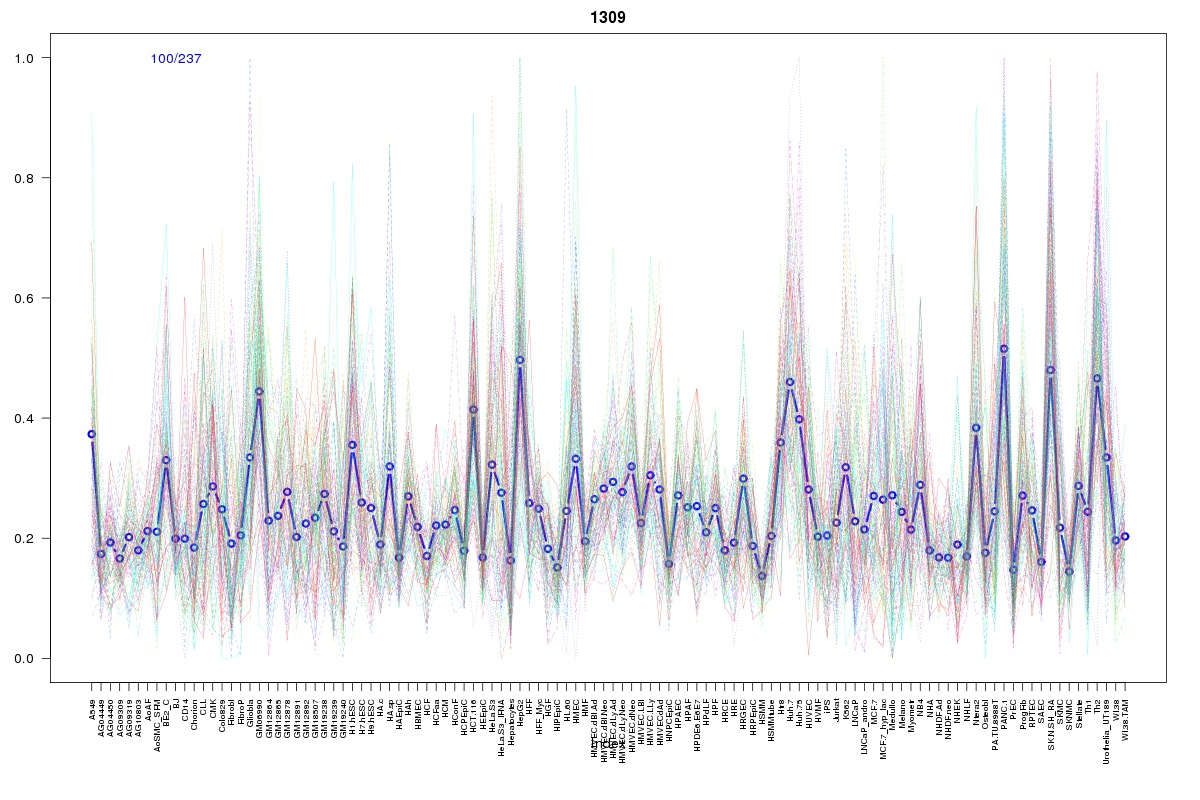 | 1309 | 2 |
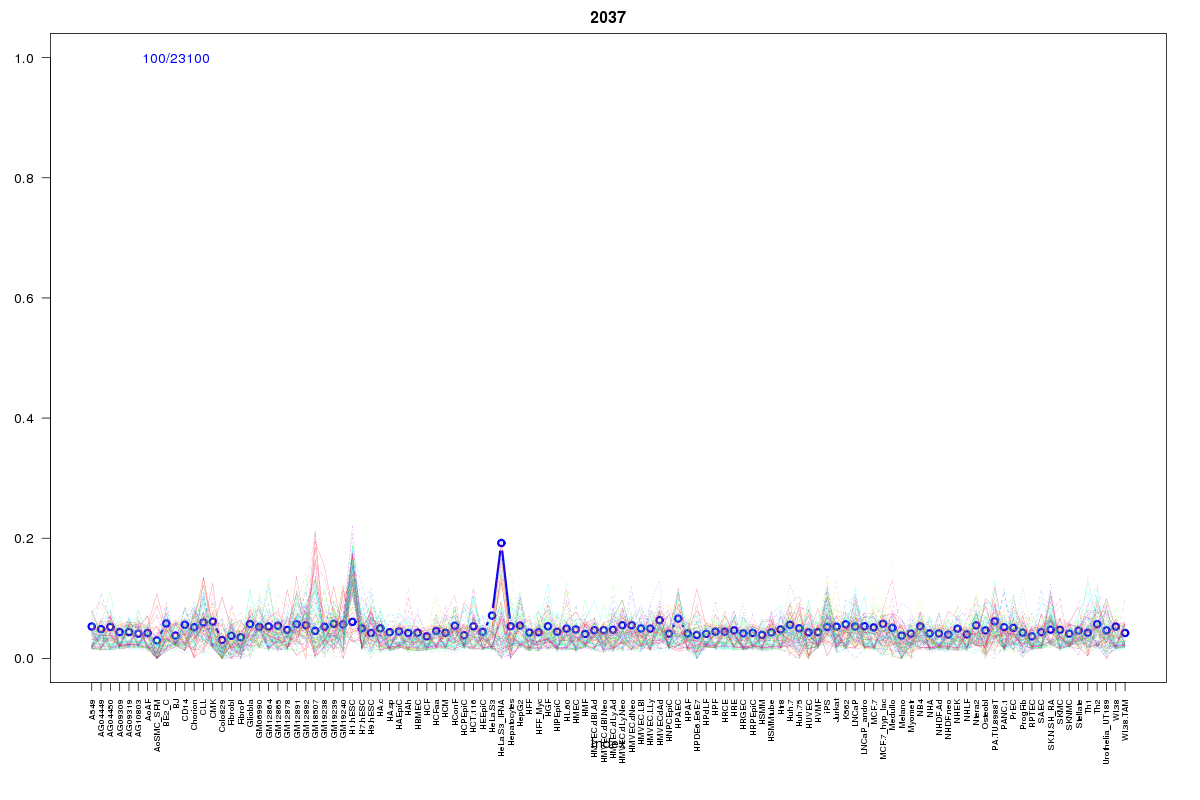 | 2037 | 2 |
 | 2055 | 2 |
 | 948 | 1 |
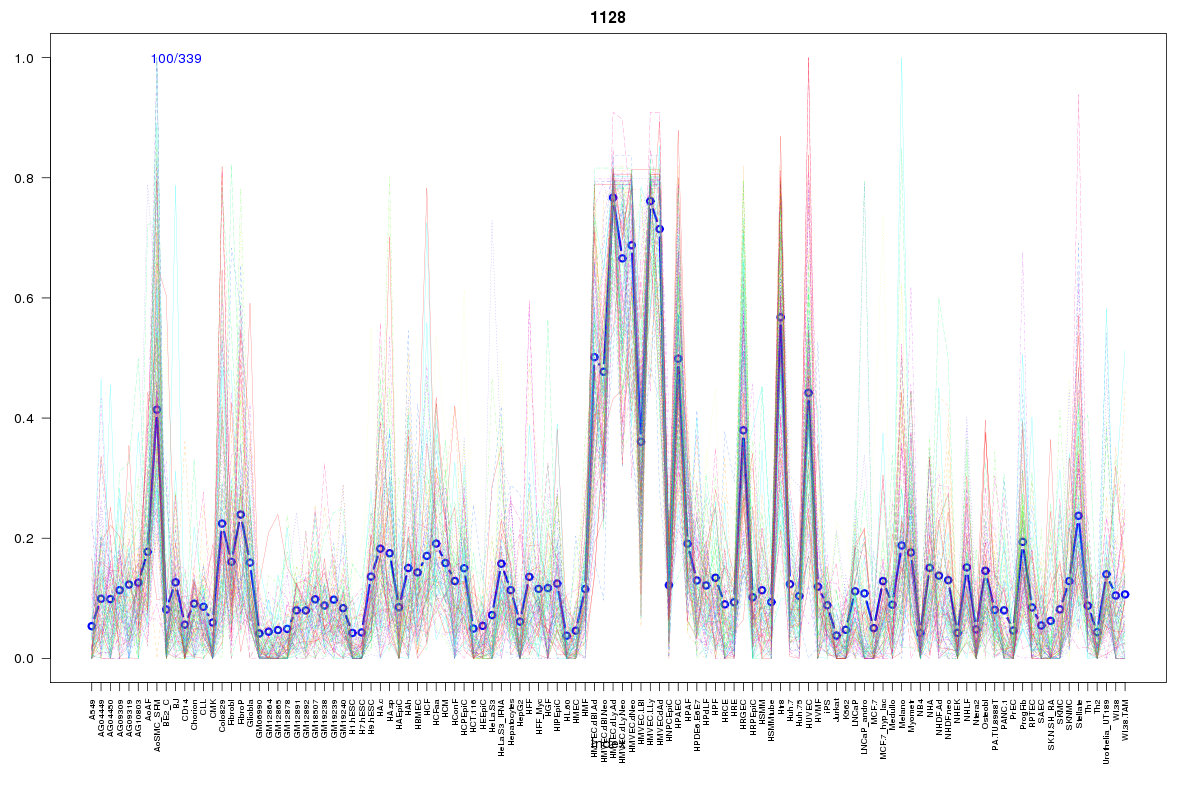 | 1128 | 1 |
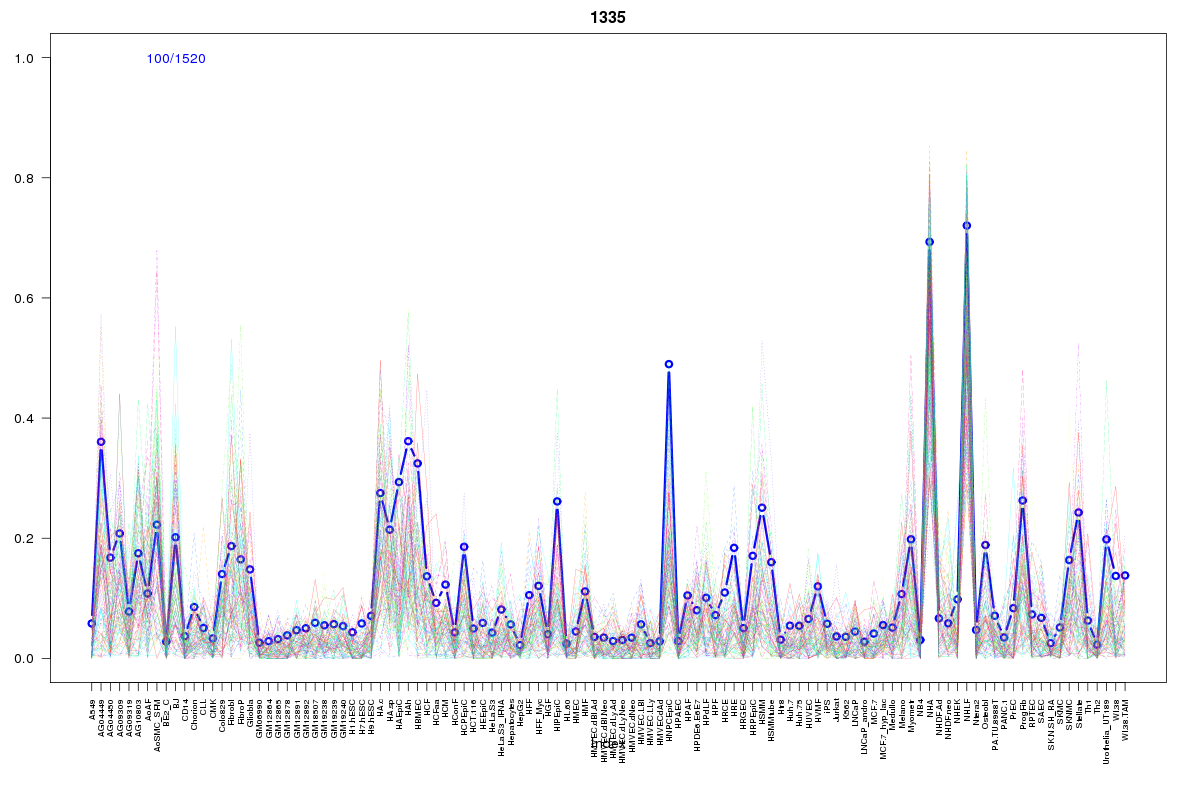 | 1335 | 1 |
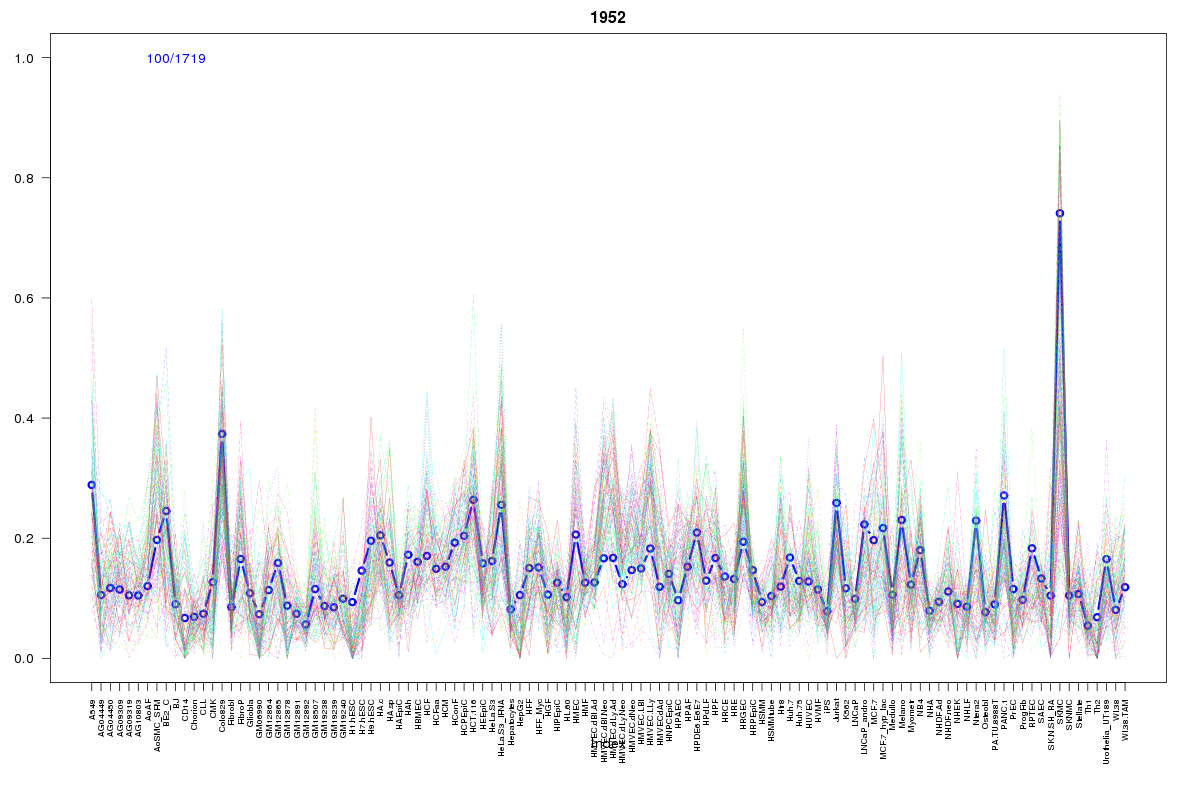 | 1952 | 1 |
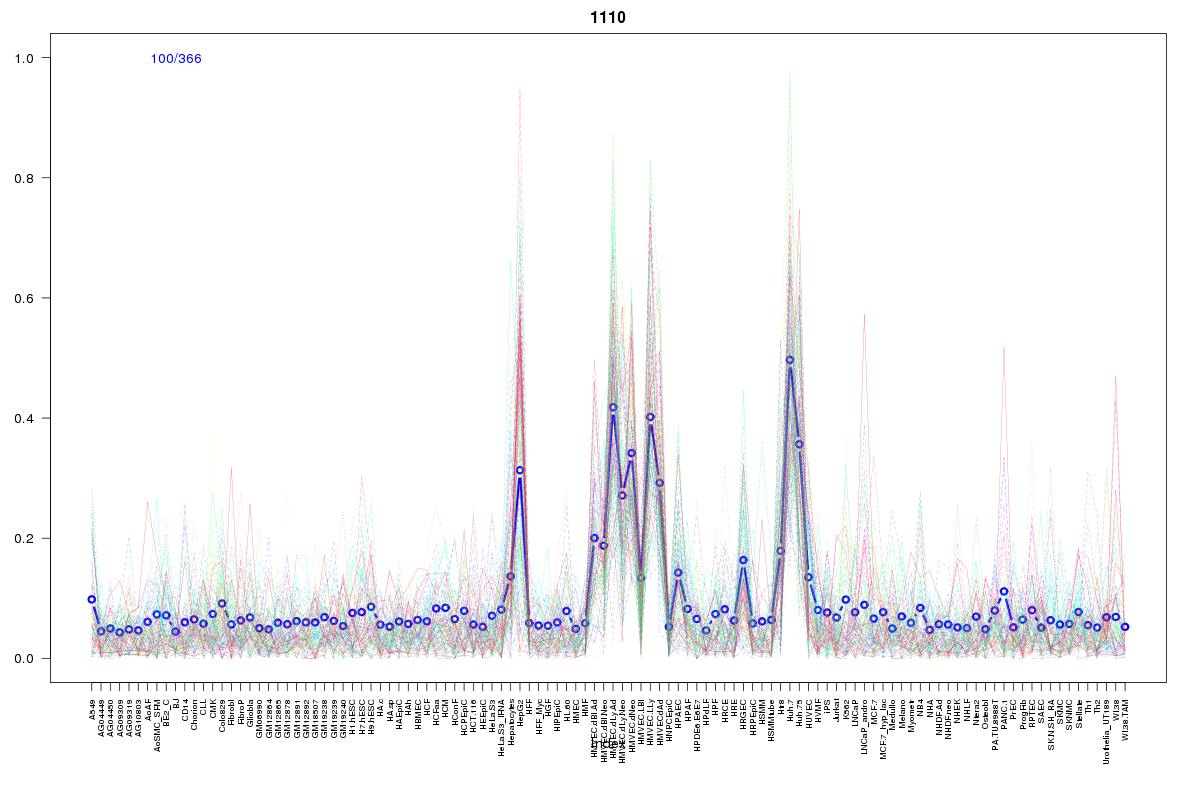 | 1110 | 1 |
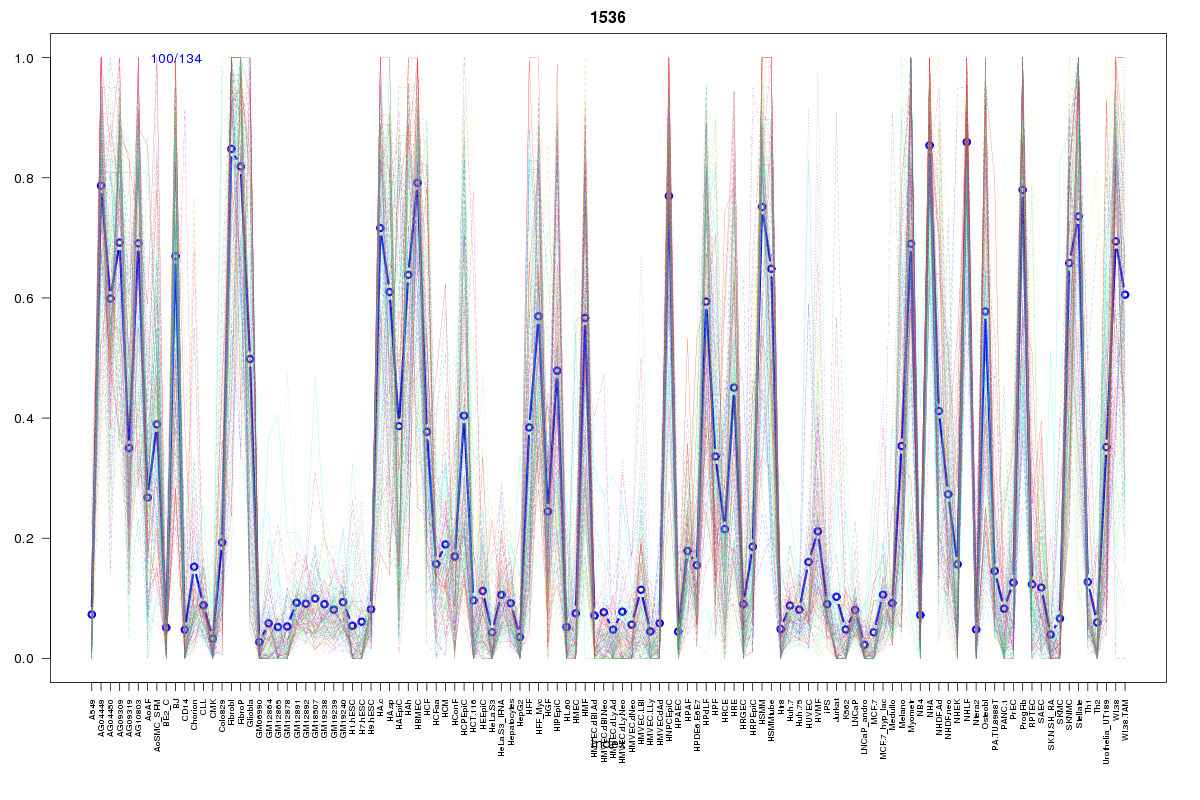 | 1536 | 1 |
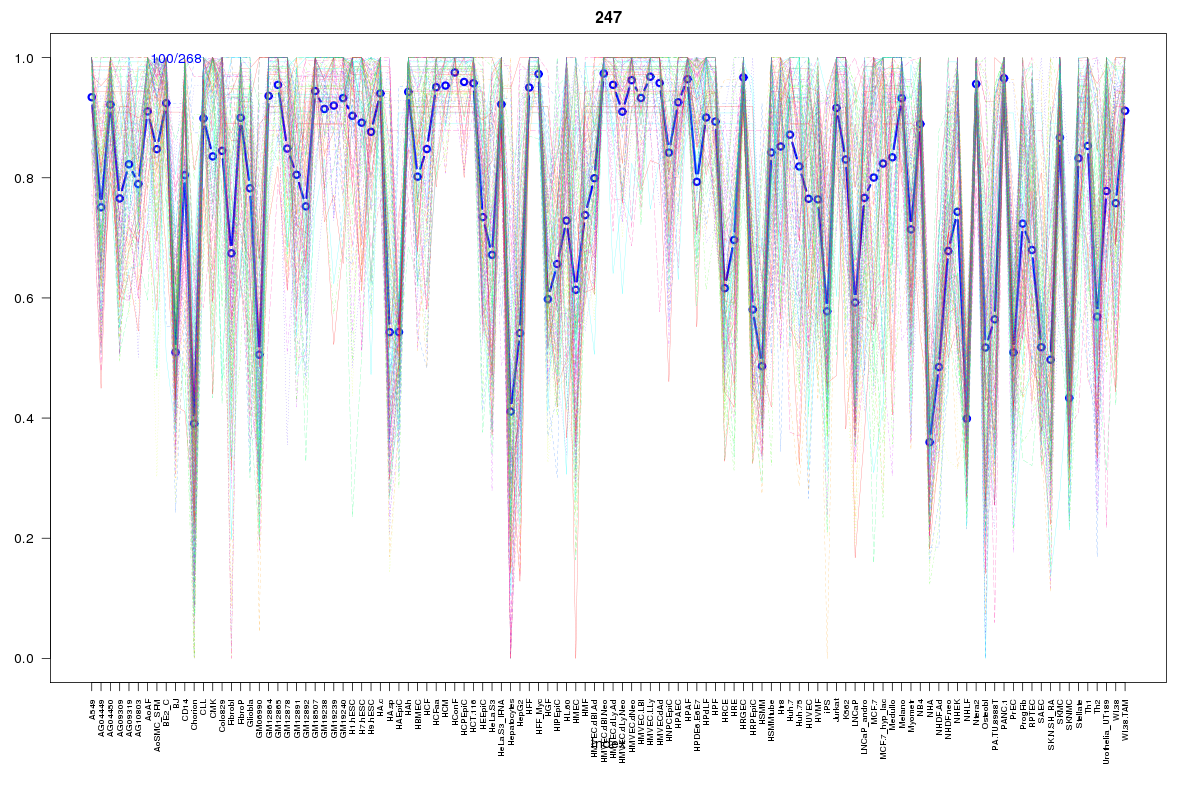 | 247 | 1 |
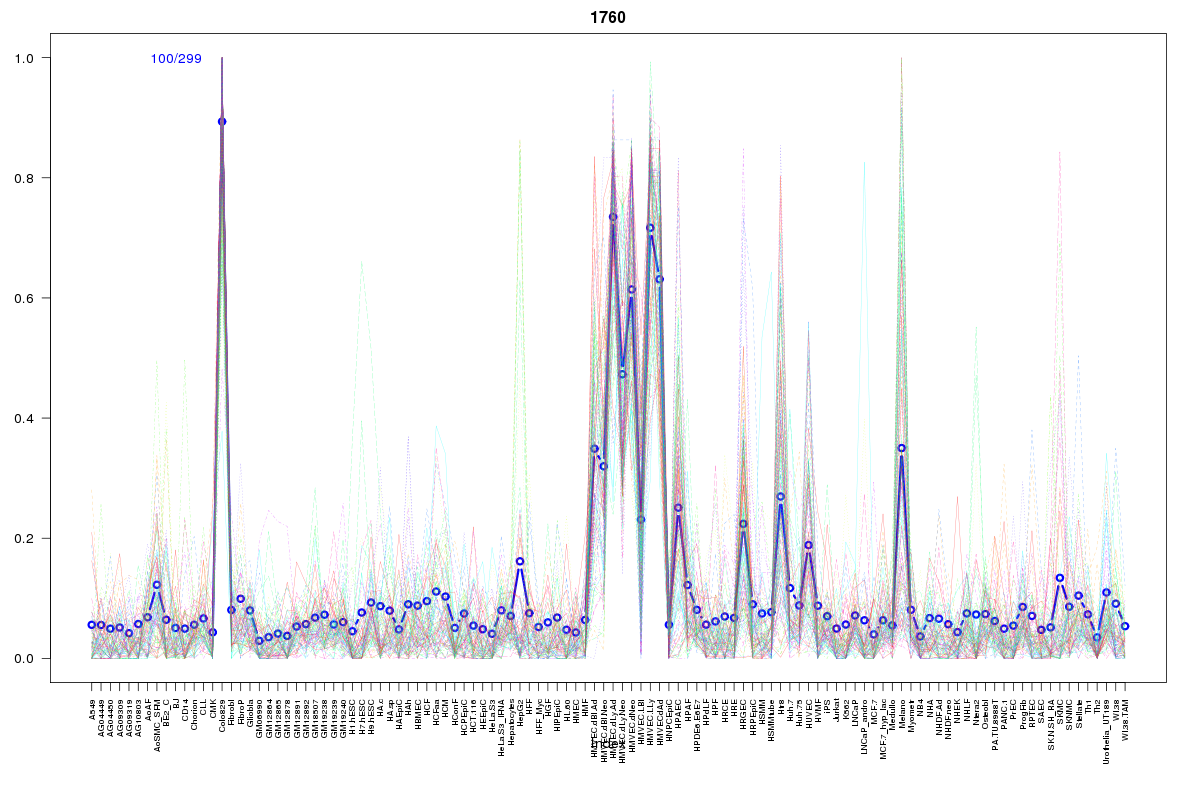 | 1760 | 1 |
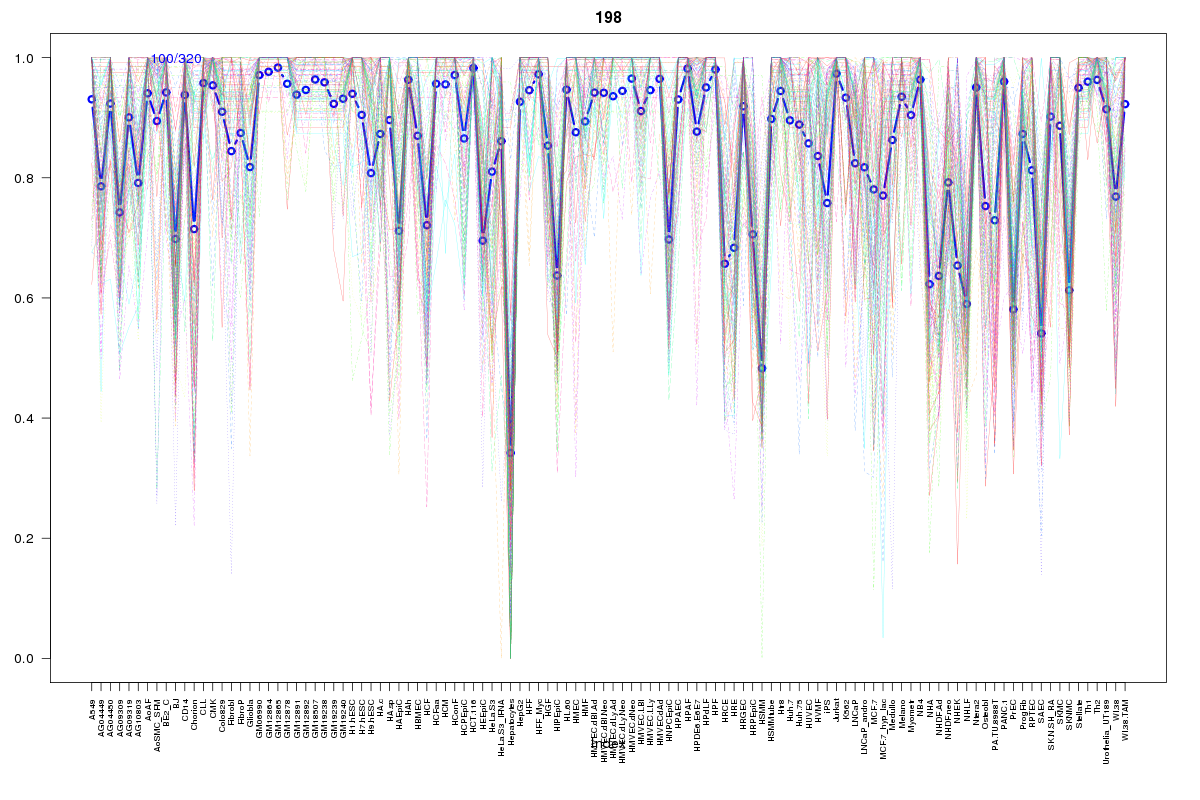 | 198 | 1 |
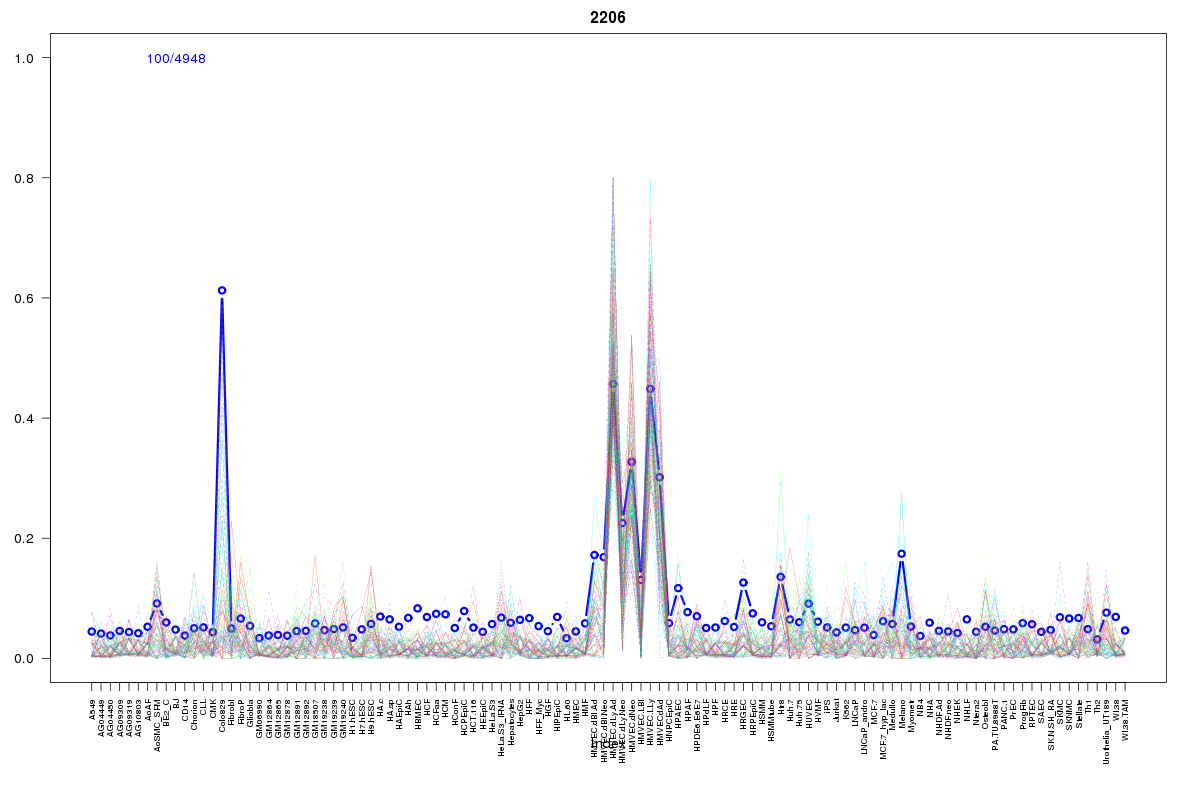 | 2206 | 1 |
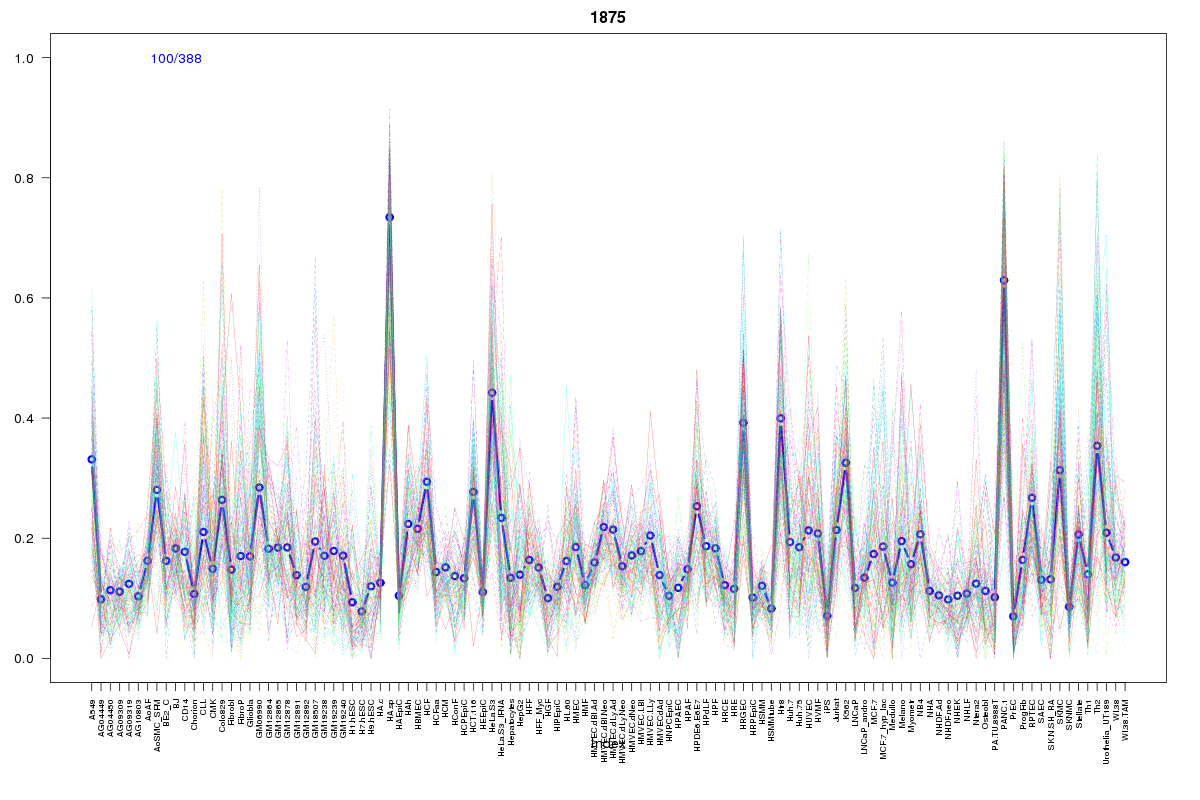 | 1875 | 1 |
 | 739 | 1 |
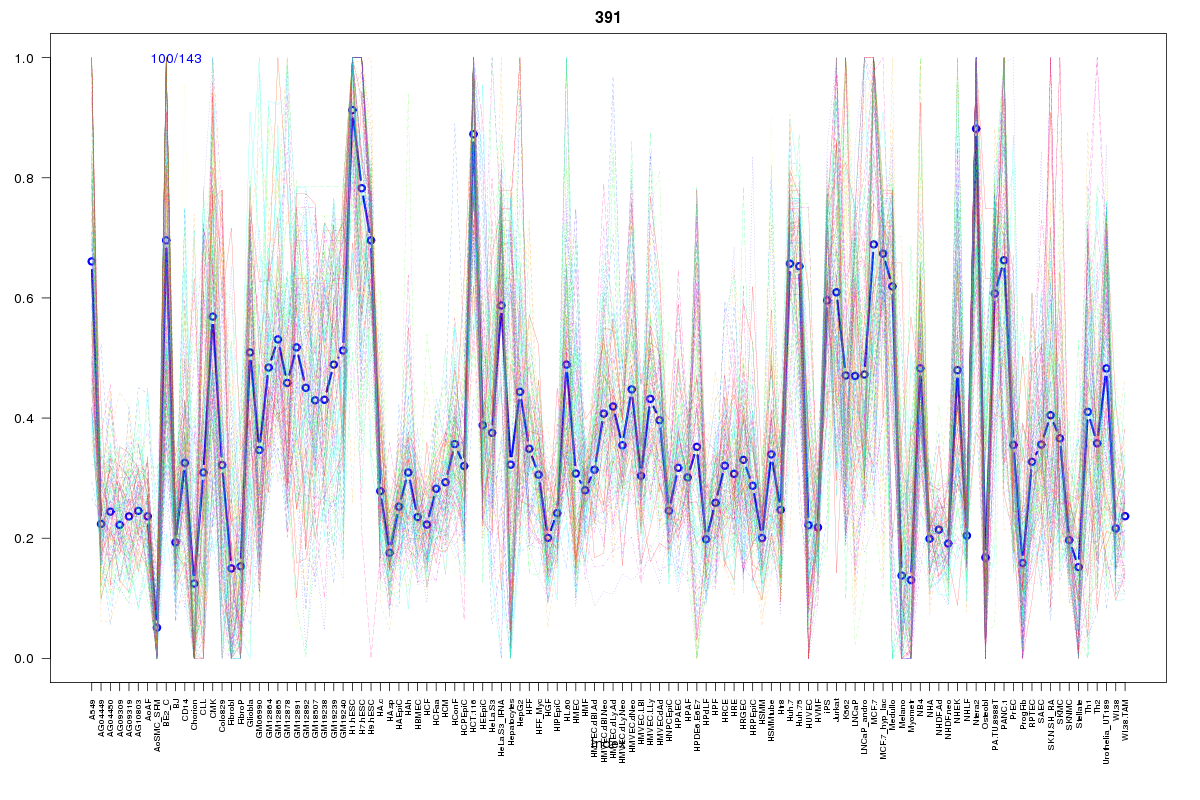 | 391 | 1 |
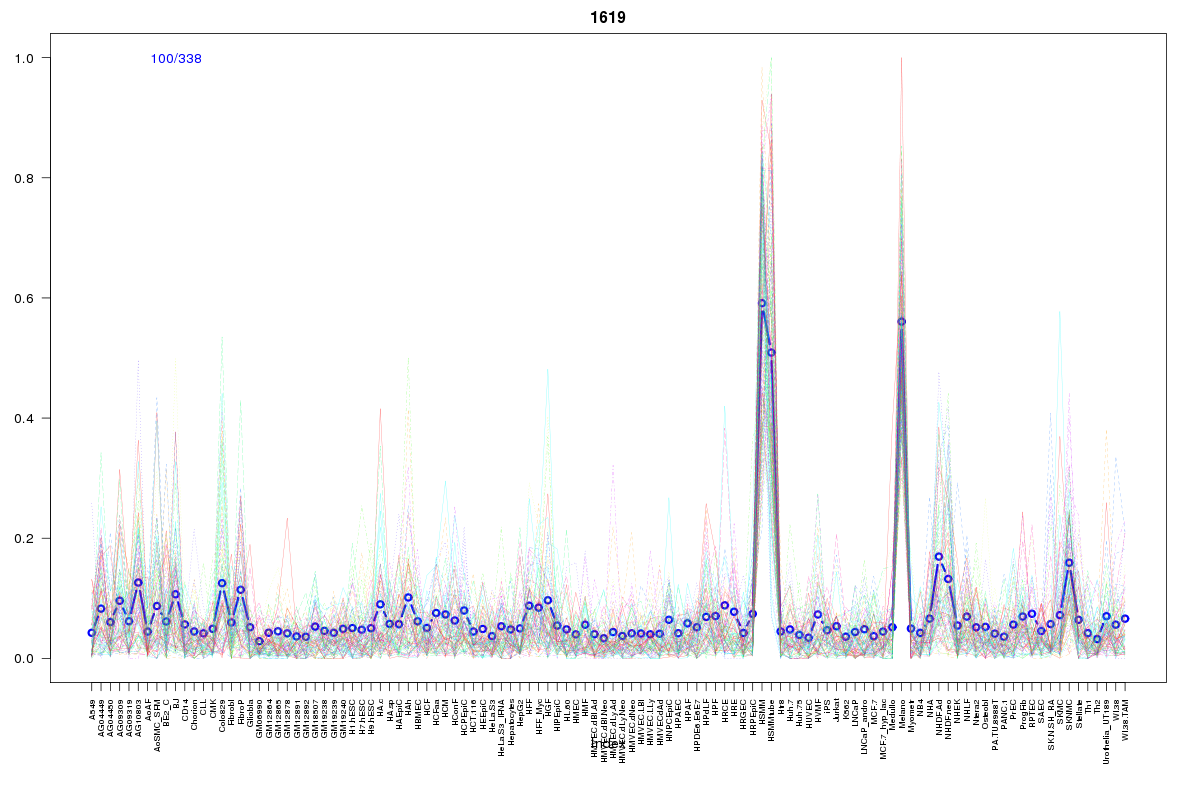 | 1619 | 1 |
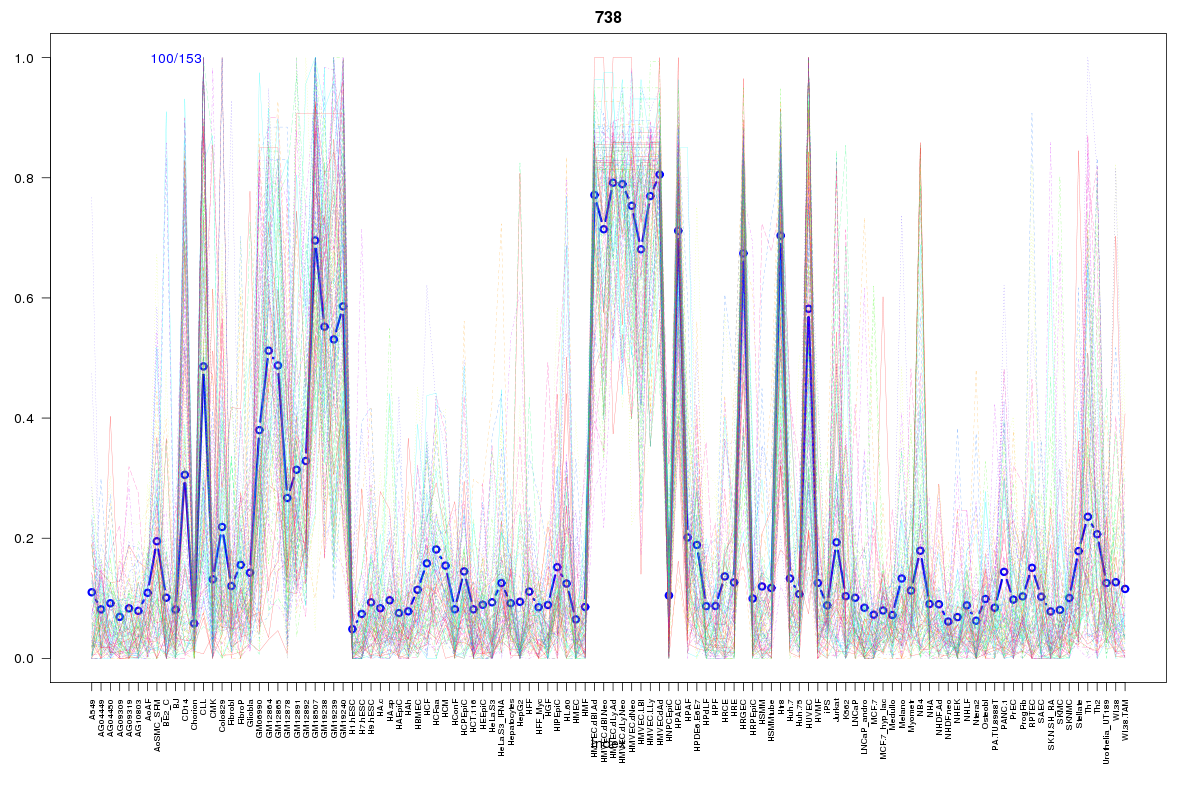 | 738 | 1 |
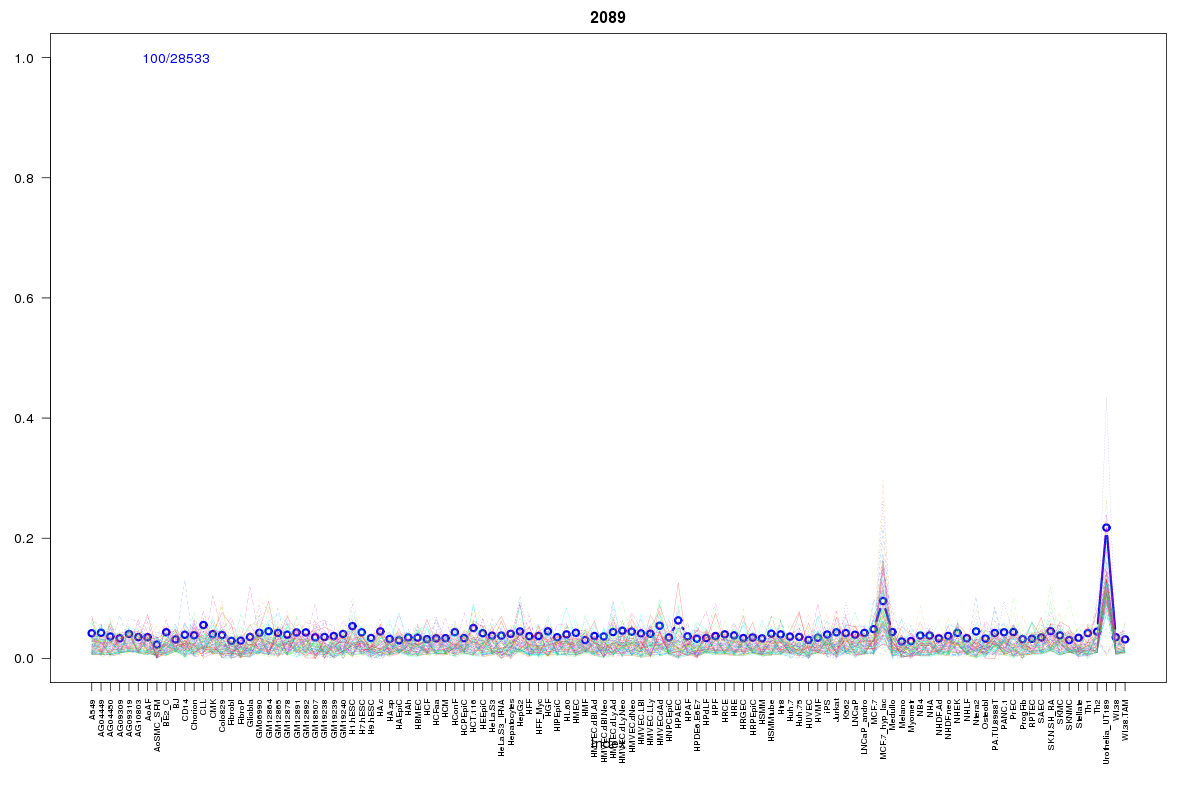 | 2089 | 1 |
 | 655 | 1 |
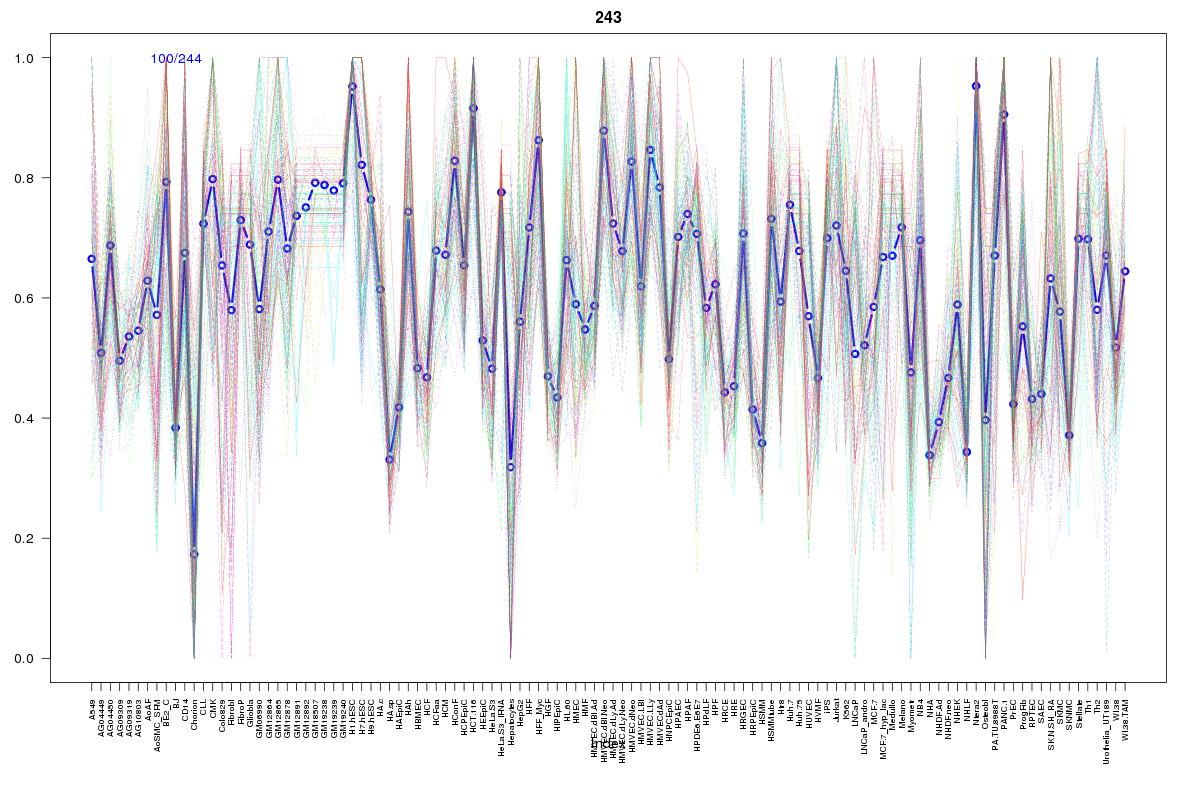 | 243 | 1 |
 | 934 | 1 |
 | 1896 | 1 |
 | 2017 | 1 |
 | 927 | 1 |
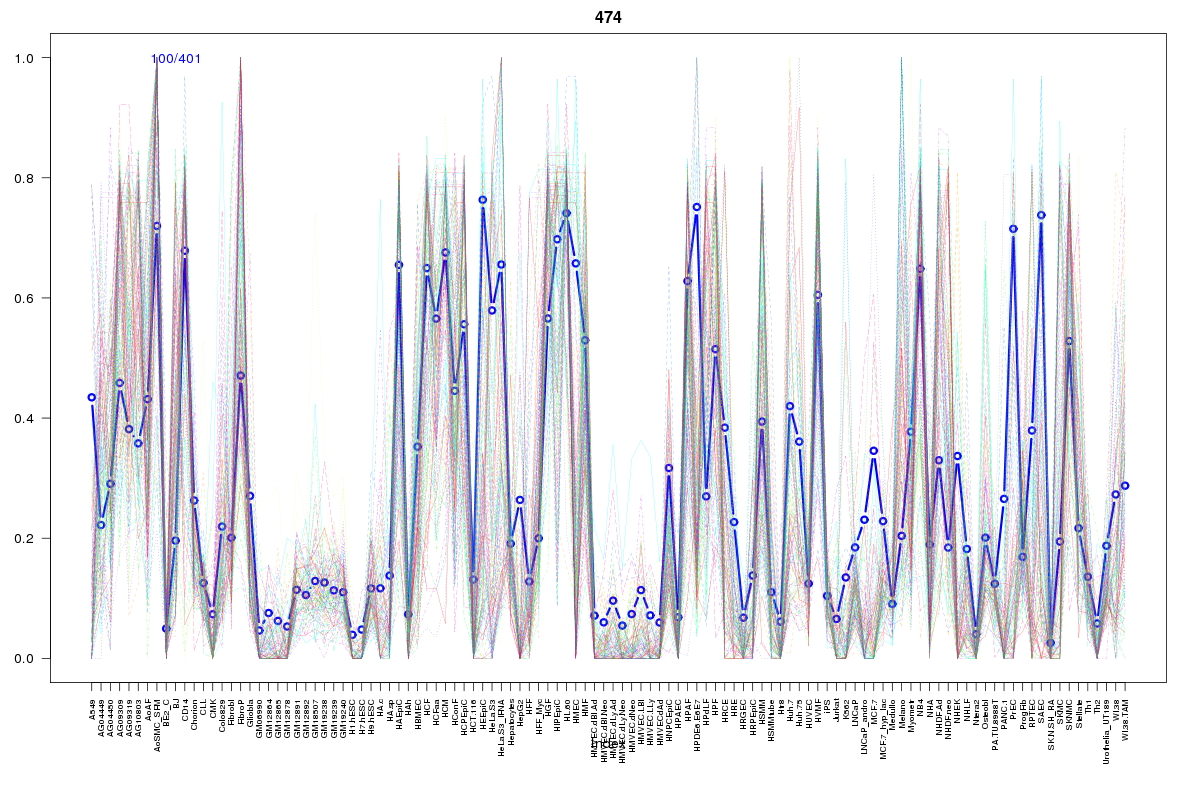 | 474 | 1 |
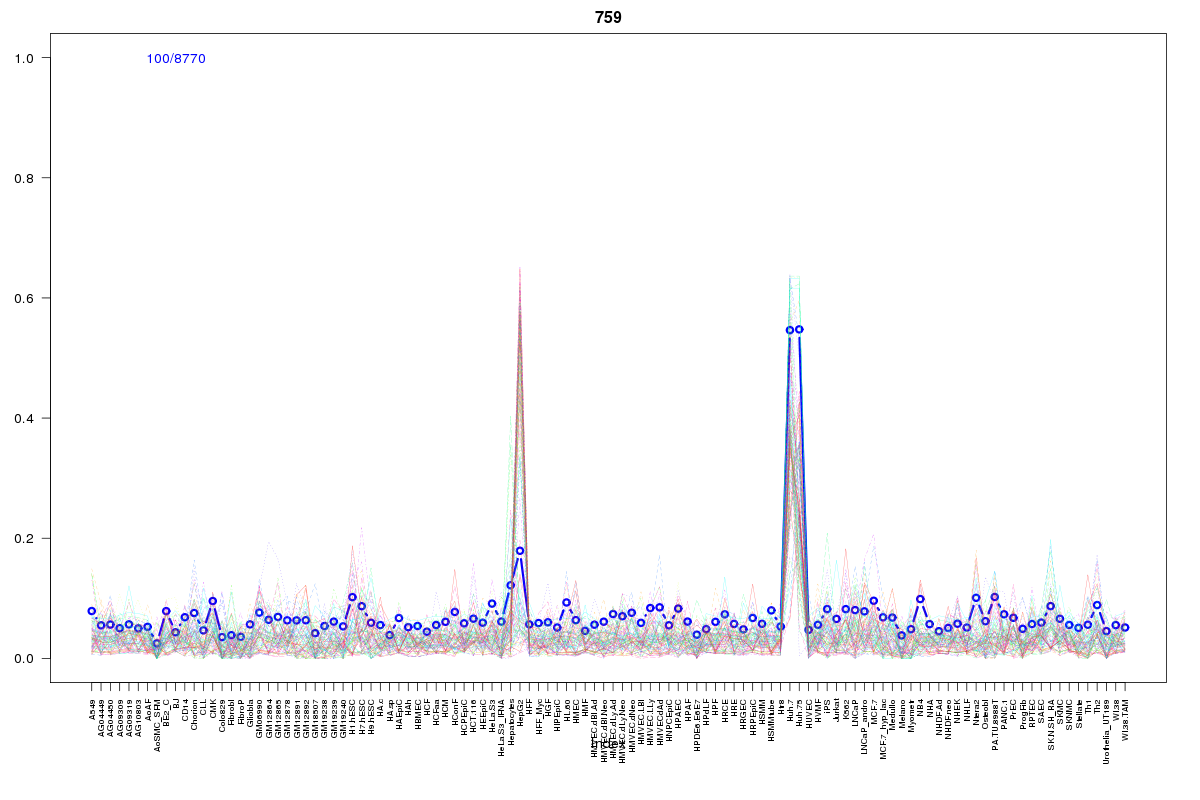 | 759 | 1 |
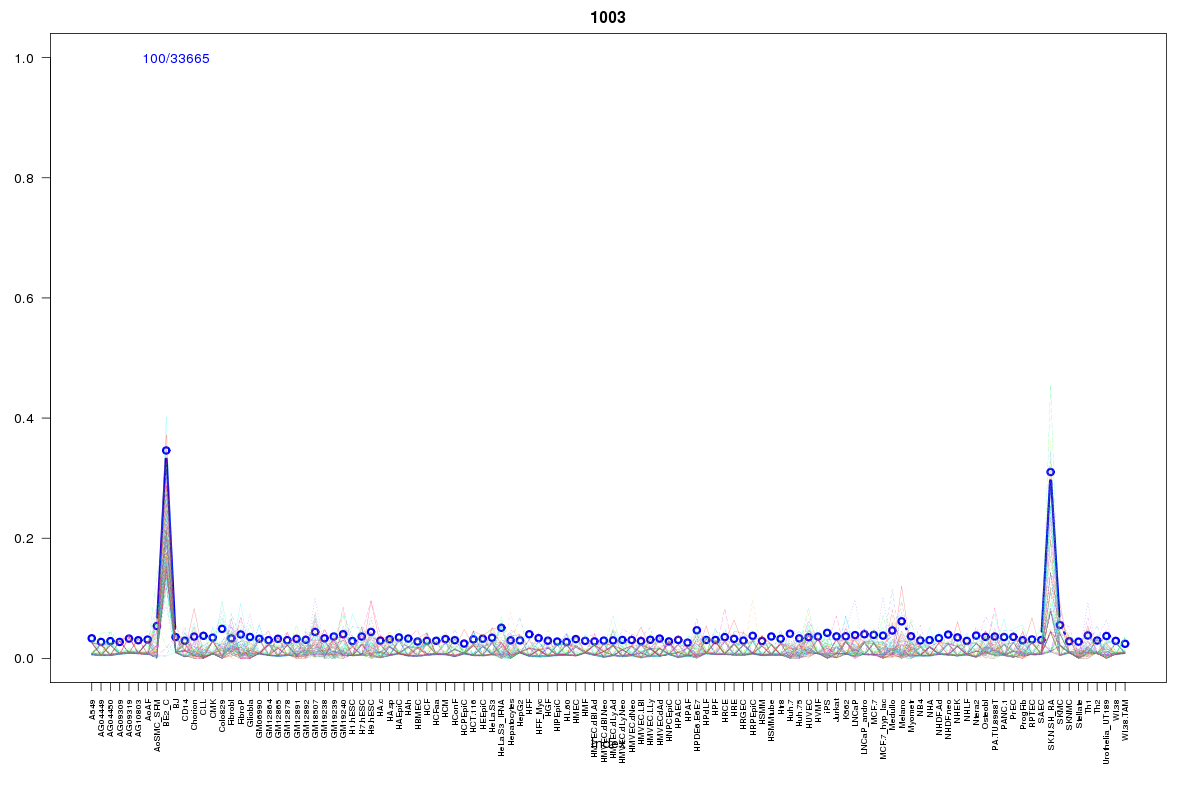 | 1003 | 1 |
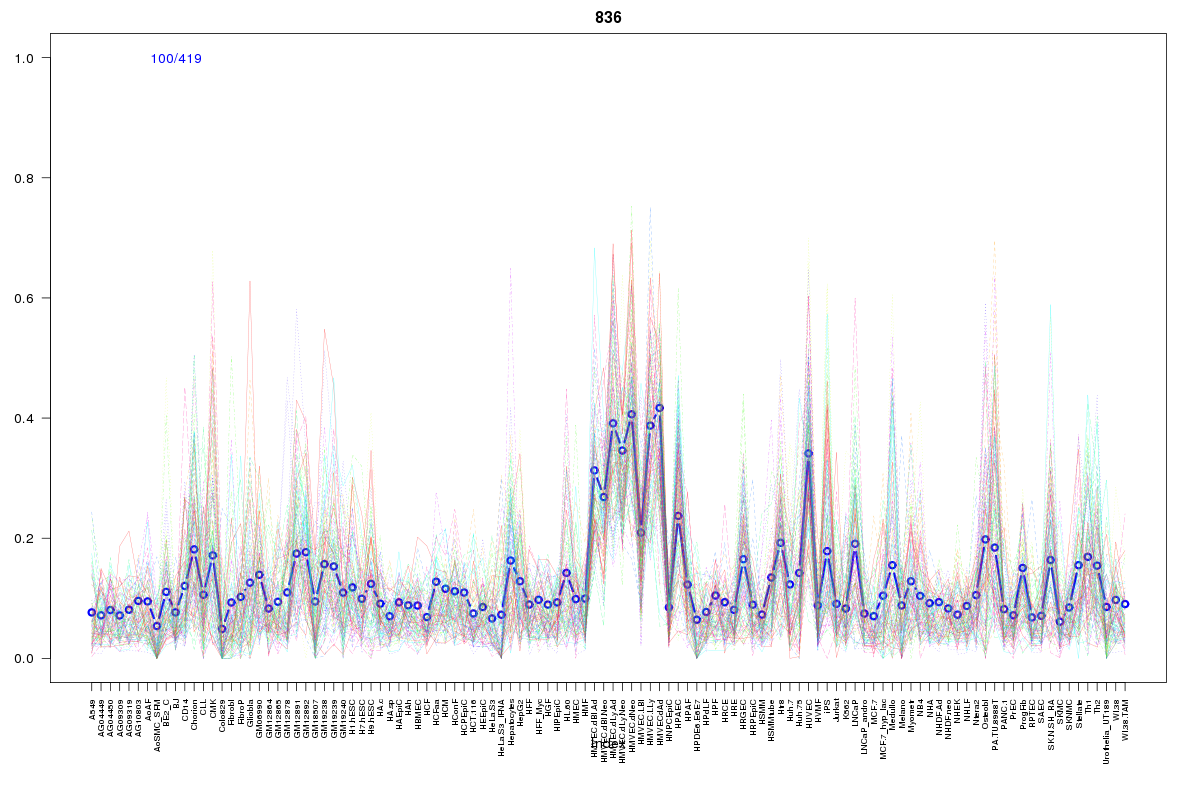 | 836 | 1 |
 | 881 | 1 |
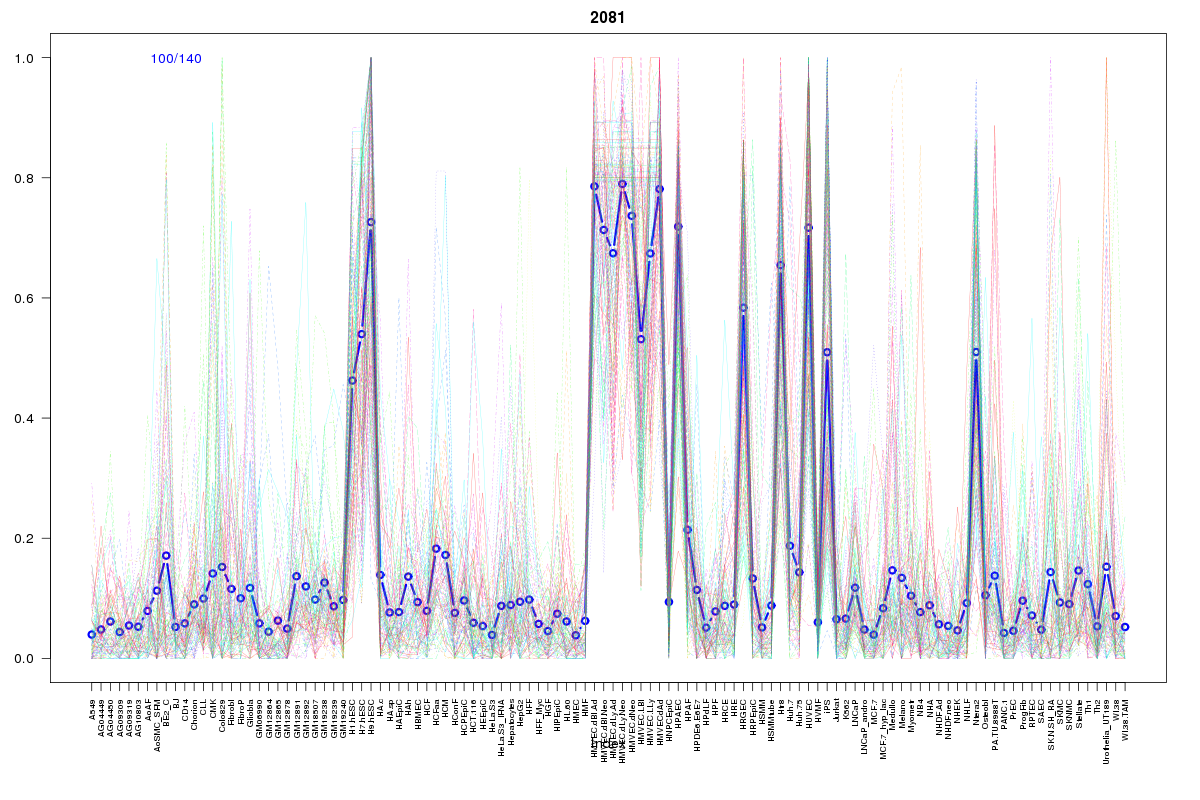 | 2081 | 1 |
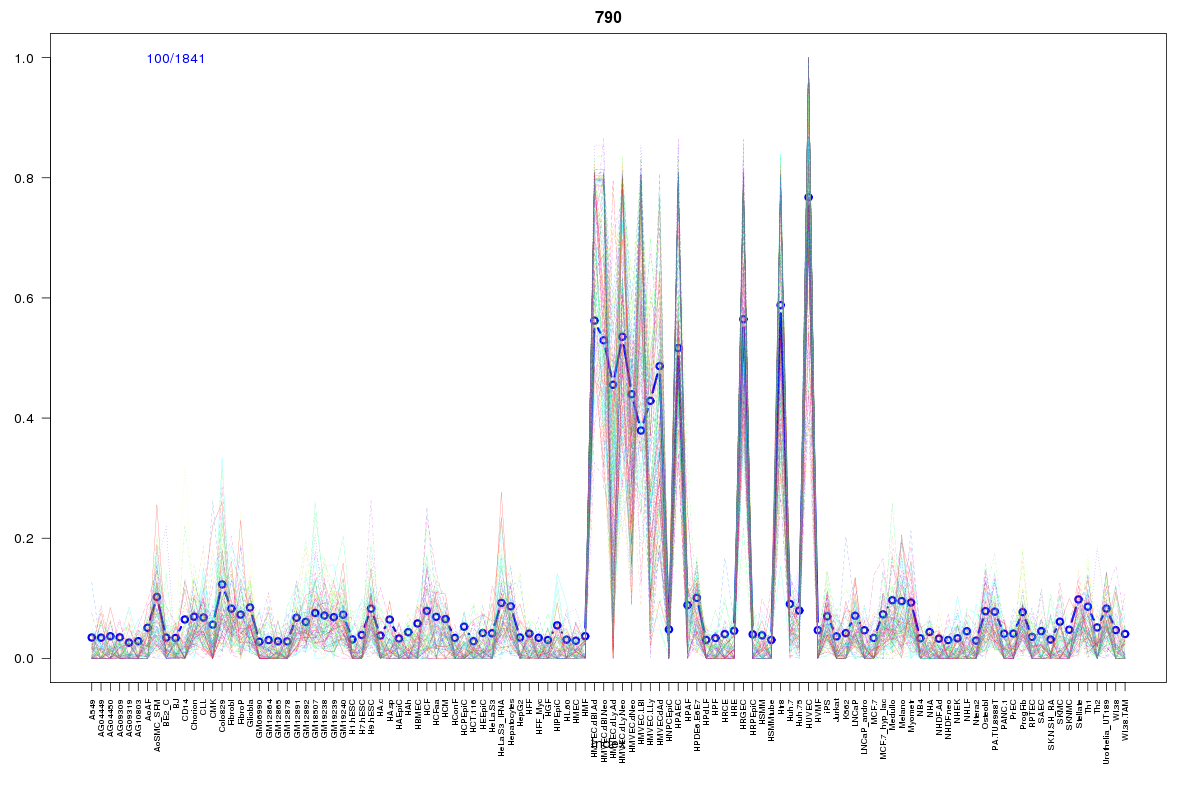 | 790 | 1 |
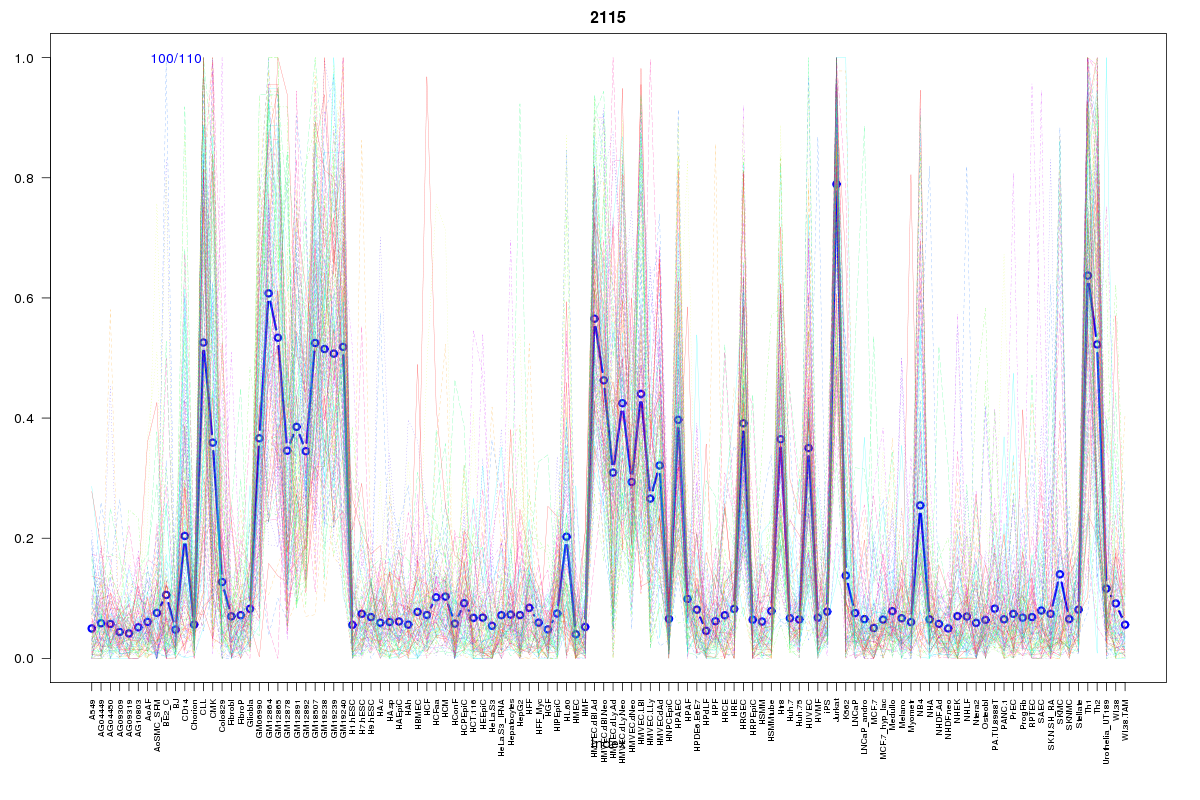 | 2115 | 1 |
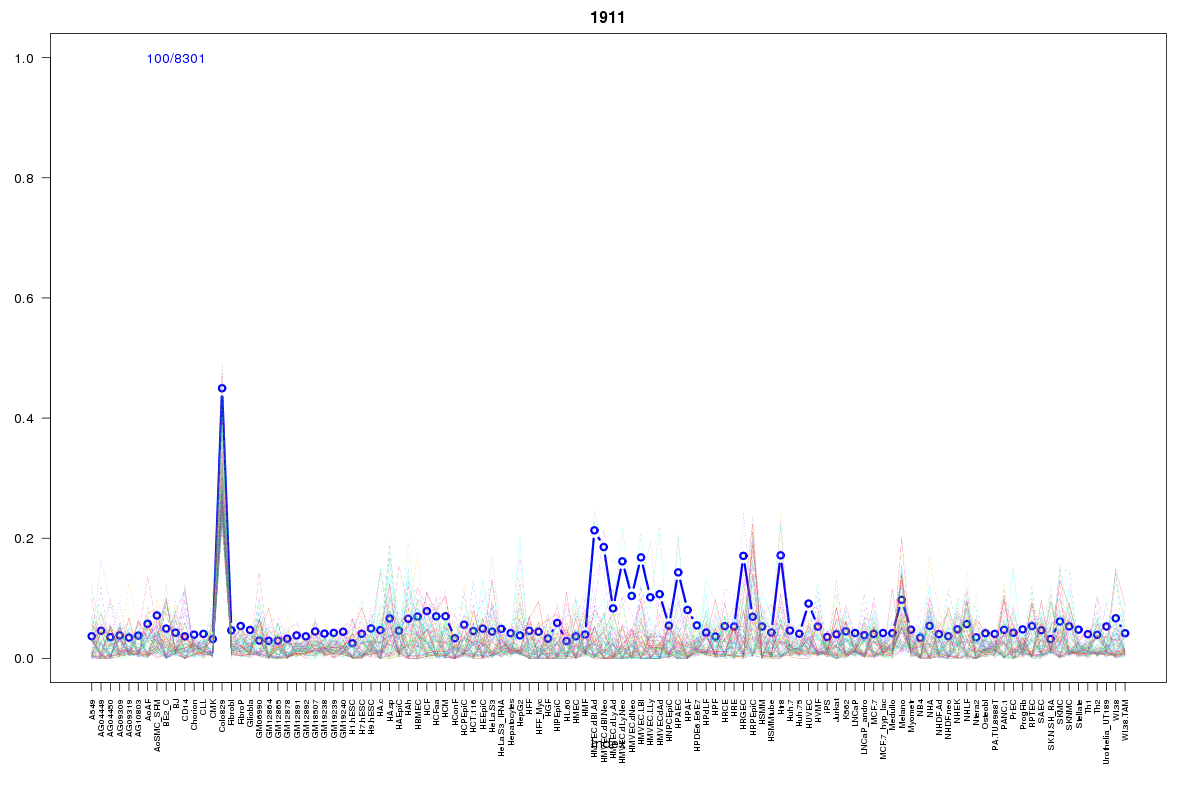 | 1911 | 1 |
 | 510 | 1 |
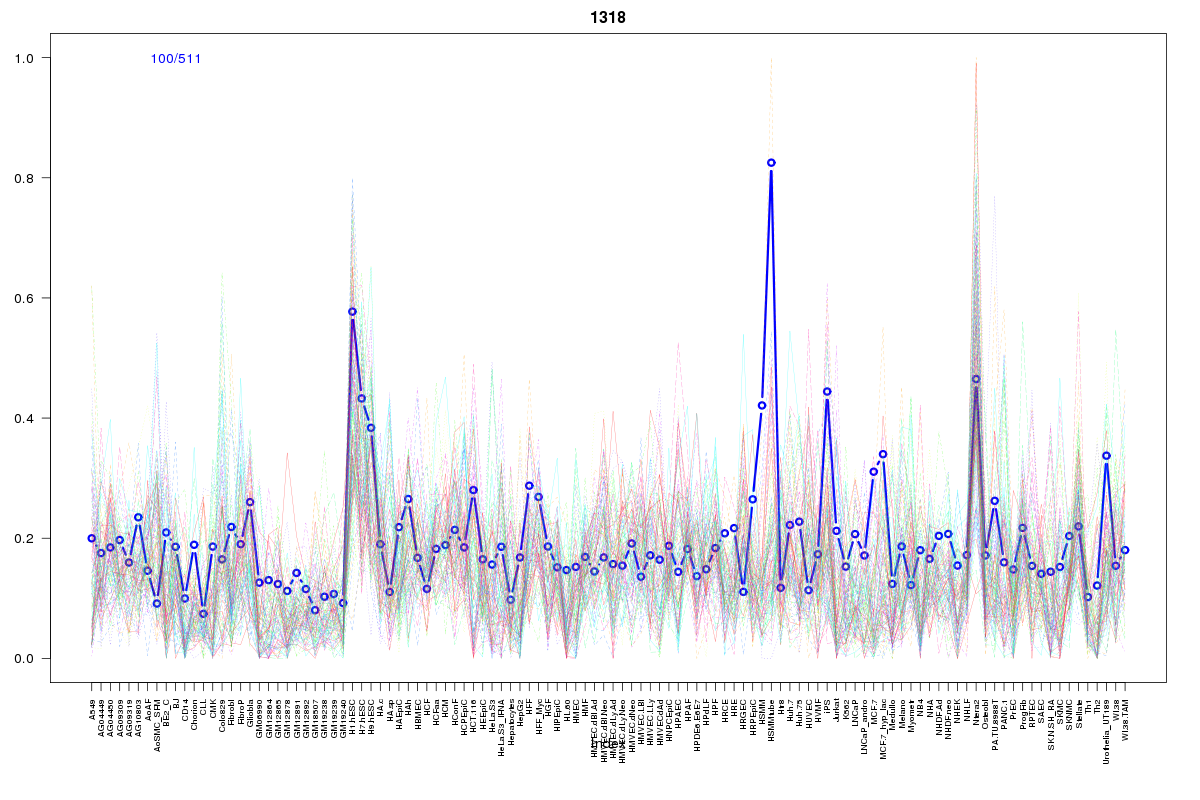 | 1318 | 1 |
Resources
BED file downloads
Connects to 50 DHS sitesTop 10 Correlated DHS Sites
p-values indiciate significant higher or lower correlation| Location | Cluster | P-value |
|---|---|---|
| chr1:154519020-154519170 | 243 | 0 |
| chr1:154475180-154475330 | 1179 | 0.003 |
| chr1:154494445-154494595 | 935 | 0.003 |
| chr1:154556860-154557010 | 790 | 0.003 |
| chr1:154472100-154472250 | 884 | 0.003 |
| chr1:154465860-154466010 | 738 | 0.003 |
| chr1:154531760-154531910 | 1309 | 0.003 |
| chr1:154474585-154474735 | 836 | 0.003 |
| chr1:154474885-154475035 | 2081 | 0.004 |
| chr1:154471940-154472090 | 2017 | 0.004 |
| chr1:154581020-154581170 | 1318 | 0.004 |
External Databases
UCSCEnsembl (ENSG00000160714)