Gene: LAPTM5
chr1: 31205315-31230667Expression Profile
(log scale)
Graphical Connections
Distribution of linked clusters:
You may find it interesting if many of the connected DHS sites belong to the same cluster.| Cluster Profile | Cluster ID | Number of DHS sites in this cluster |
|---|---|---|
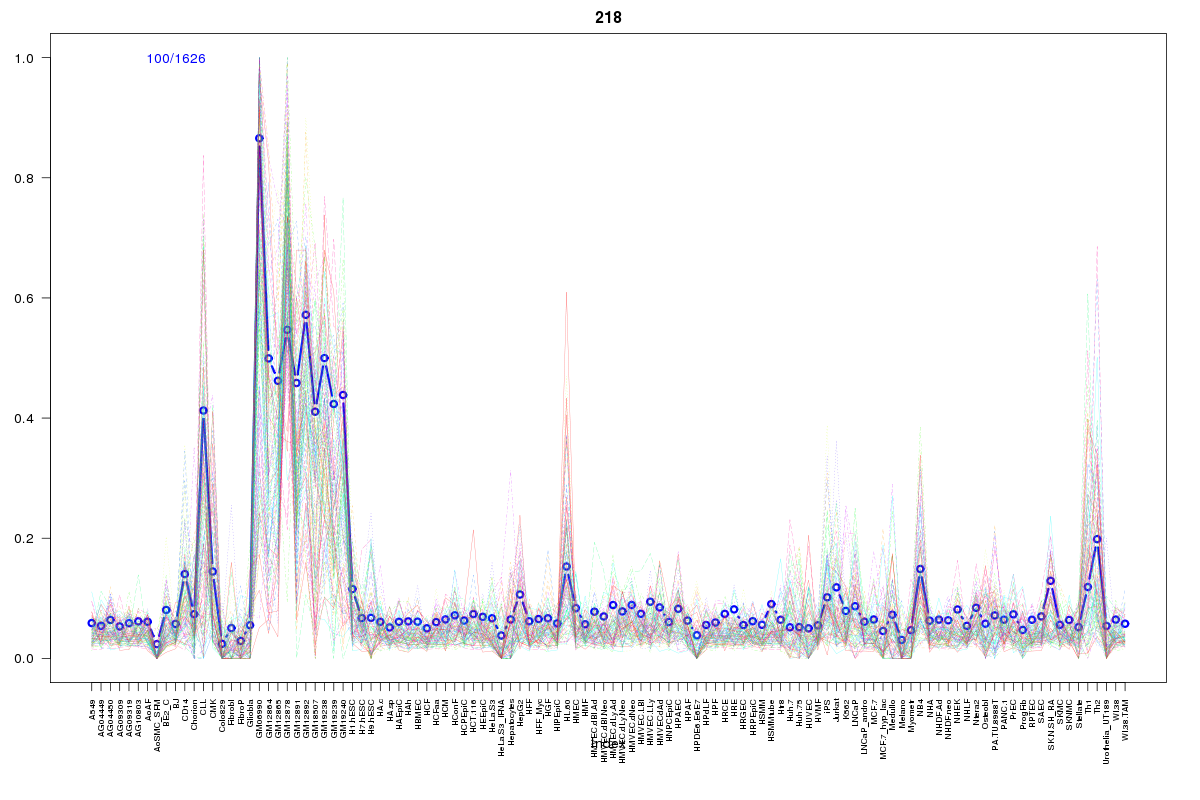 | 218 | 9 |
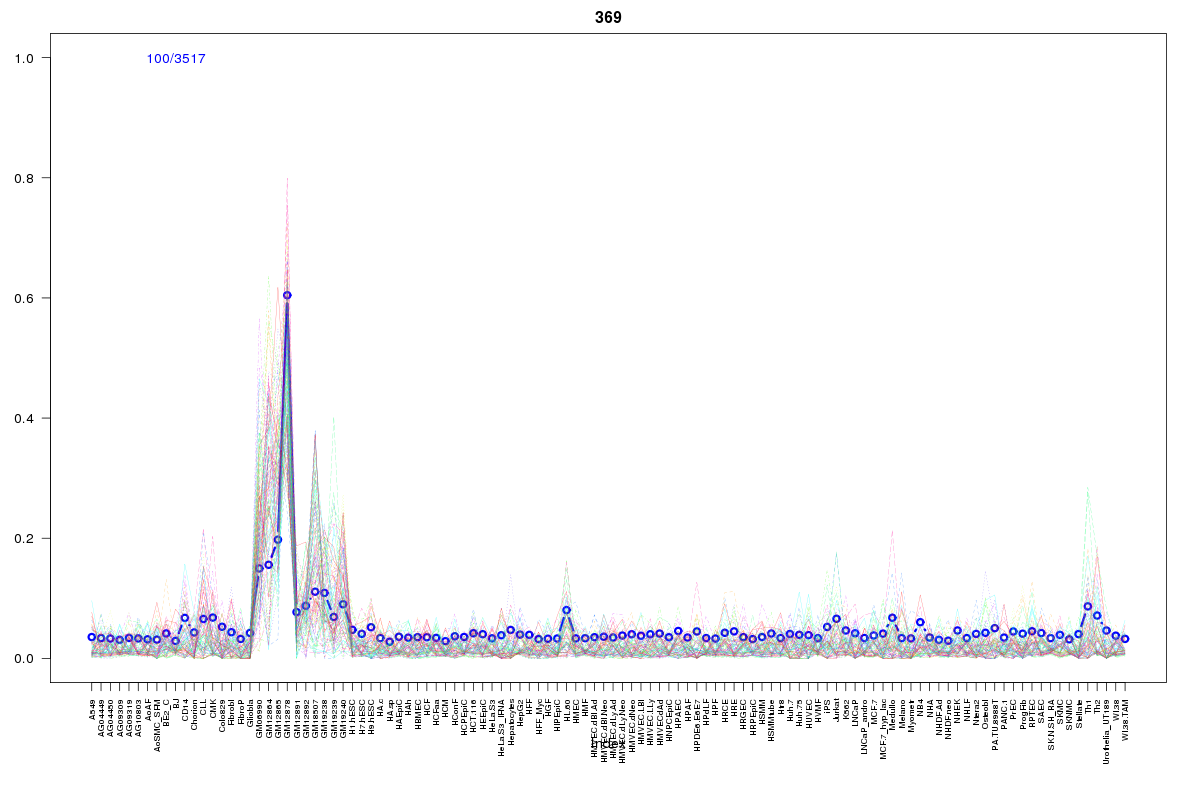 | 369 | 3 |
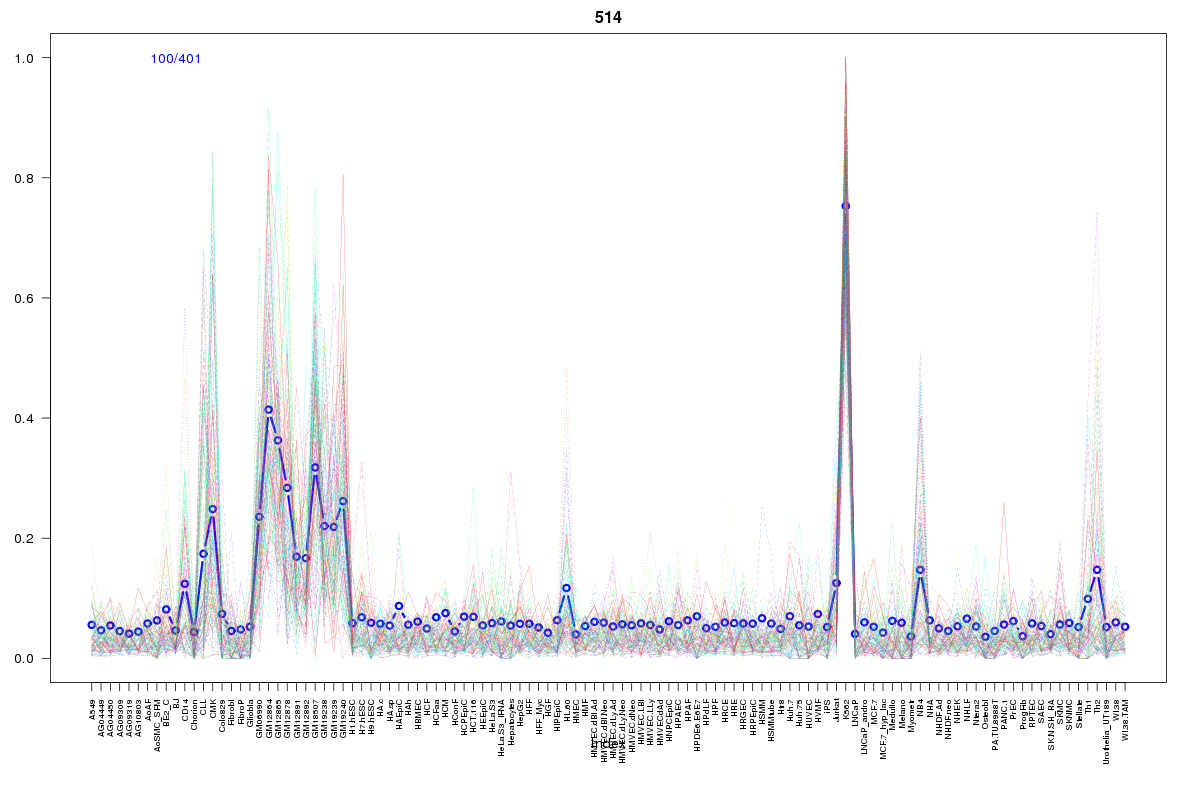 | 514 | 3 |
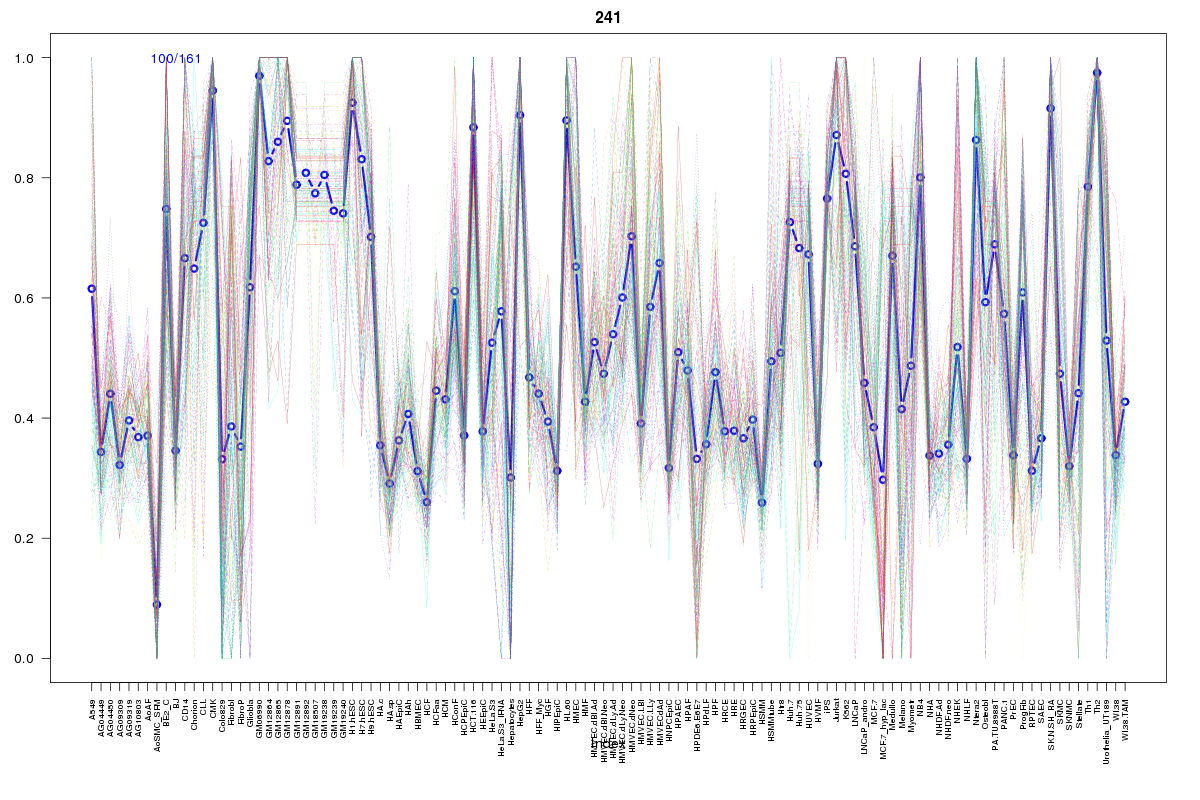 | 241 | 2 |
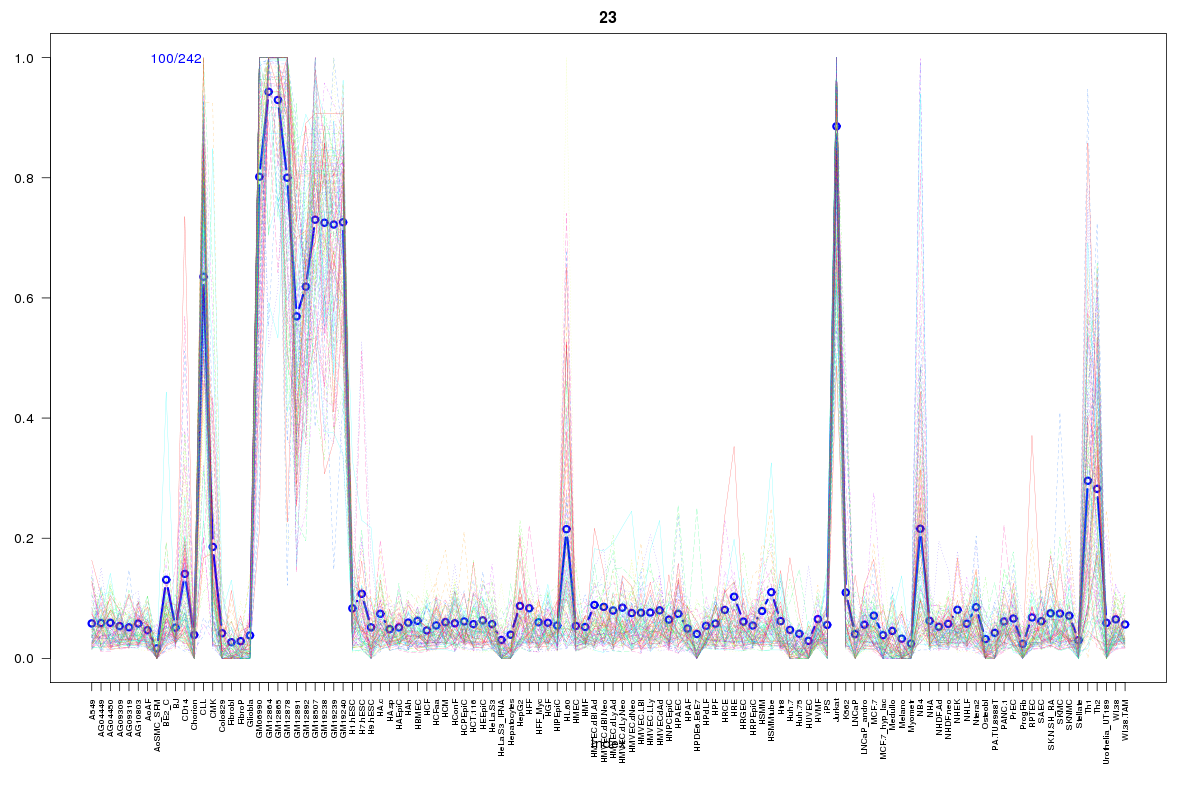 | 23 | 2 |
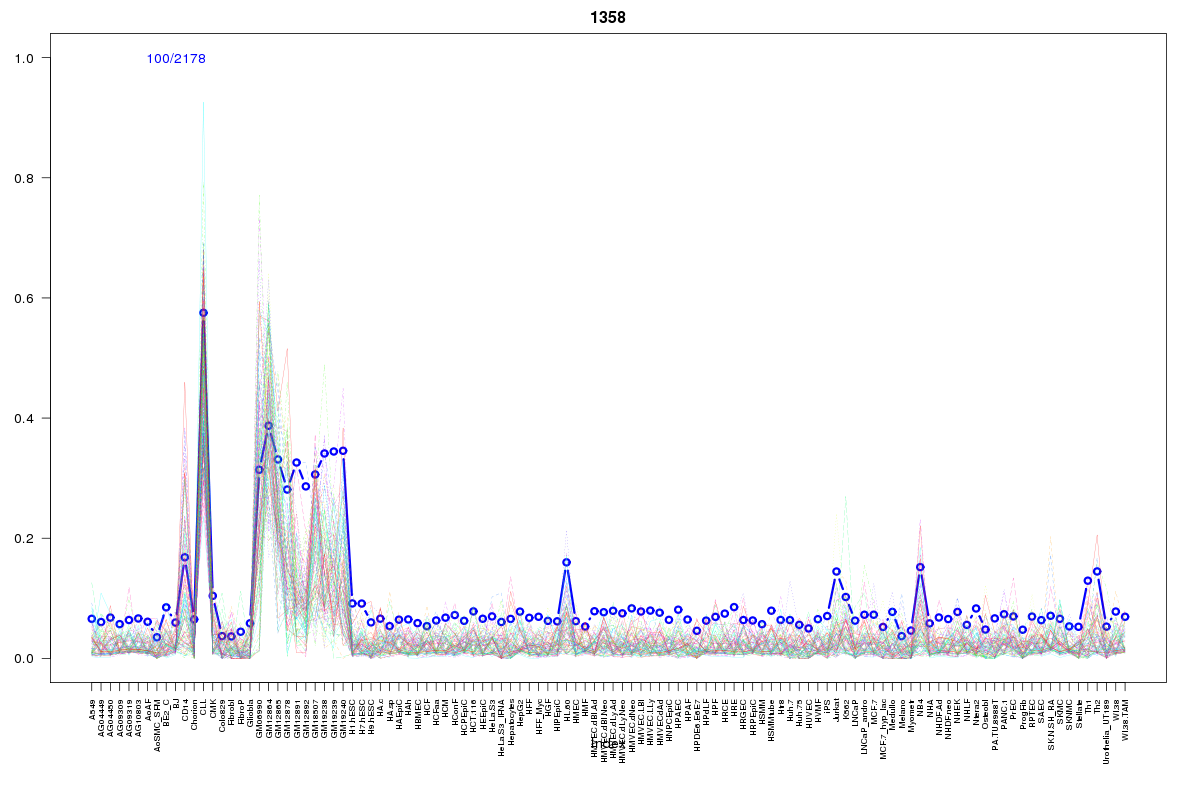 | 1358 | 2 |
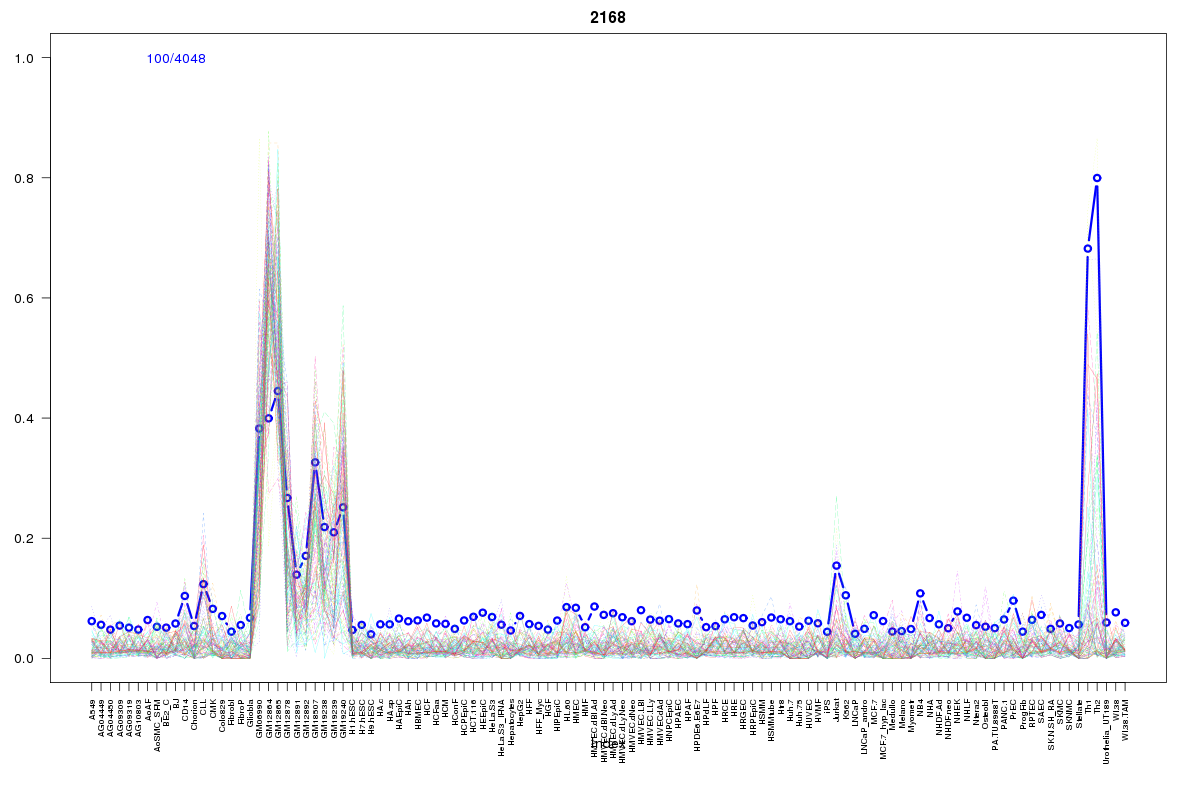 | 2168 | 1 |
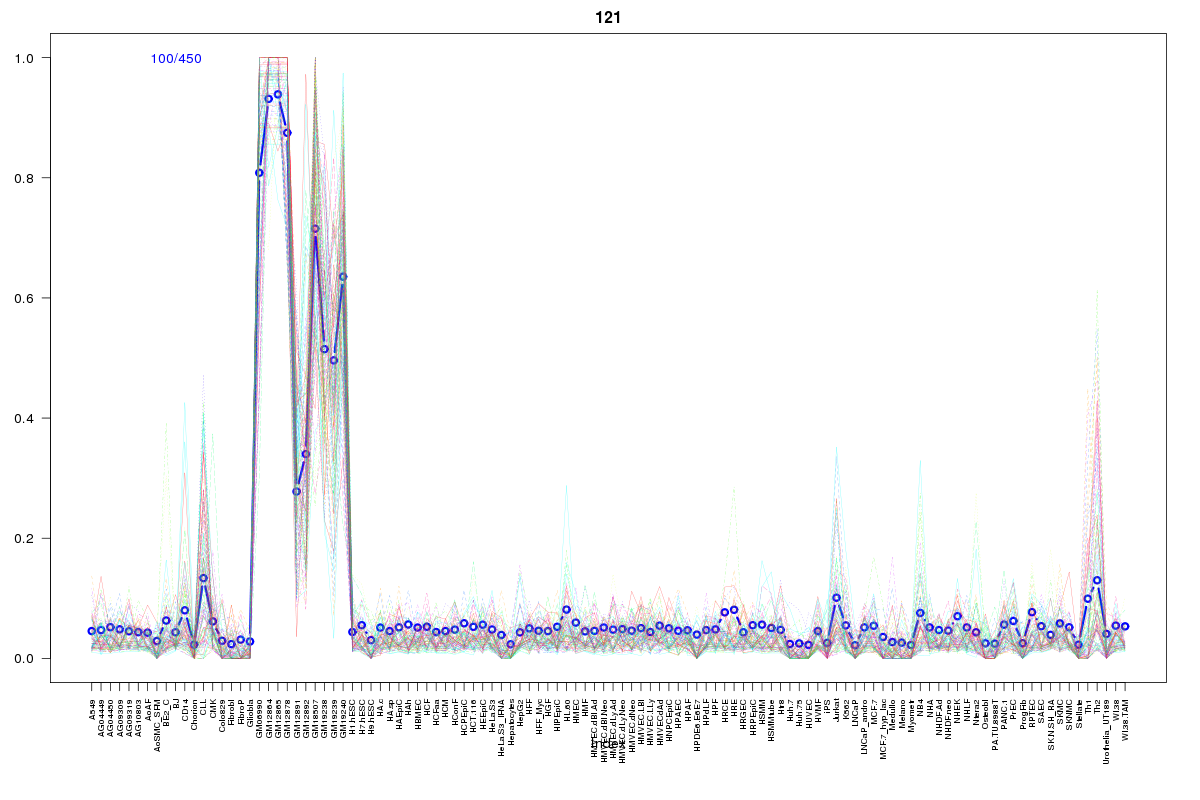 | 121 | 1 |
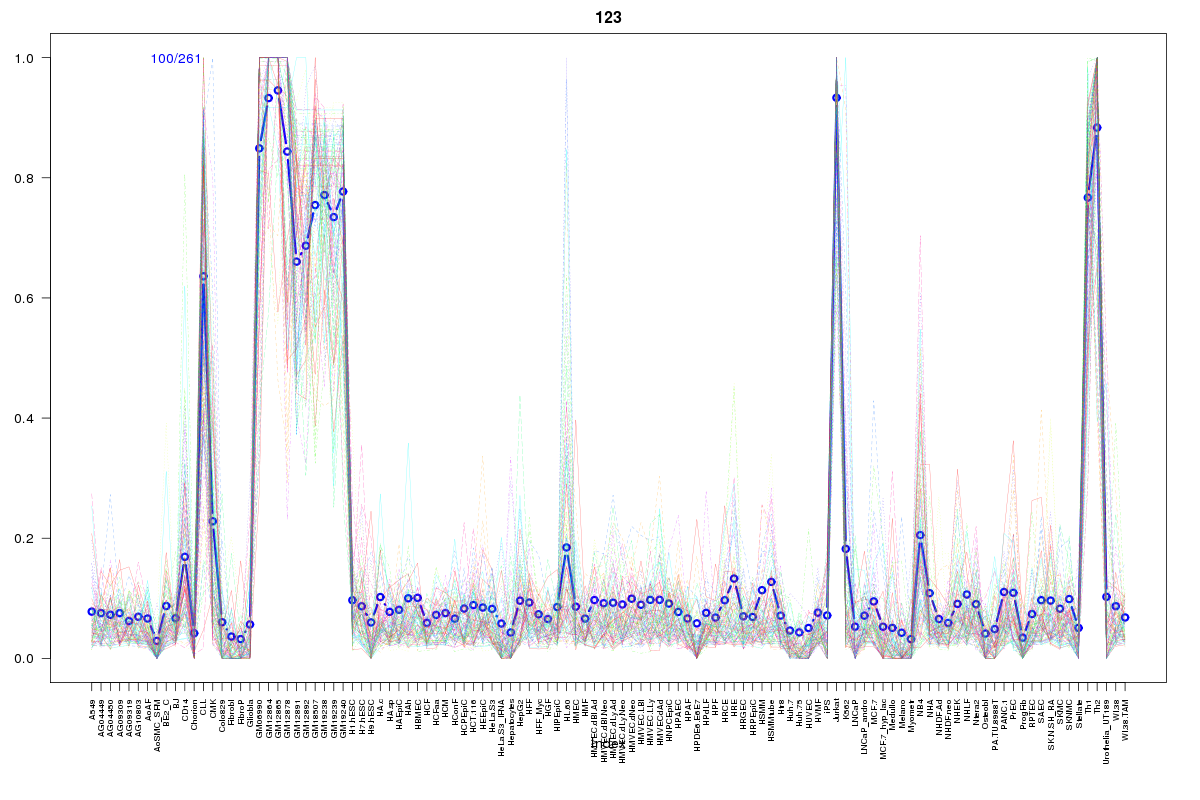 | 123 | 1 |
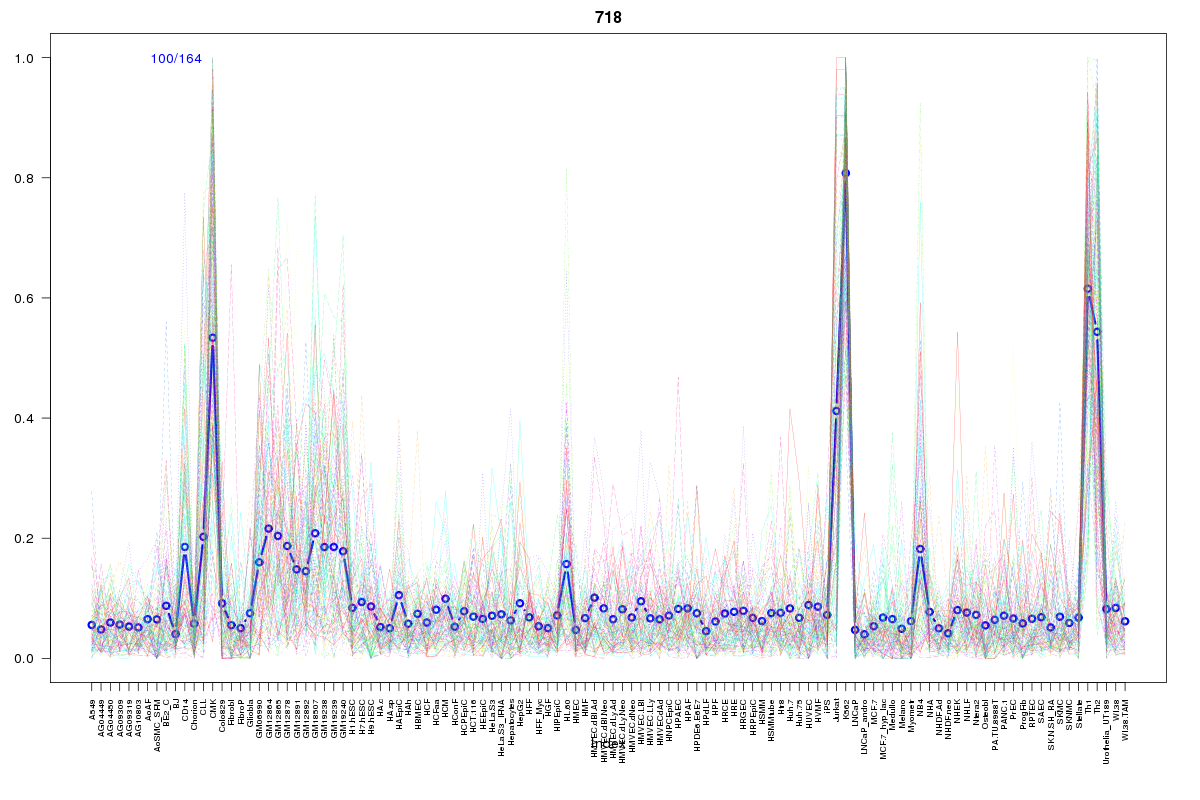 | 718 | 1 |
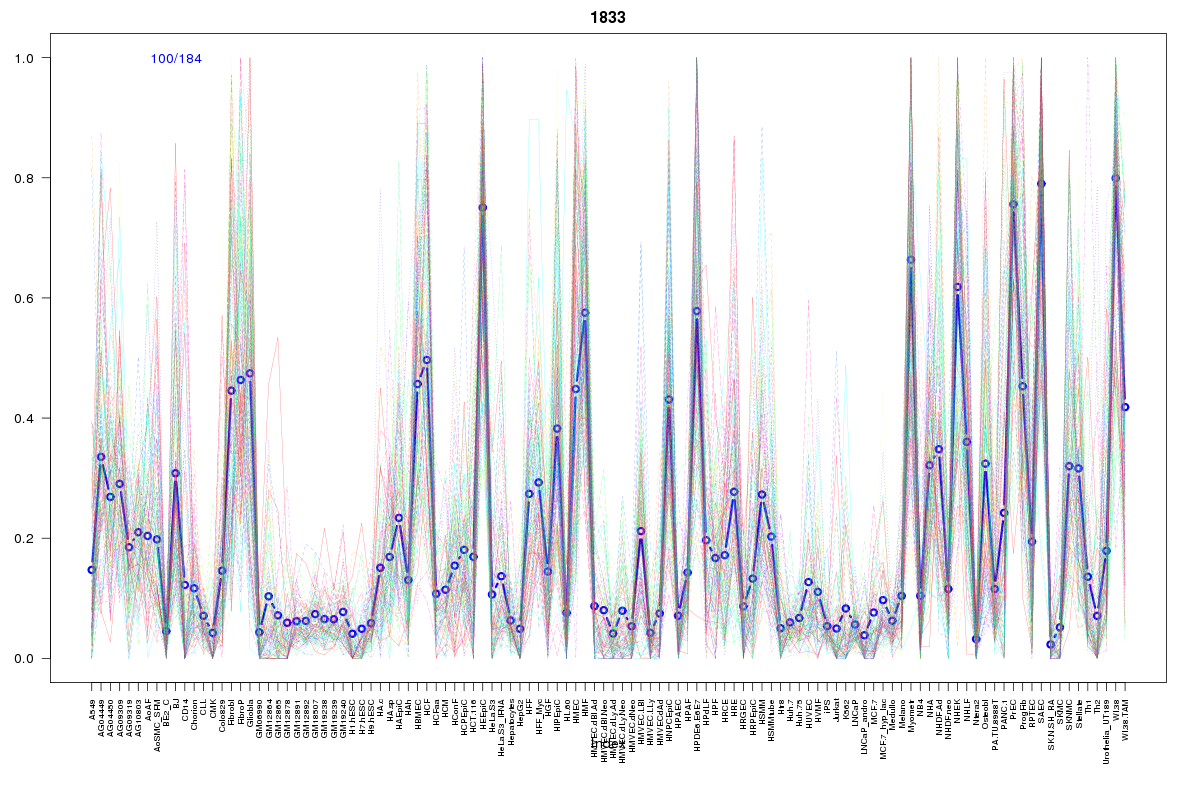 | 1833 | 1 |
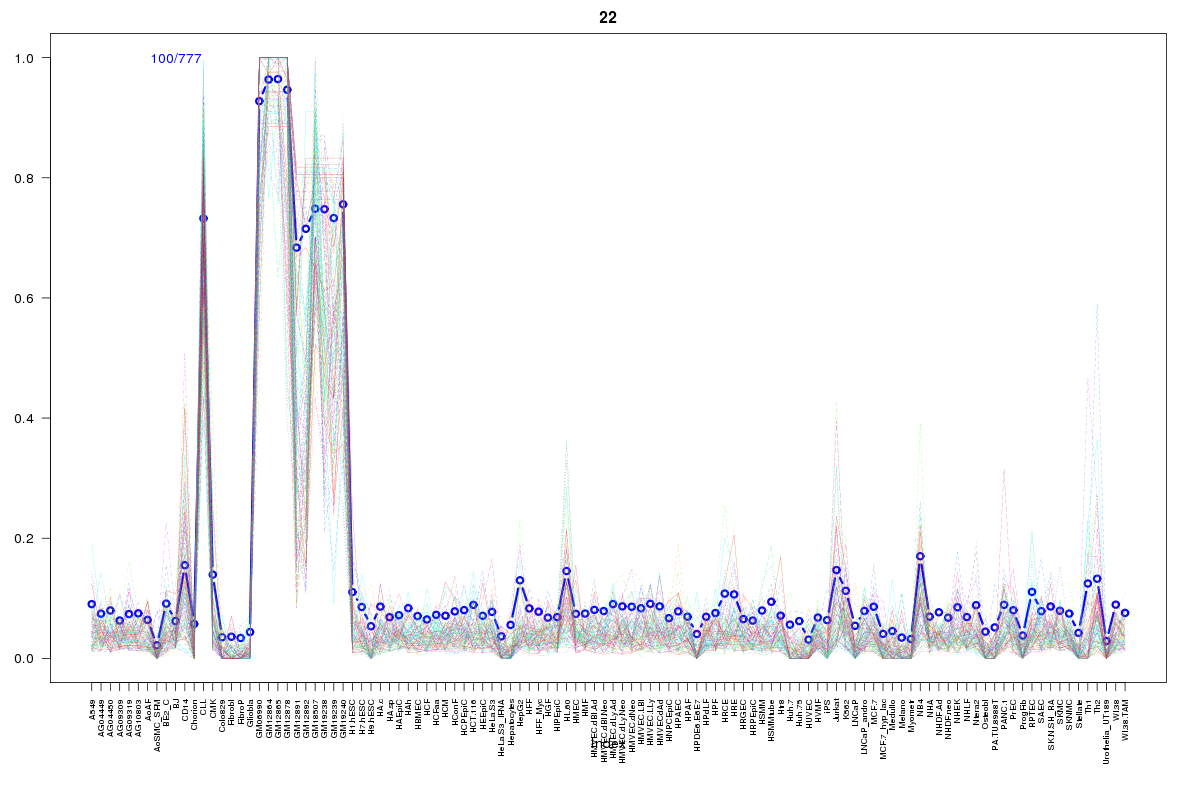 | 22 | 1 |
 | 527 | 1 |
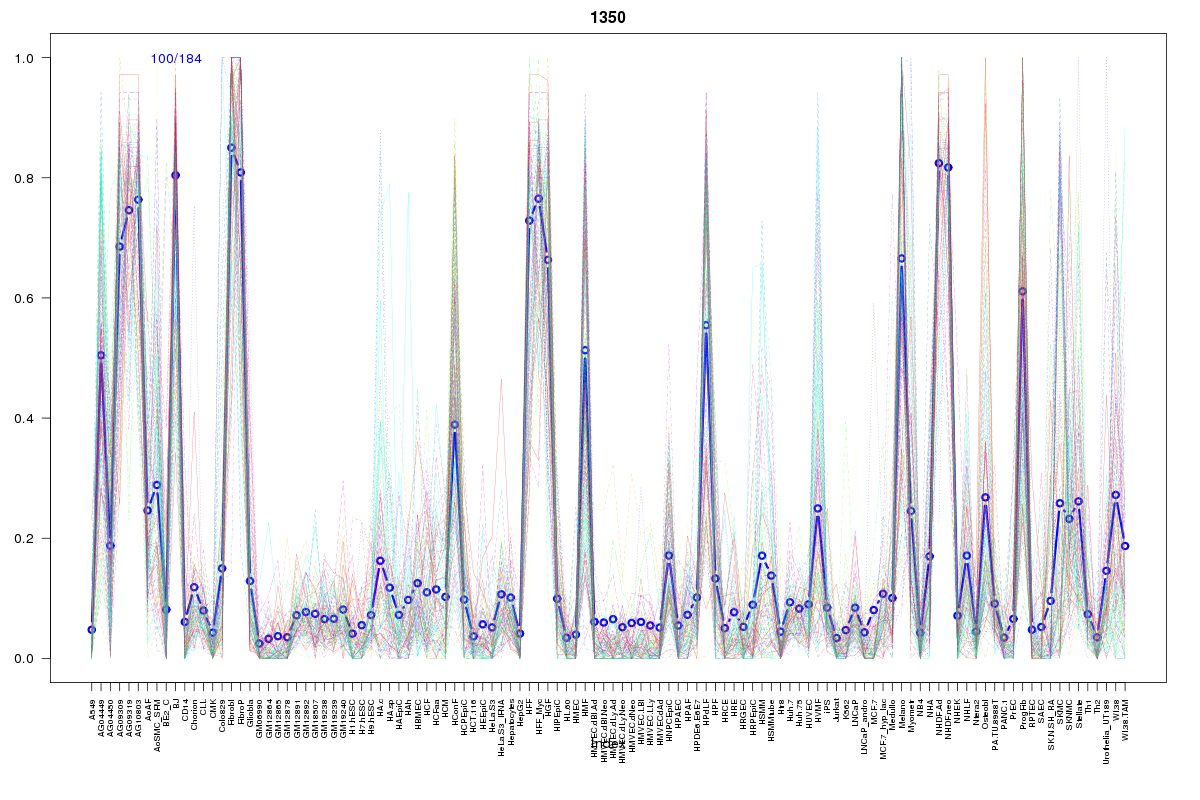 | 1350 | 1 |
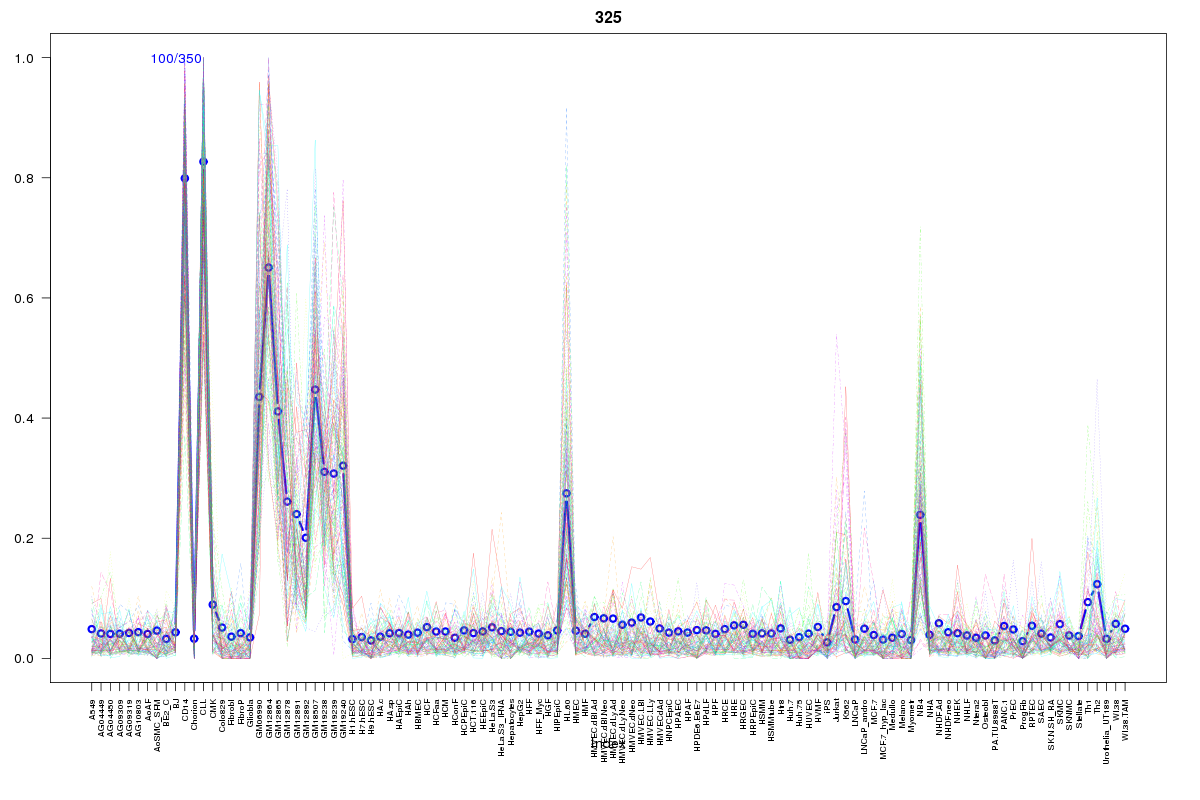 | 325 | 1 |
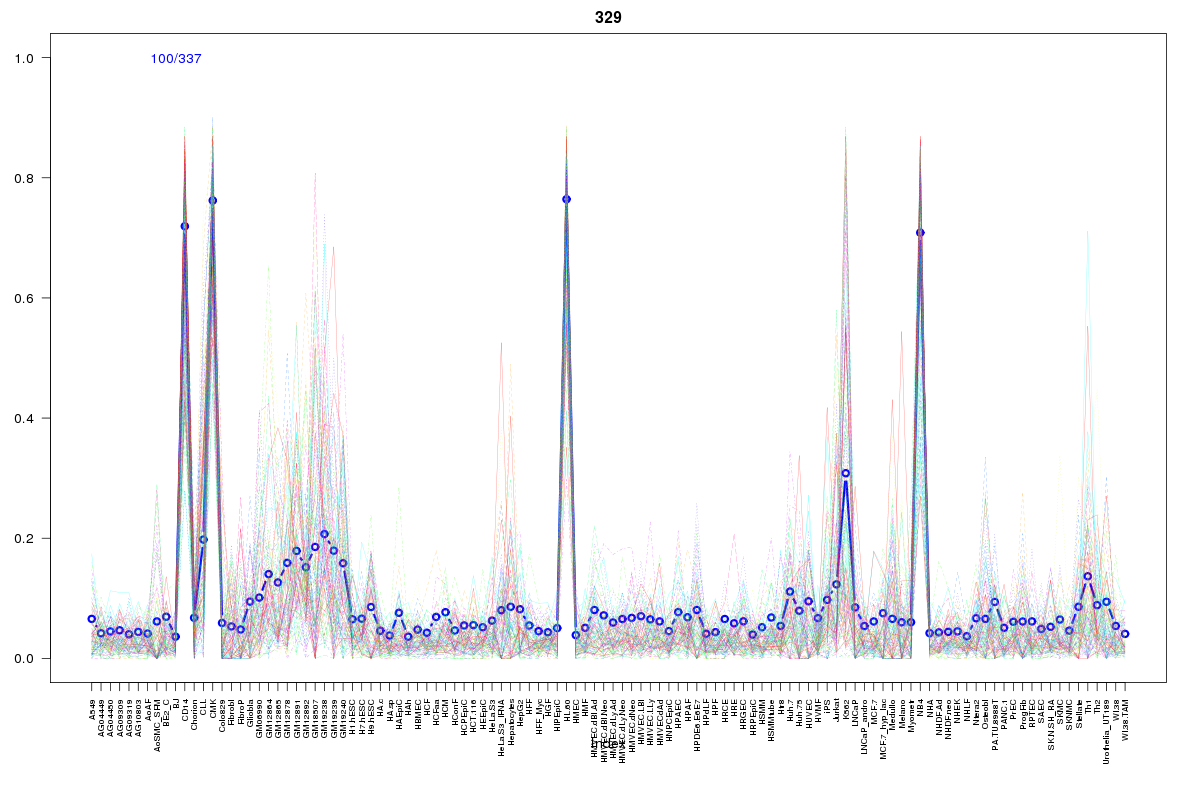 | 329 | 1 |
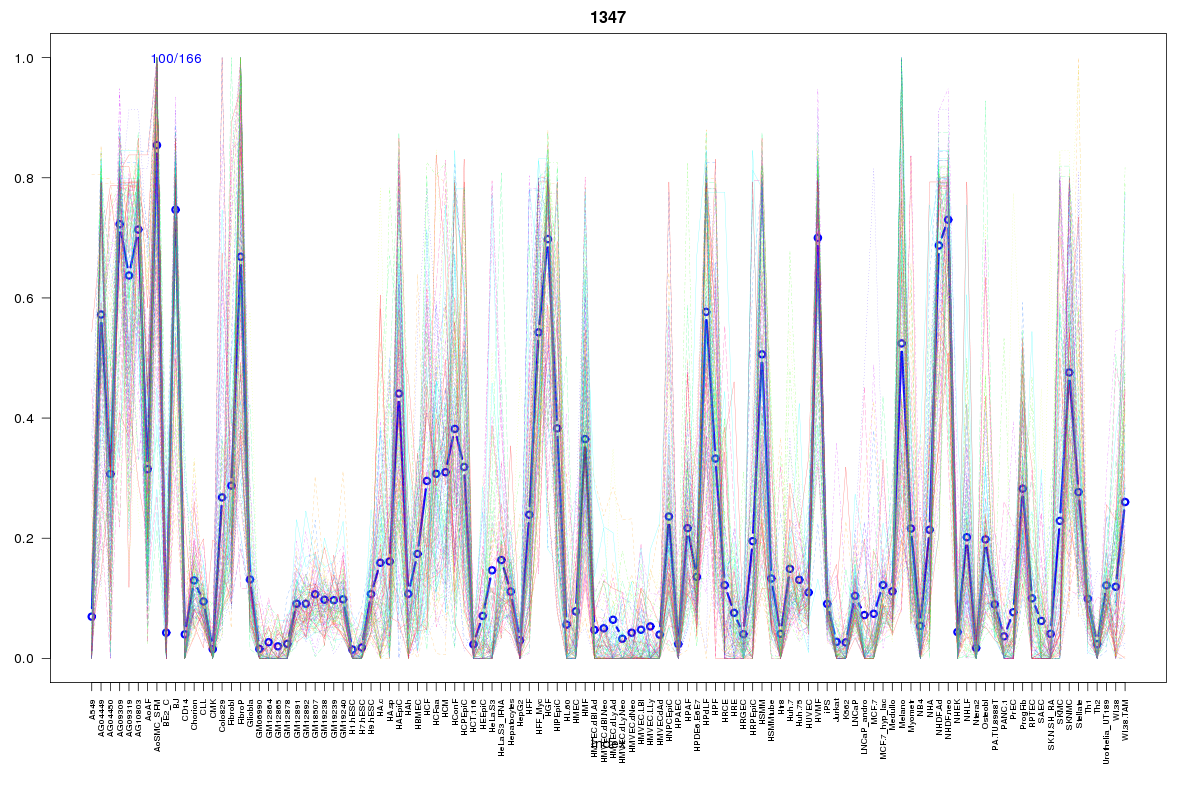 | 1347 | 1 |
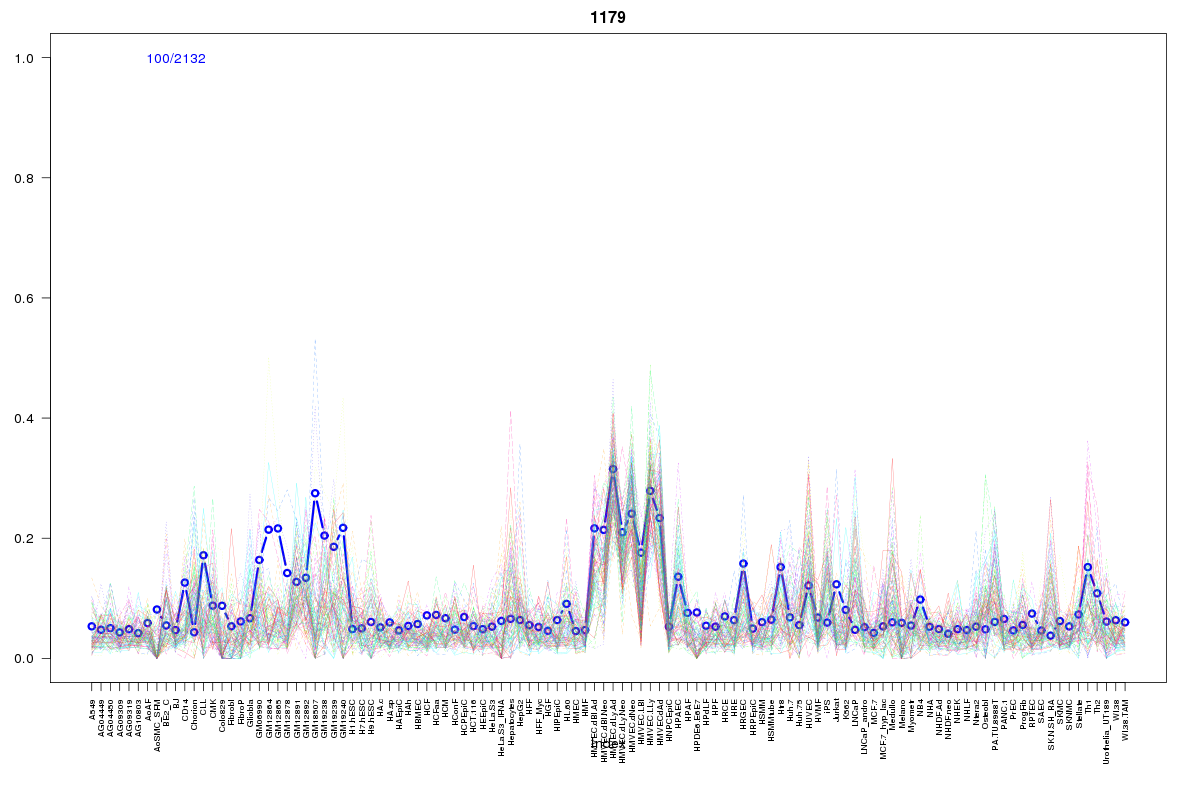 | 1179 | 1 |
 | 2266 | 1 |
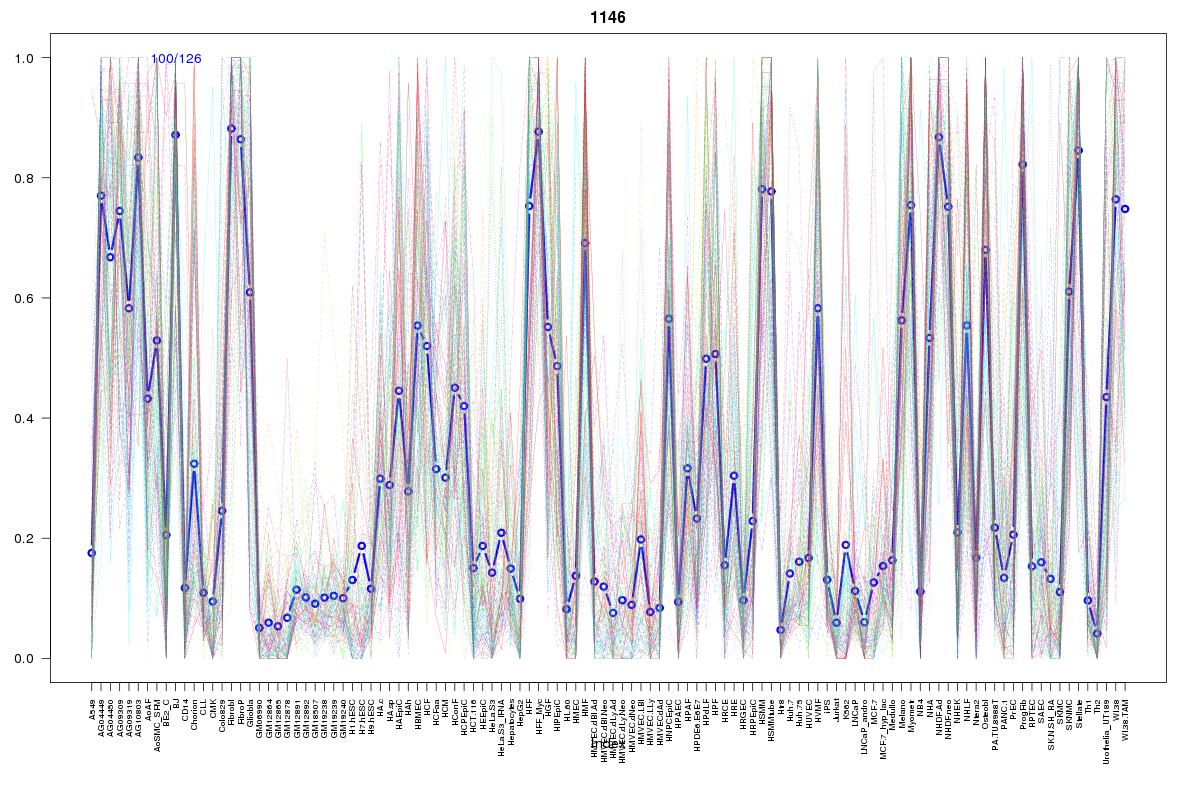 | 1146 | 1 |
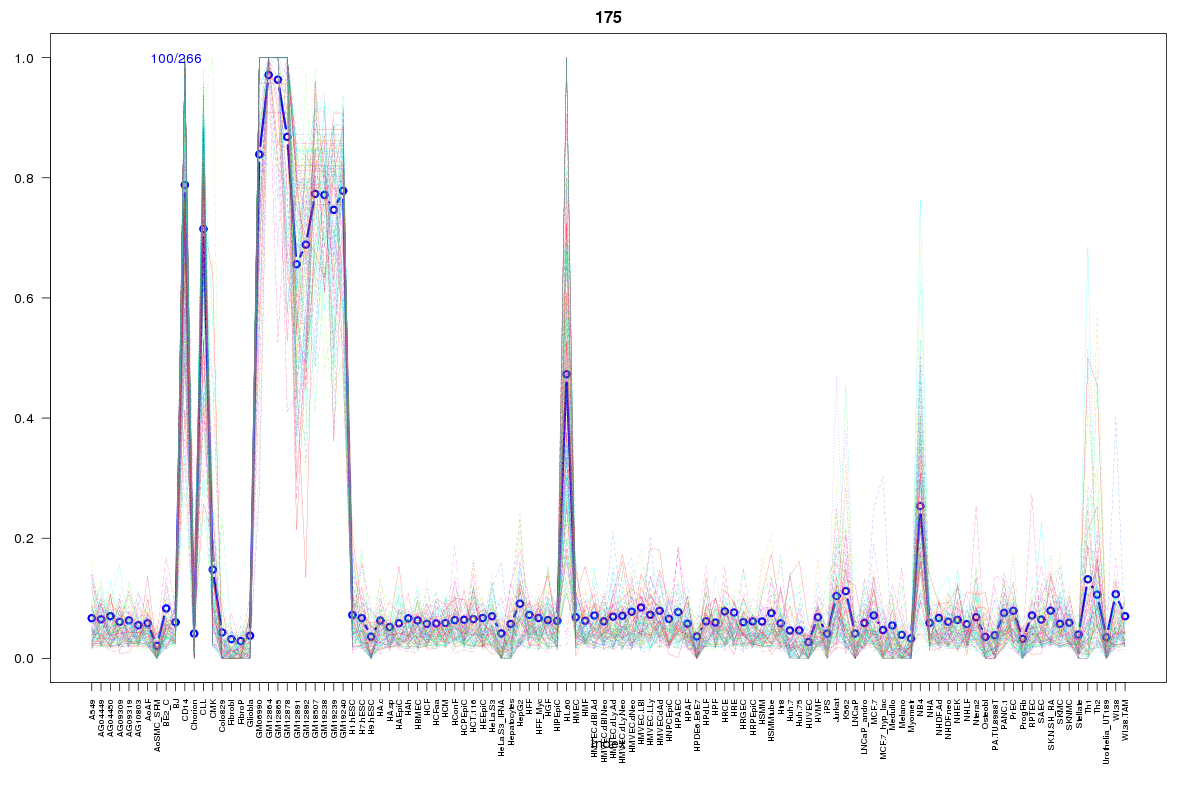 | 175 | 1 |
 | 1151 | 1 |
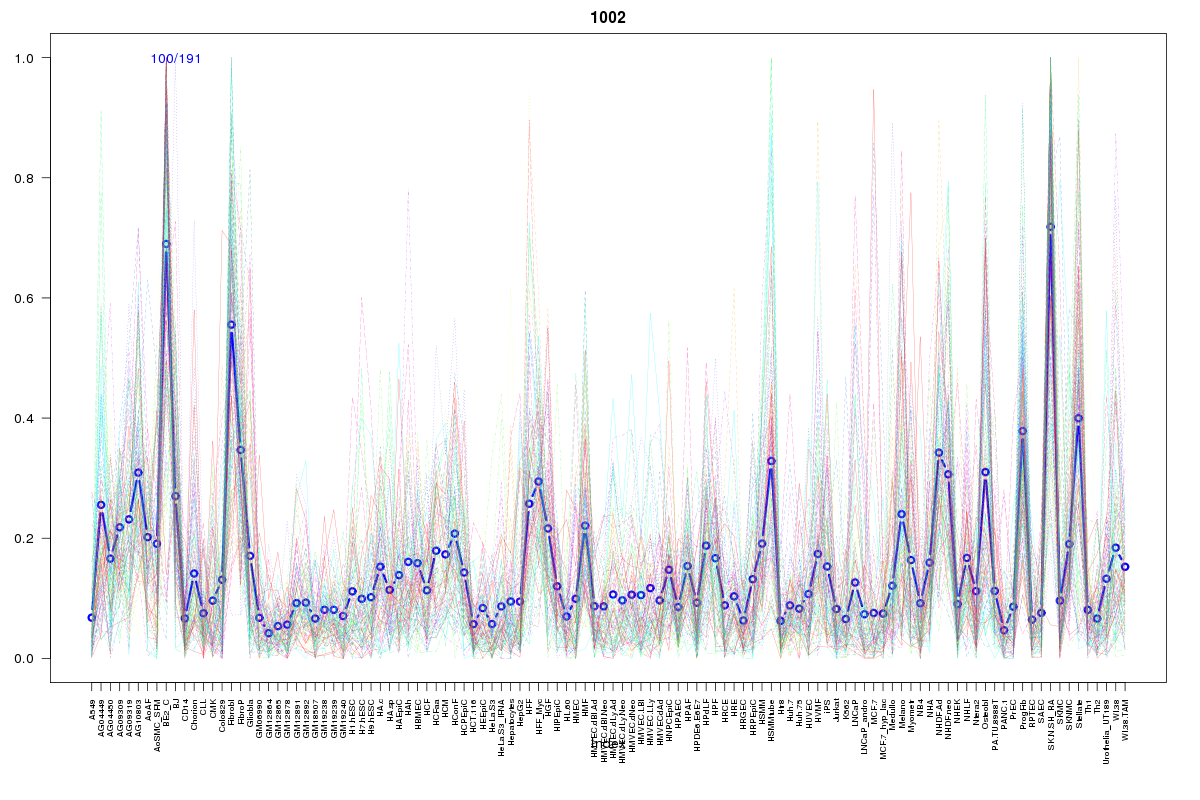 | 1002 | 1 |
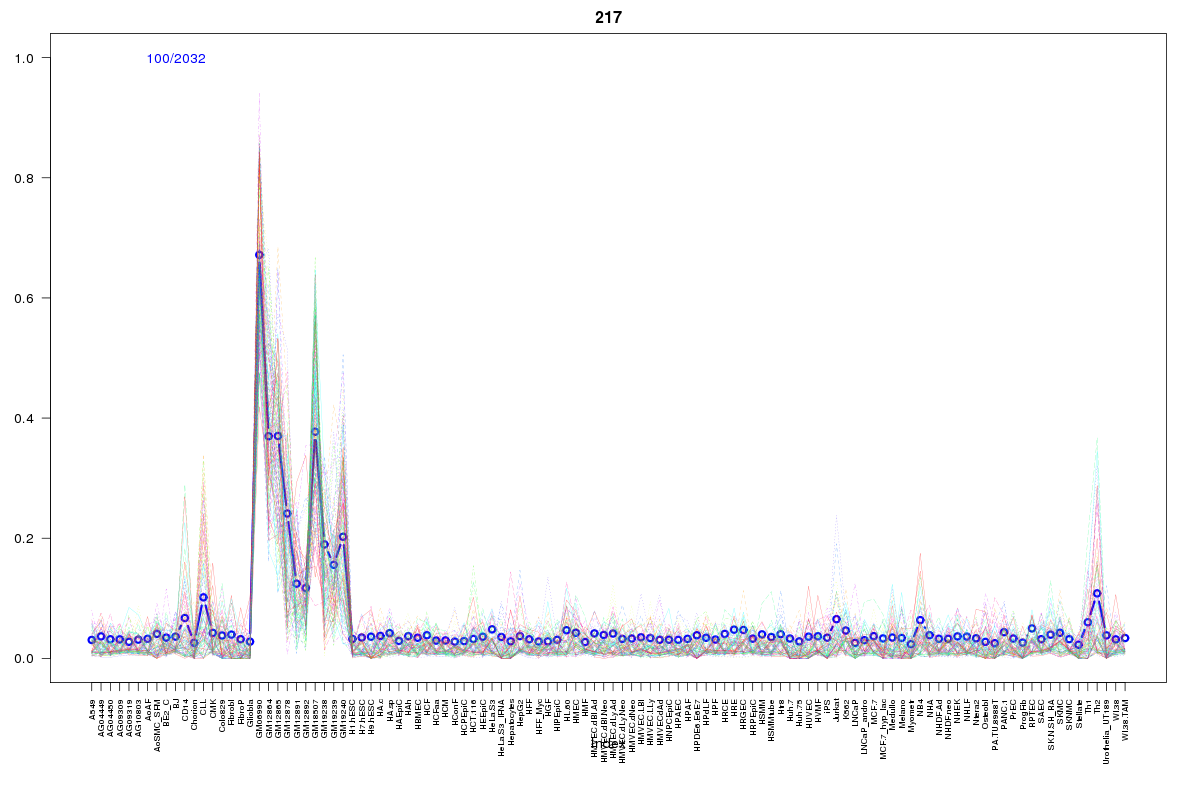 | 217 | 1 |
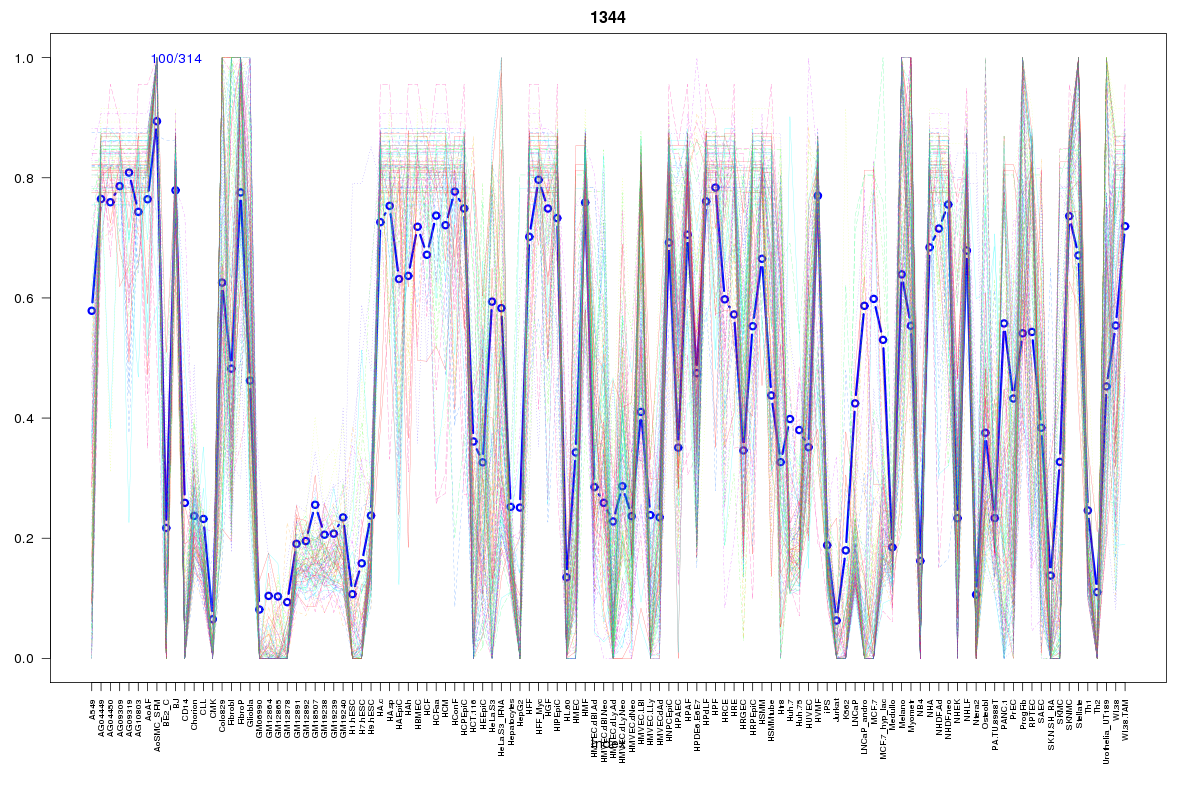 | 1344 | 1 |
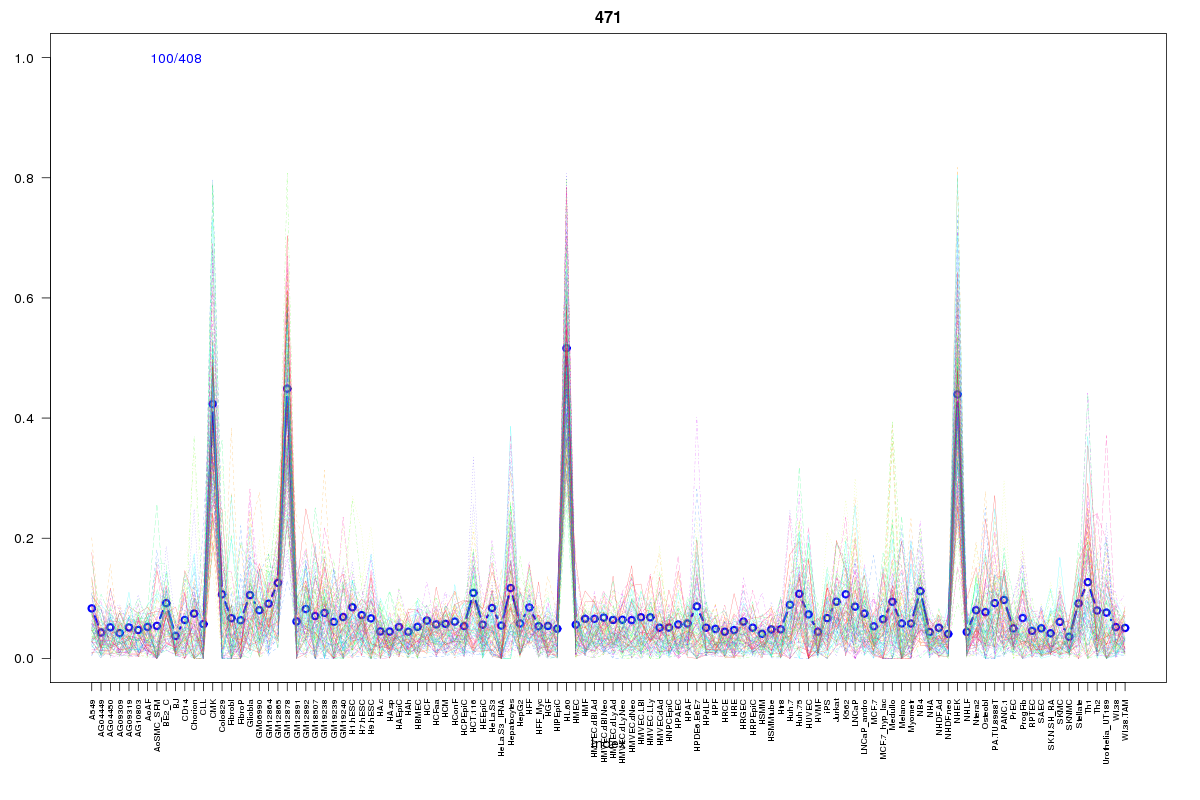 | 471 | 1 |
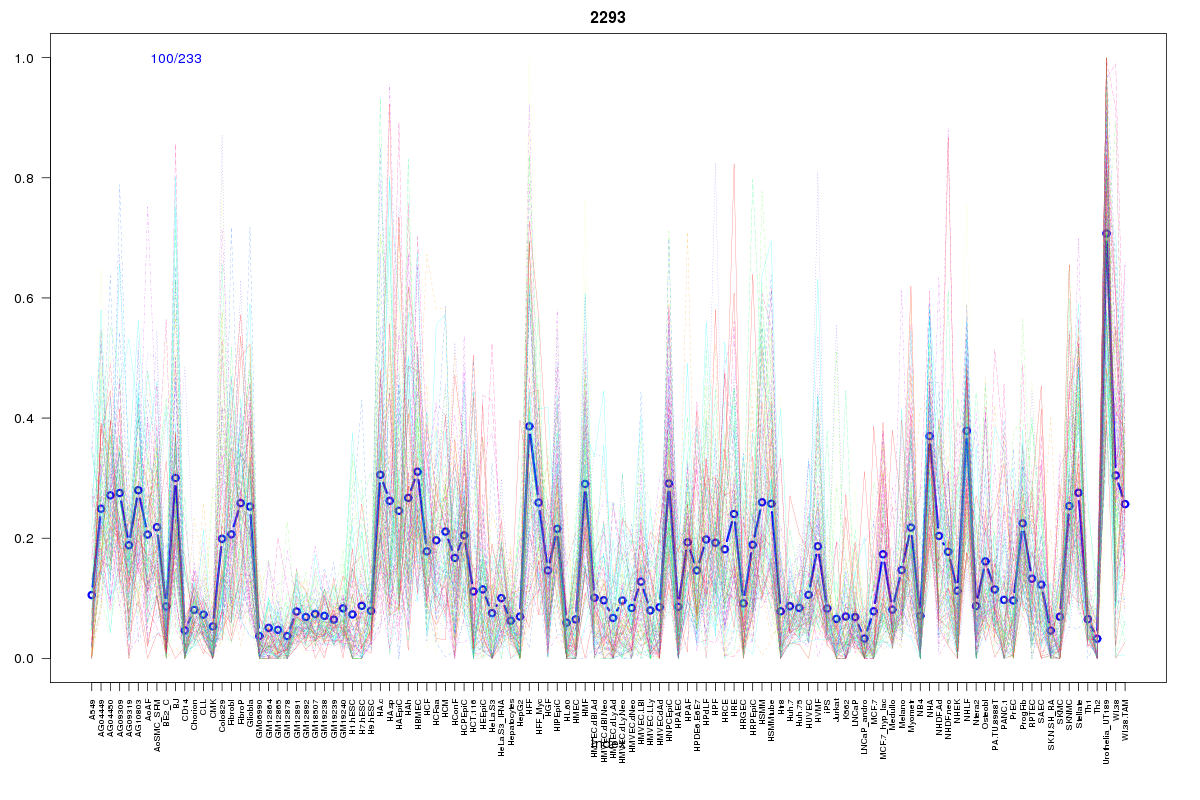 | 2293 | 1 |
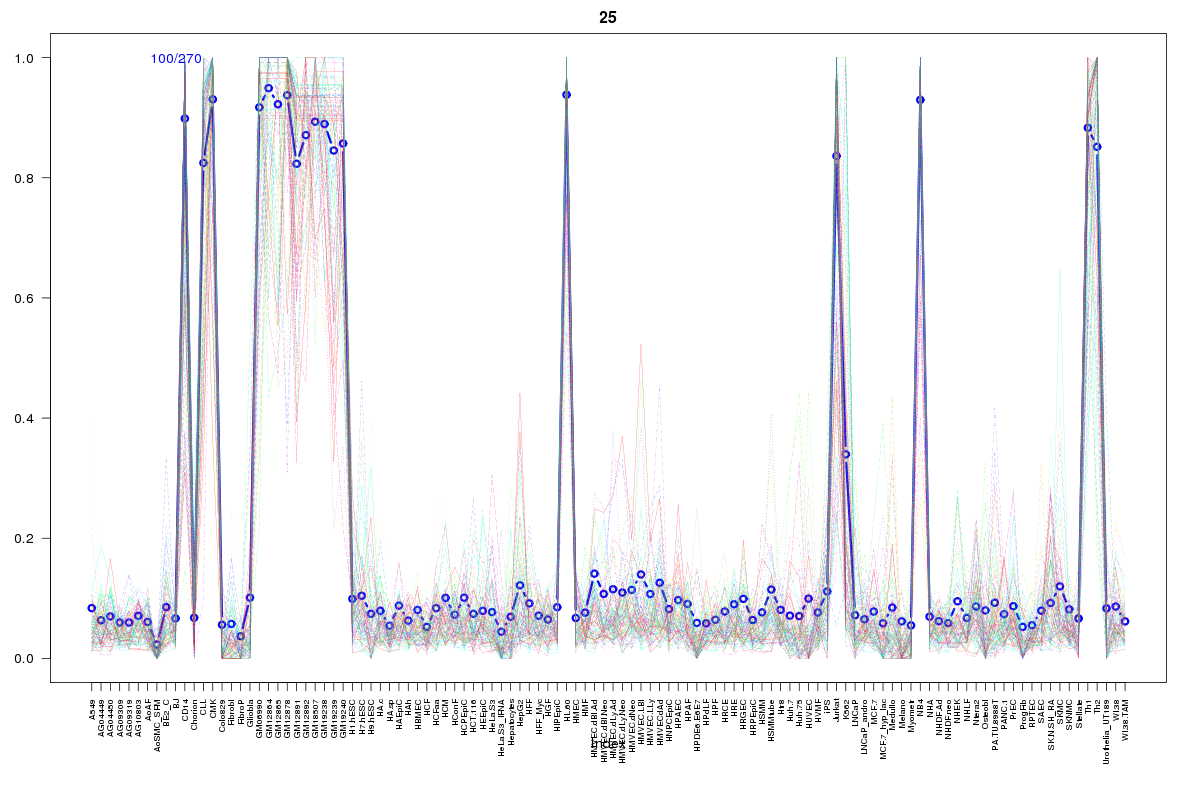 | 25 | 1 |
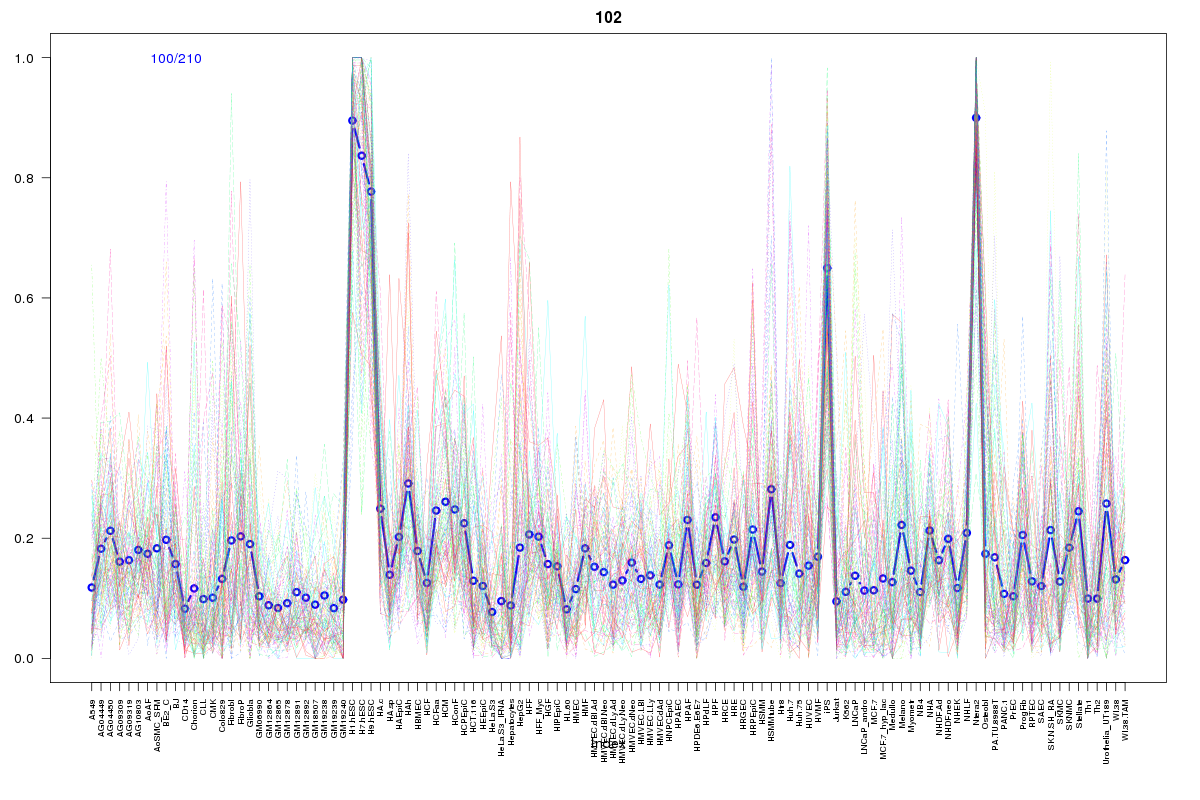 | 102 | 1 |
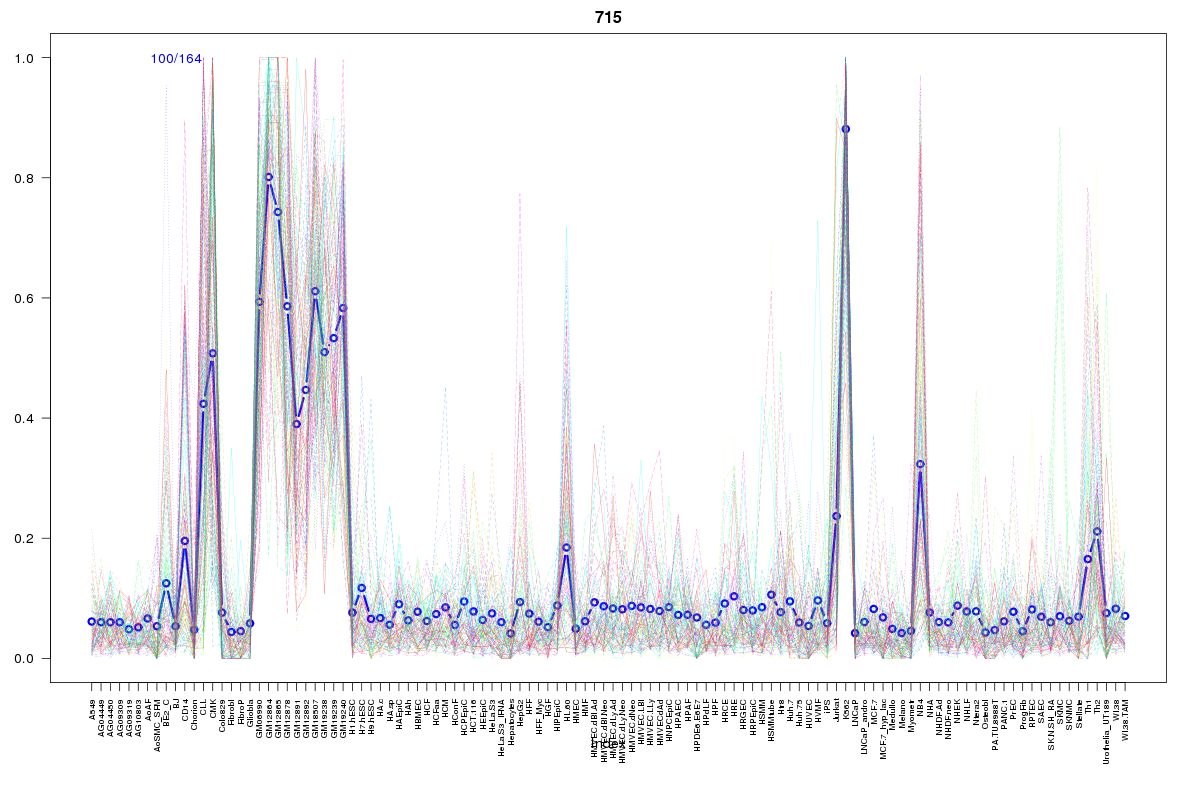 | 715 | 1 |
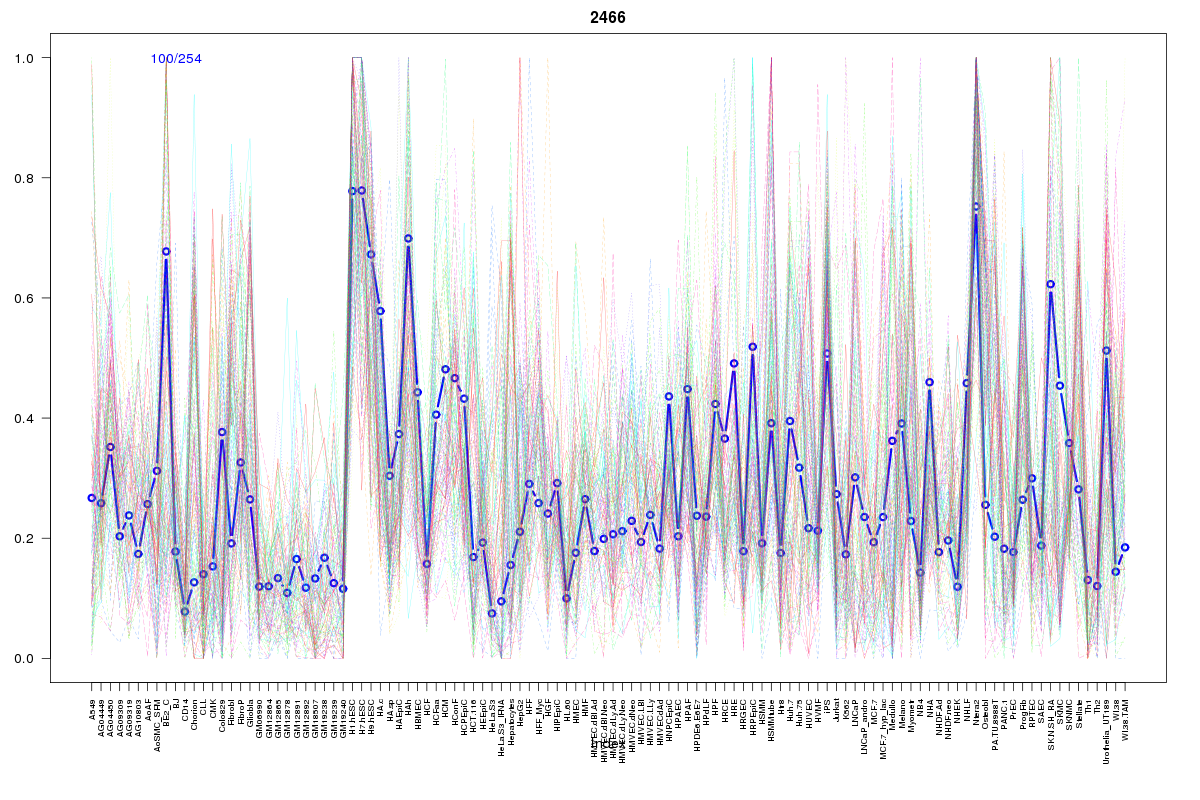 | 2466 | 1 |
 | 324 | 1 |
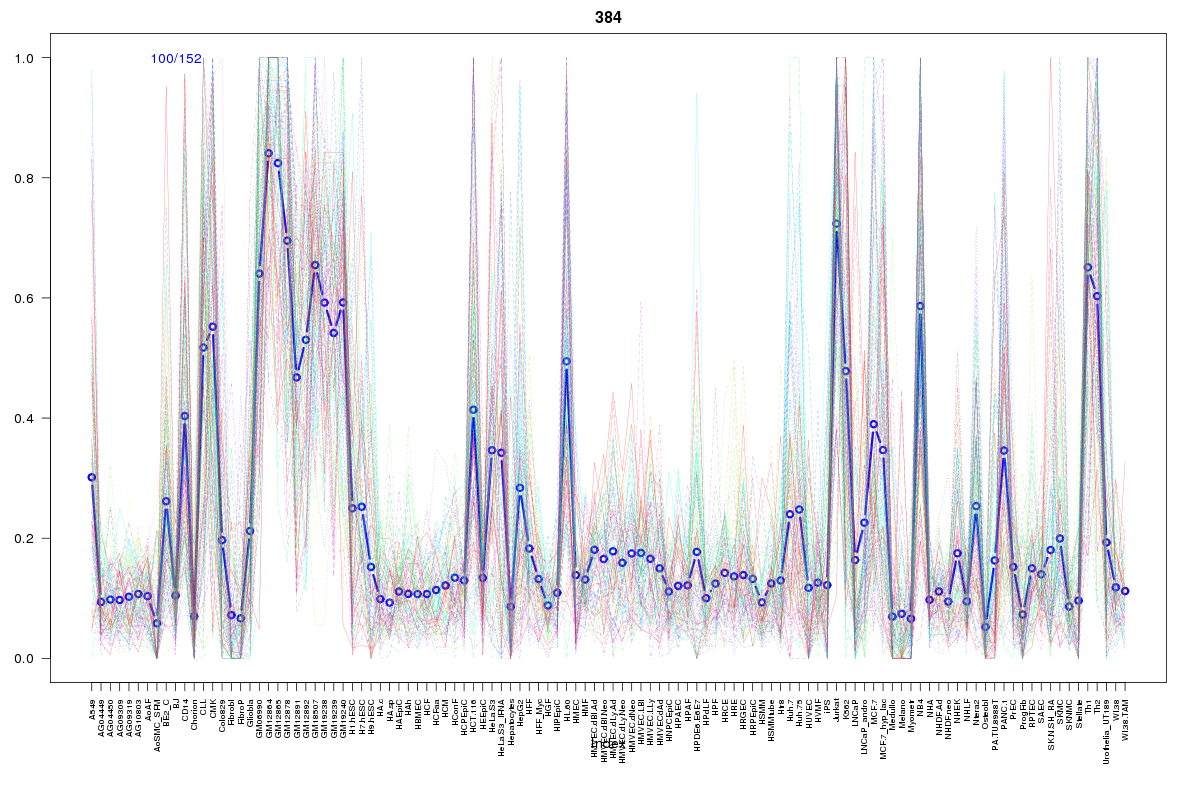 | 384 | 1 |
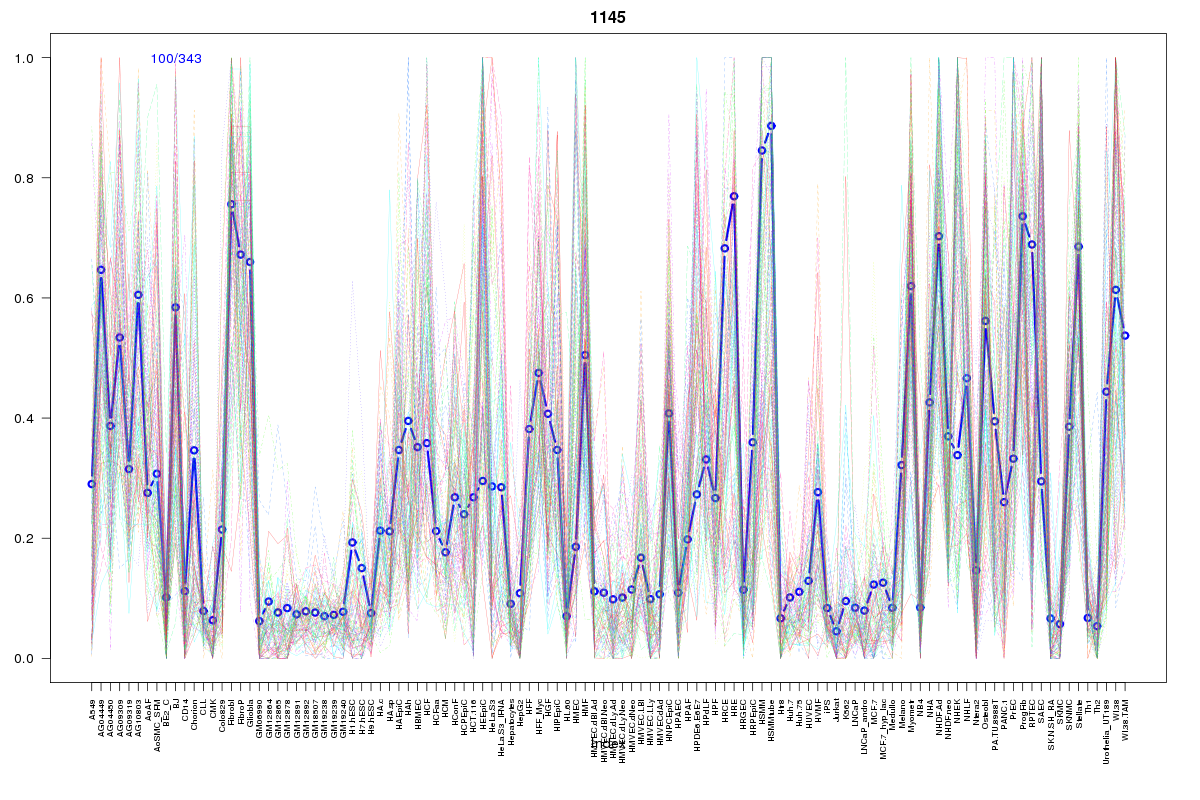 | 1145 | 1 |
 | 569 | 1 |
 | 2063 | 1 |
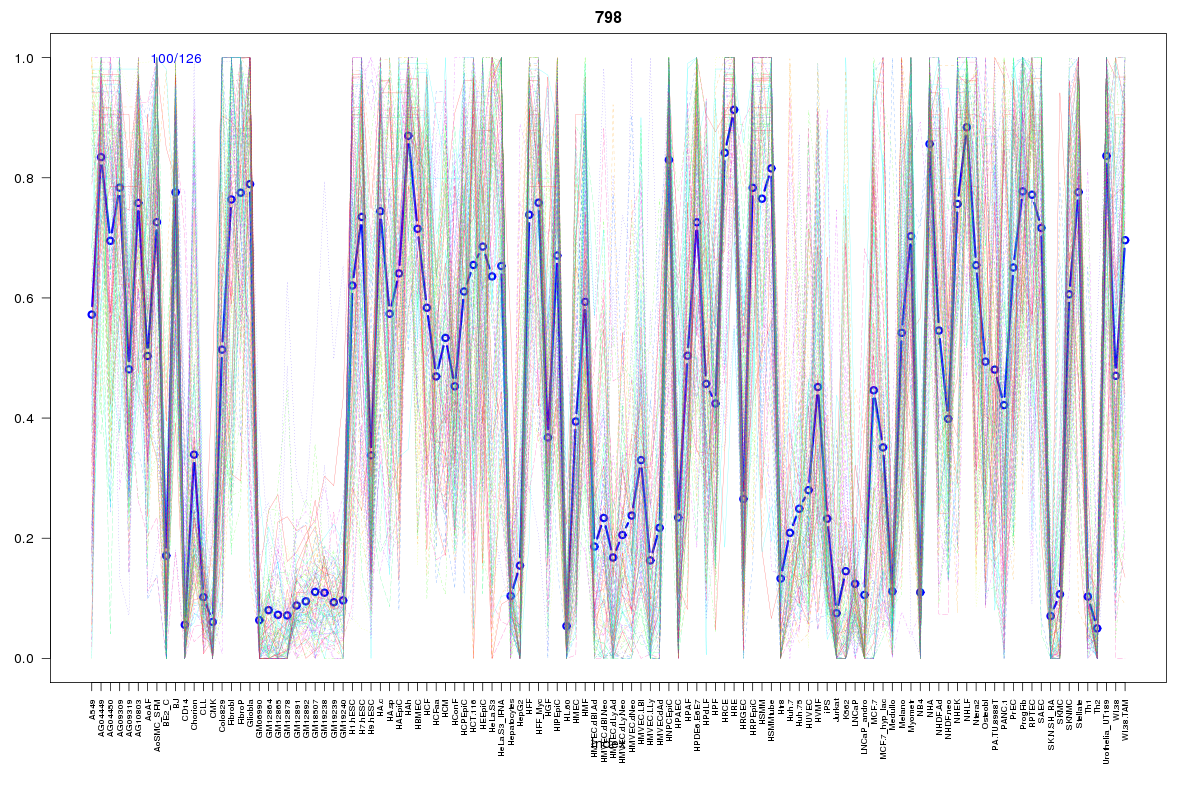 | 798 | 1 |
 | 77 | 1 |
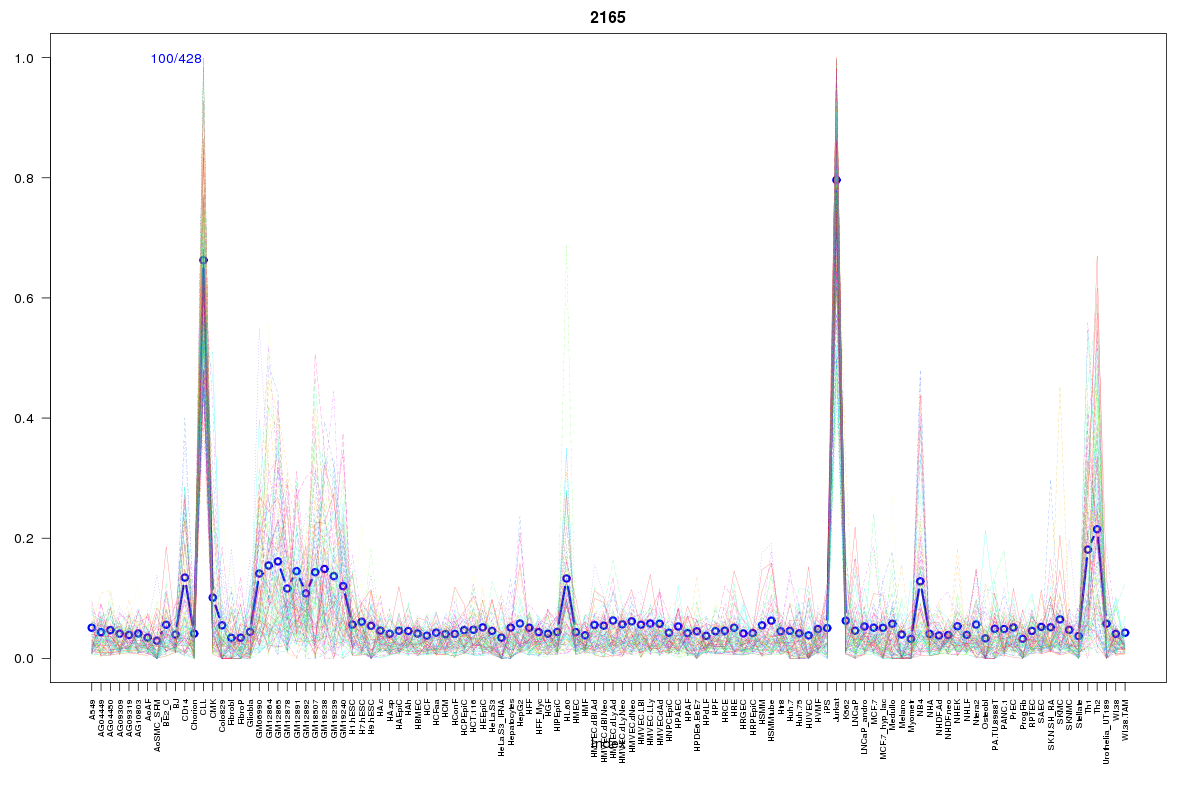 | 2165 | 1 |
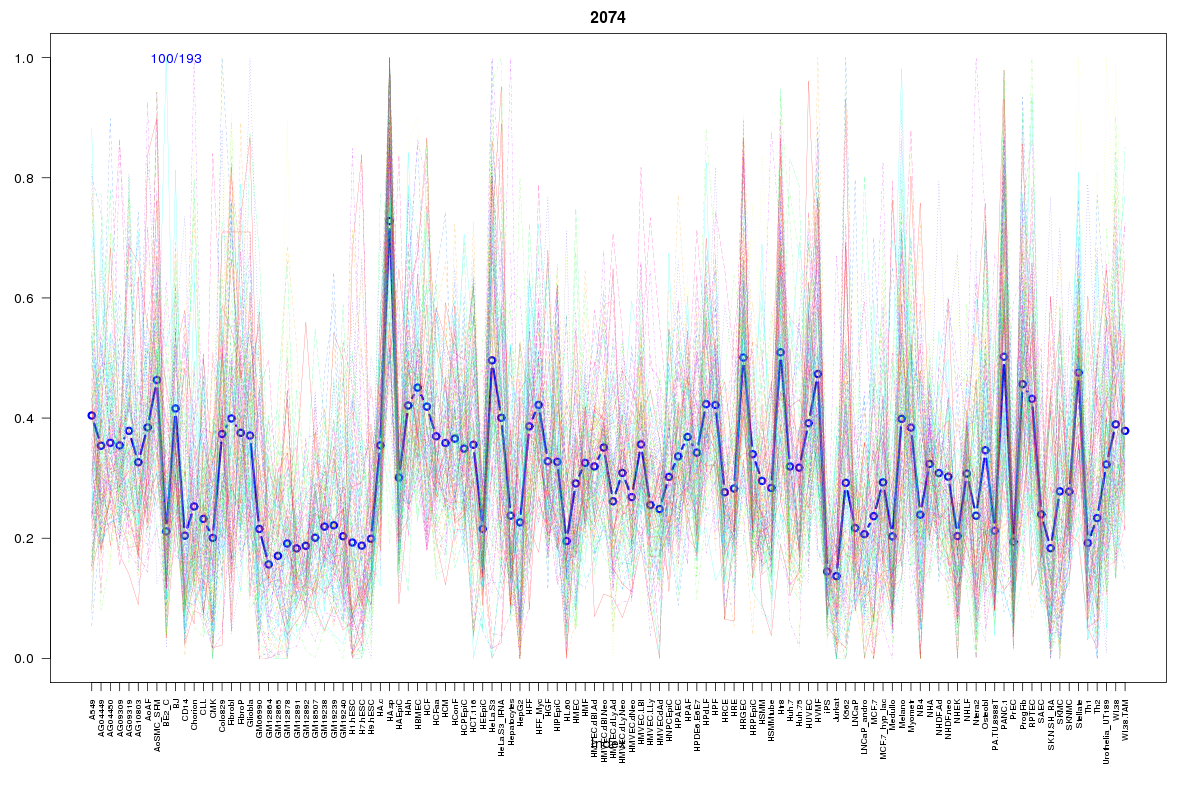 | 2074 | 1 |
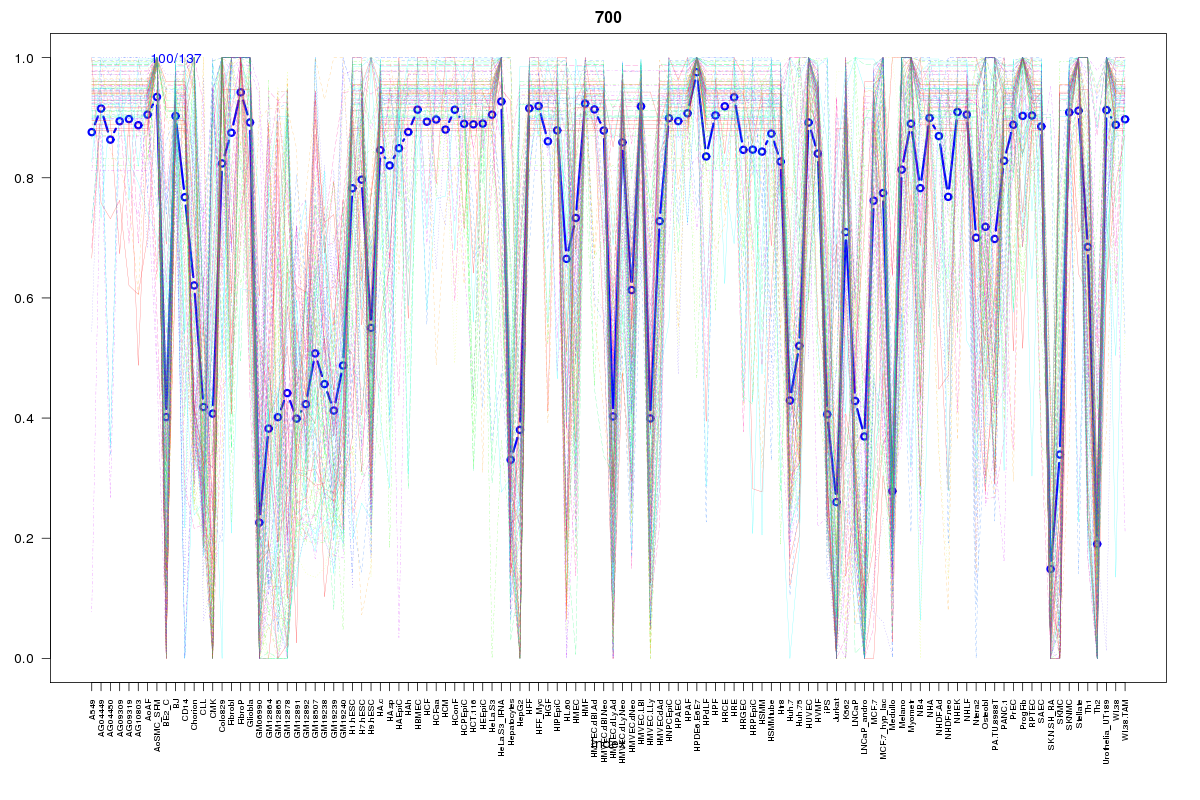 | 700 | 1 |
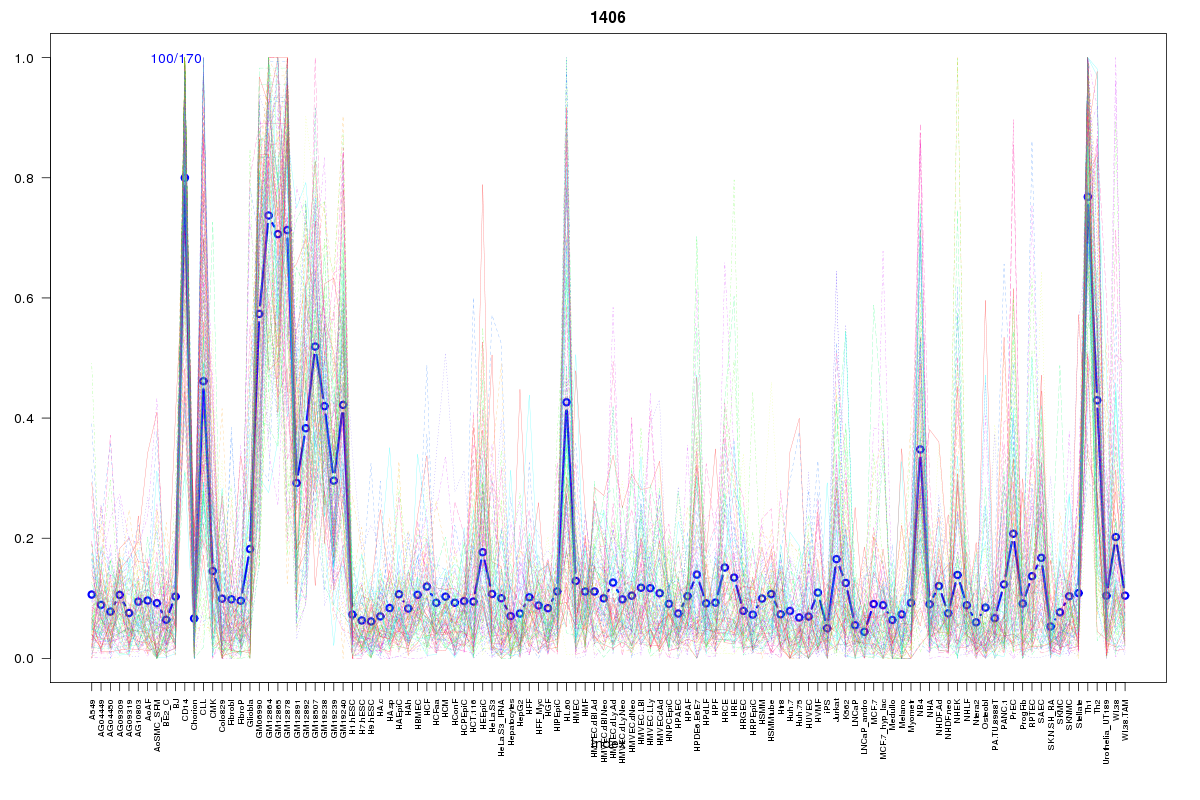 | 1406 | 1 |
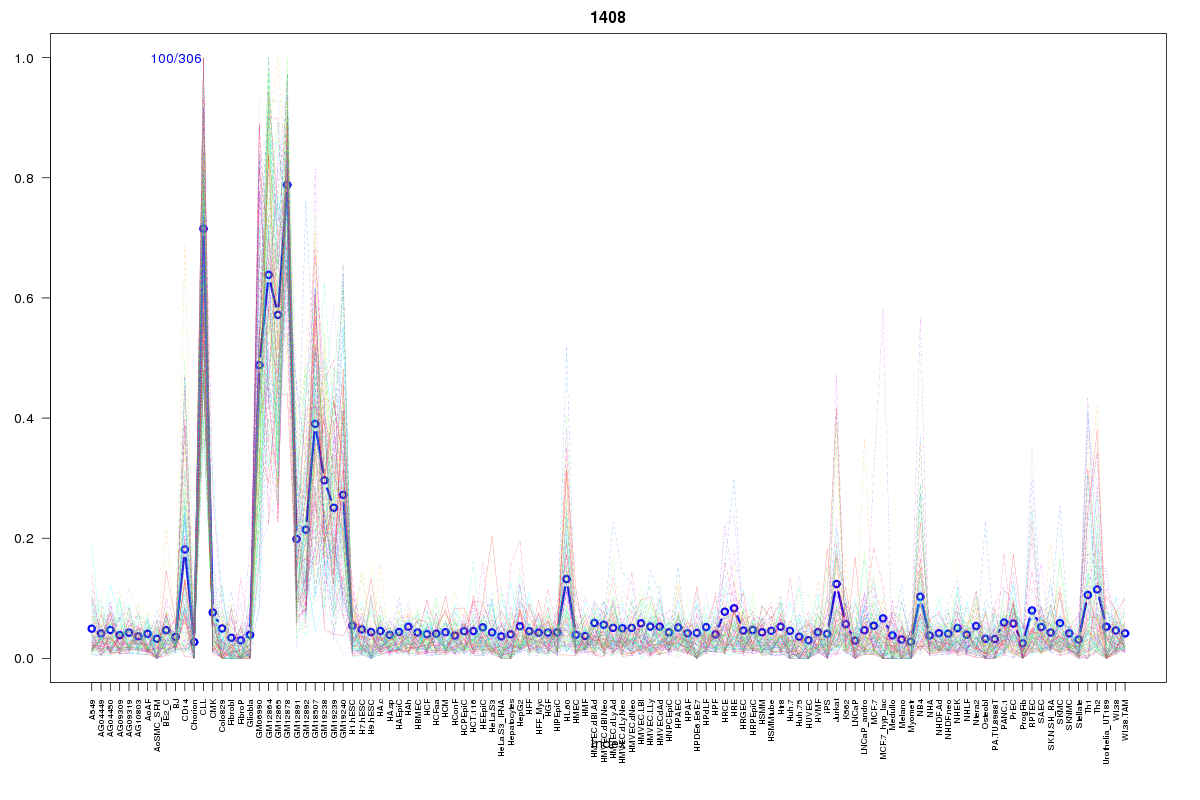 | 1408 | 1 |
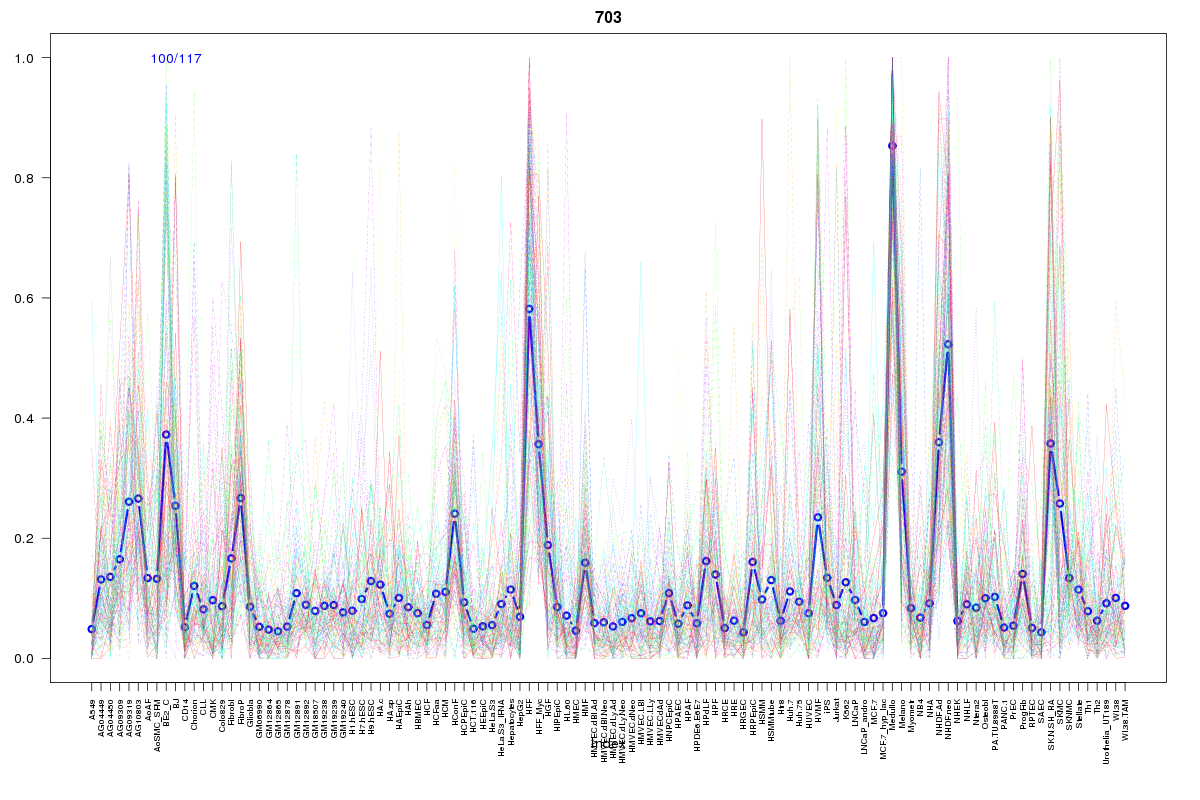 | 703 | 1 |
 | 18 | 1 |
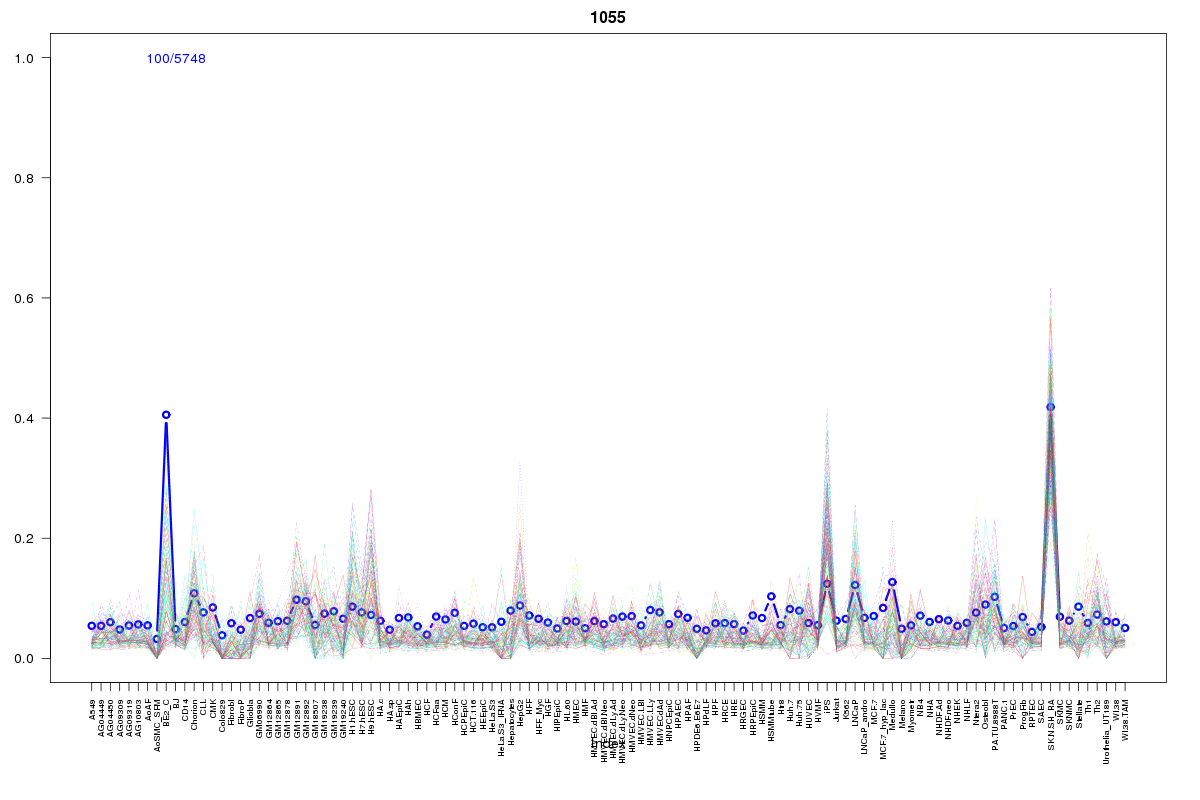 | 1055 | 1 |
Resources
BED file downloads
Connects to 61 DHS sitesTop 10 Correlated DHS Sites
p-values indiciate significant higher or lower correlation| Location | Cluster | P-value |
|---|---|---|
| chr1:31230620-31230770 | 25 | 0 |
| chr1:31216600-31216750 | 77 | 0 |
| chr1:31222760-31222910 | 123 | 0.001 |
| chr1:31227600-31227750 | 175 | 0.002 |
| chr1:31223780-31223930 | 22 | 0.005 |
| chr1:31205185-31205335 | 324 | 0.005 |
| chr1:31232720-31232870 | 23 | 0.005 |
| chr1:31226600-31226750 | 325 | 0.005 |
| chr1:31226760-31226910 | 1179 | 0.005 |
| chr1:31203260-31203410 | 218 | 0.005 |
| chr1:31263740-31263890 | 1358 | 0.006 |
External Databases
UCSCEnsembl (ENSG00000162511)