Gene: SCNM1
chr1: 151129139-151141609Expression Profile
(log scale)
Graphical Connections
Distribution of linked clusters:
You may find it interesting if many of the connected DHS sites belong to the same cluster.| Cluster Profile | Cluster ID | Number of DHS sites in this cluster |
|---|---|---|
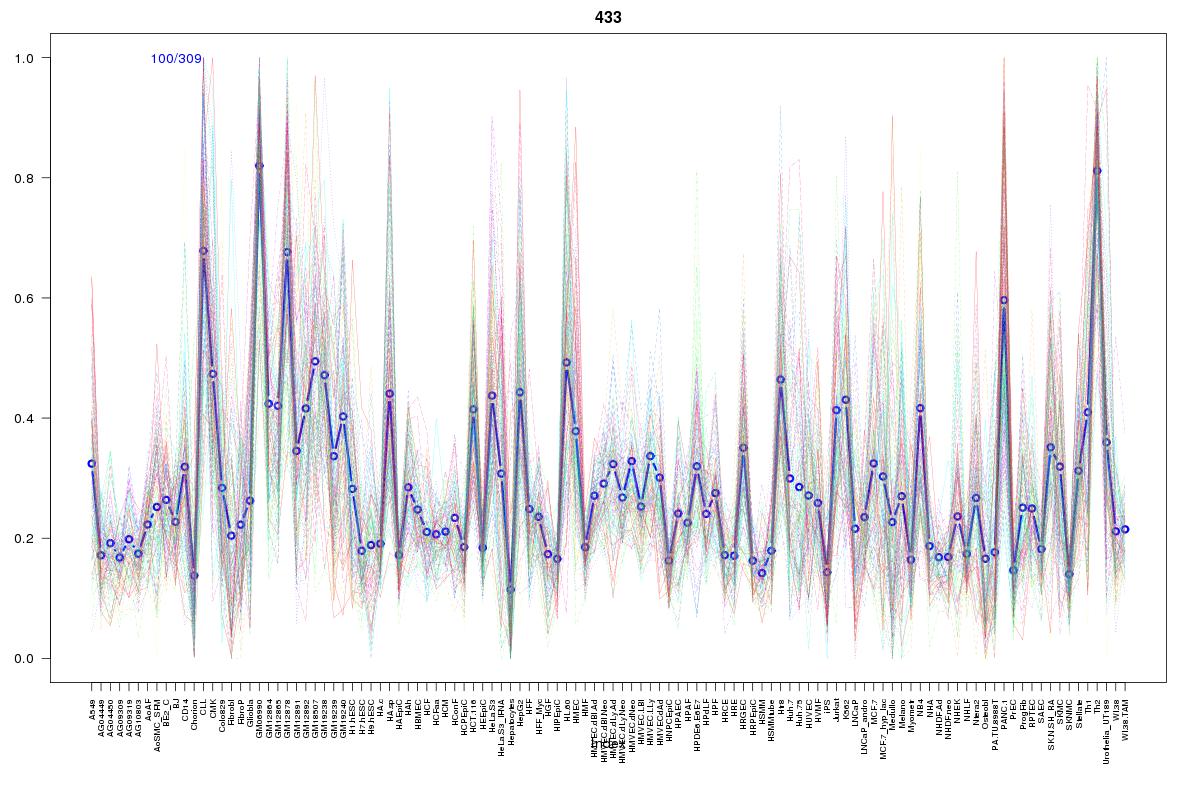 | 433 | 2 |
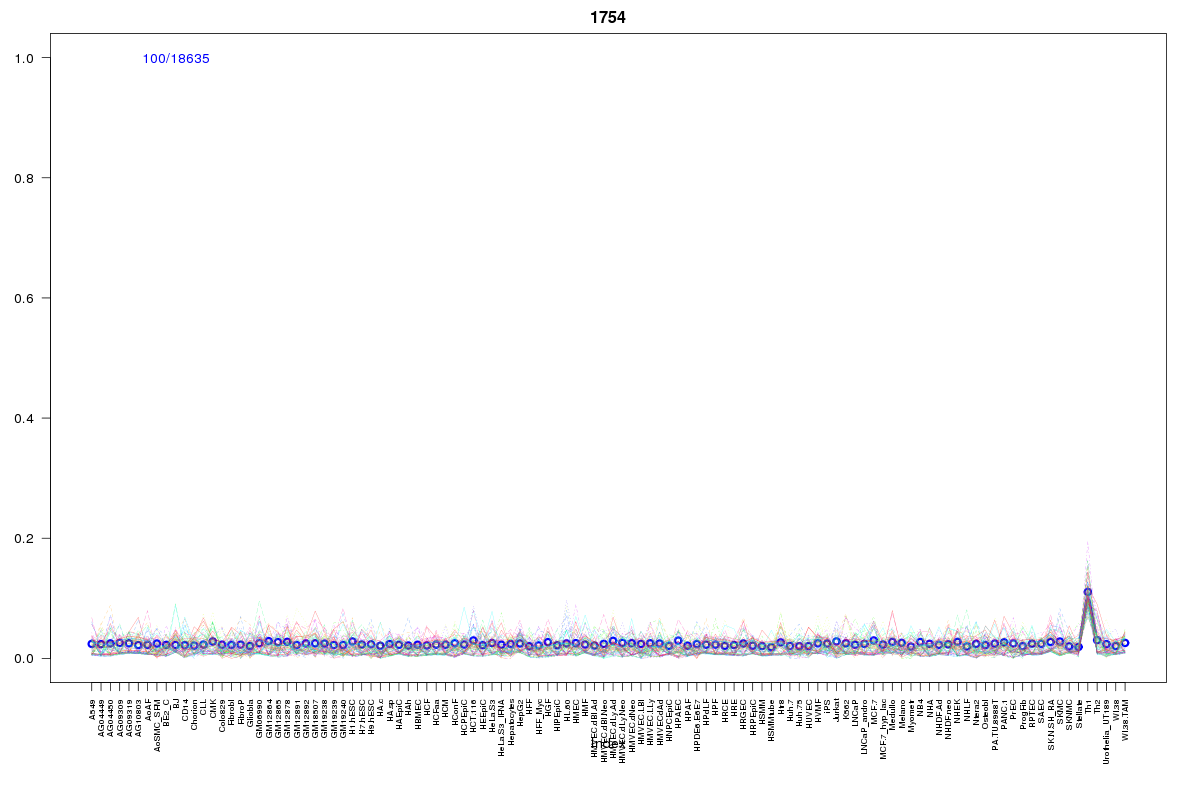 | 1754 | 2 |
 | 579 | 2 |
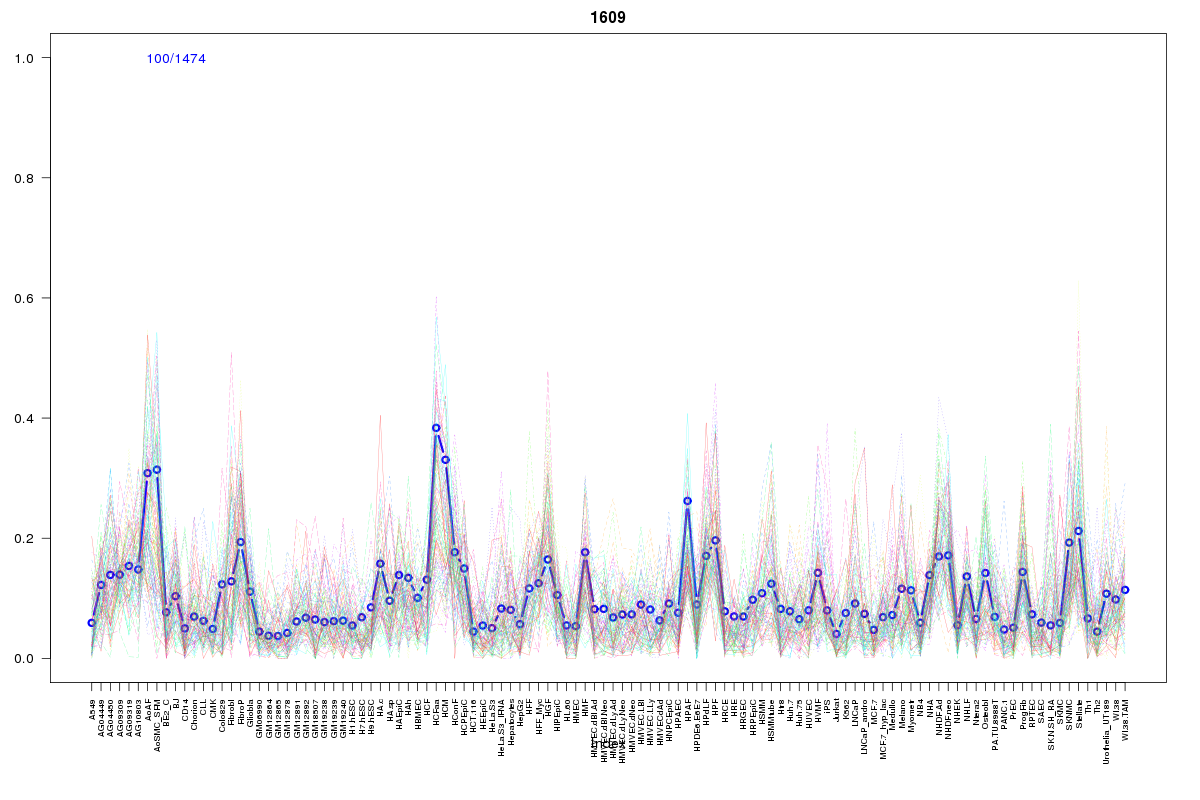 | 1609 | 1 |
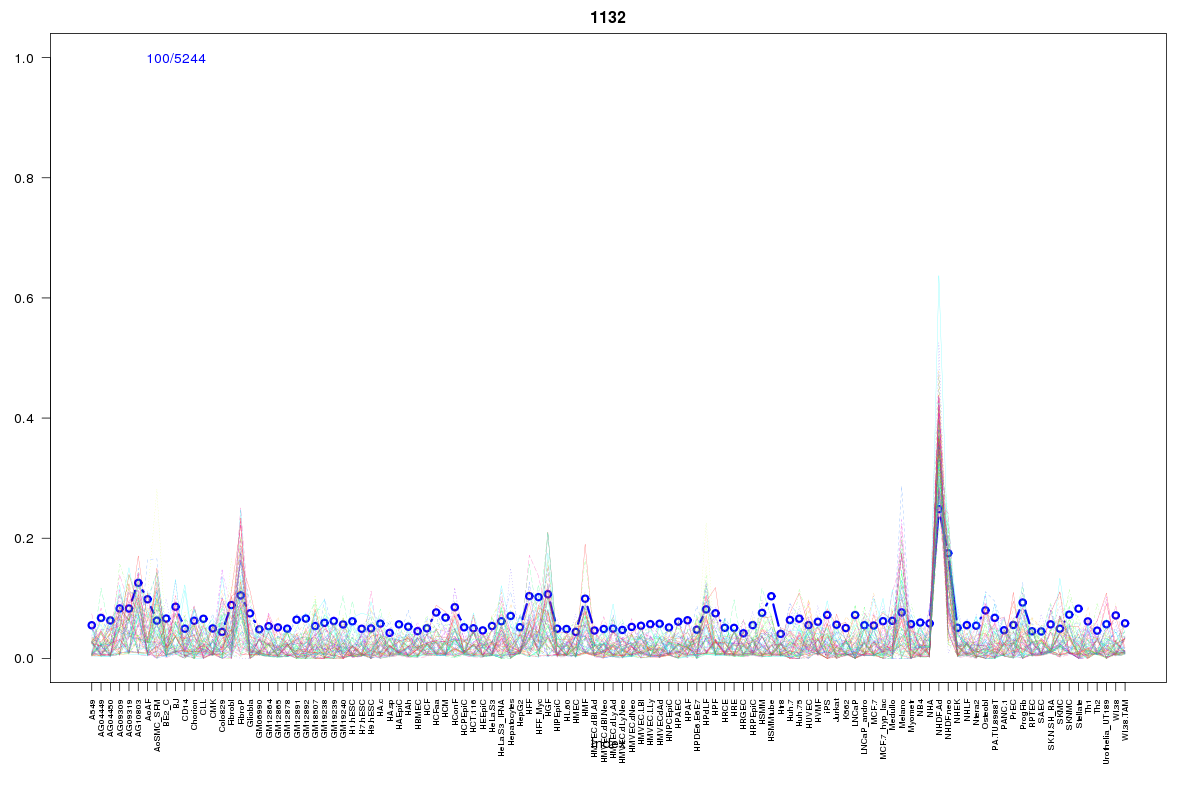 | 1132 | 1 |
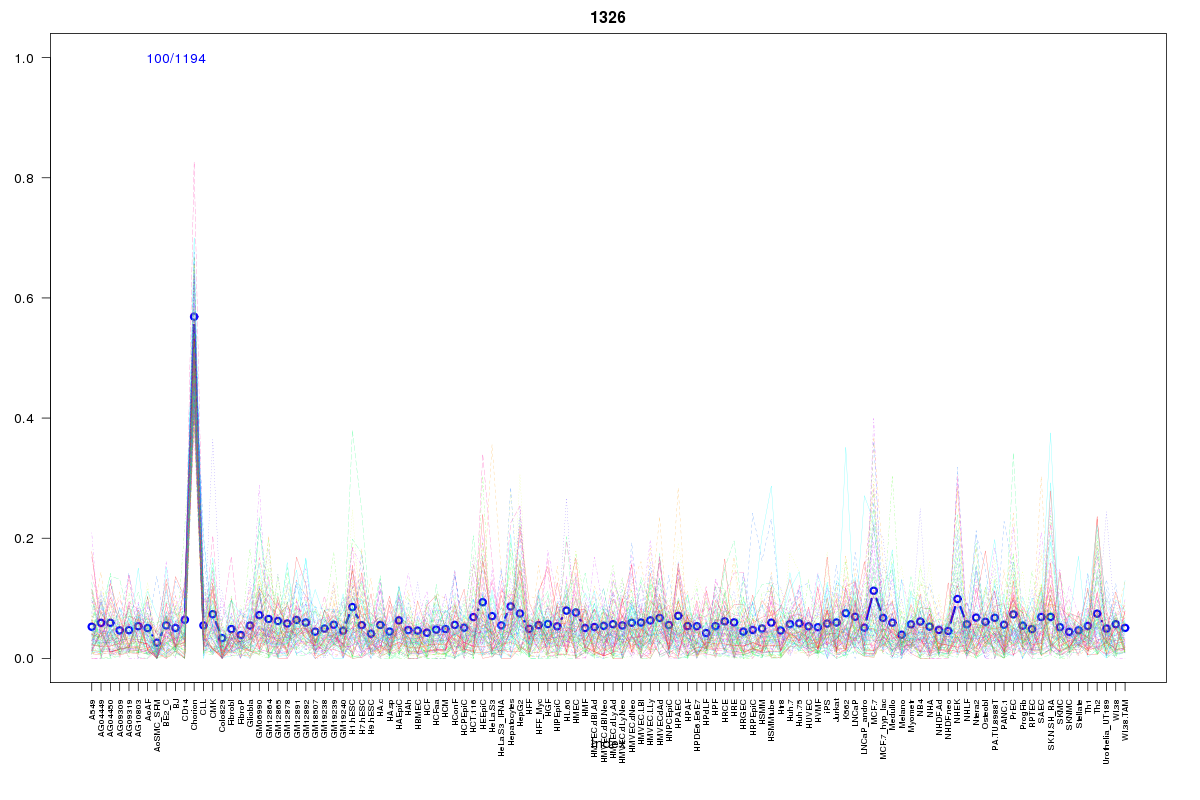 | 1326 | 1 |
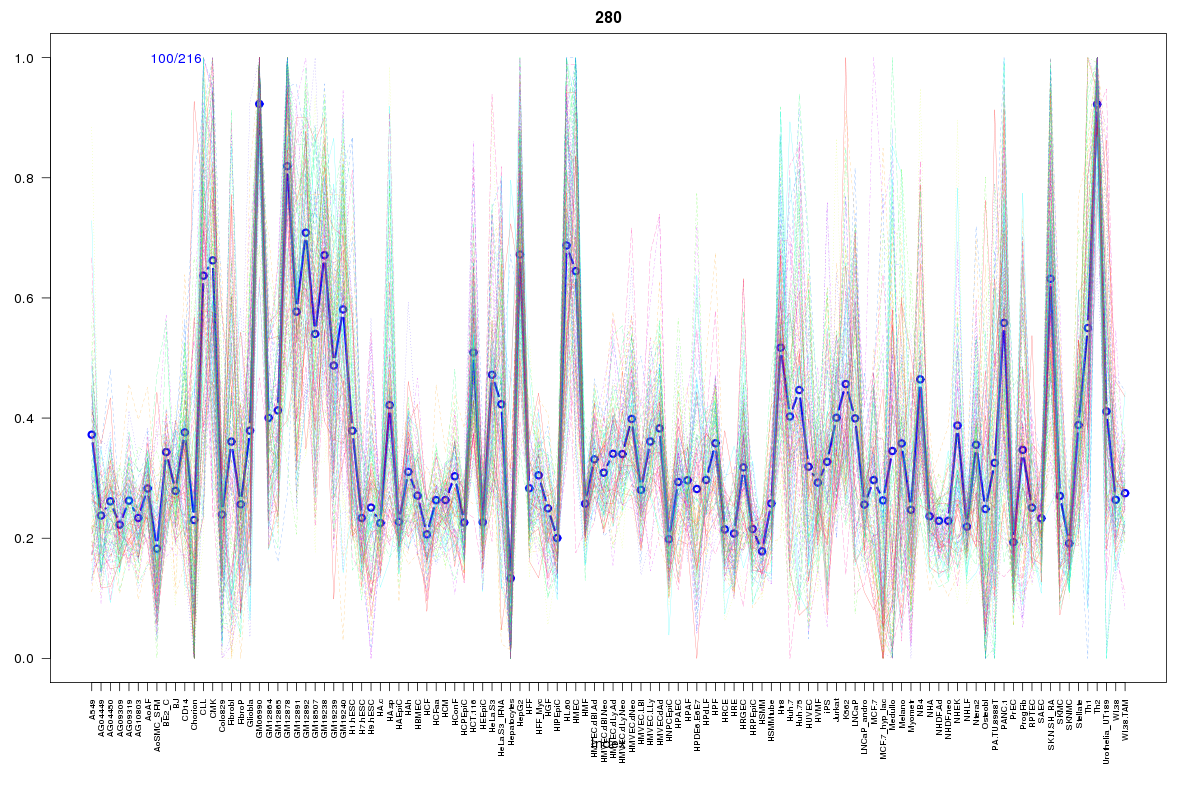 | 280 | 1 |
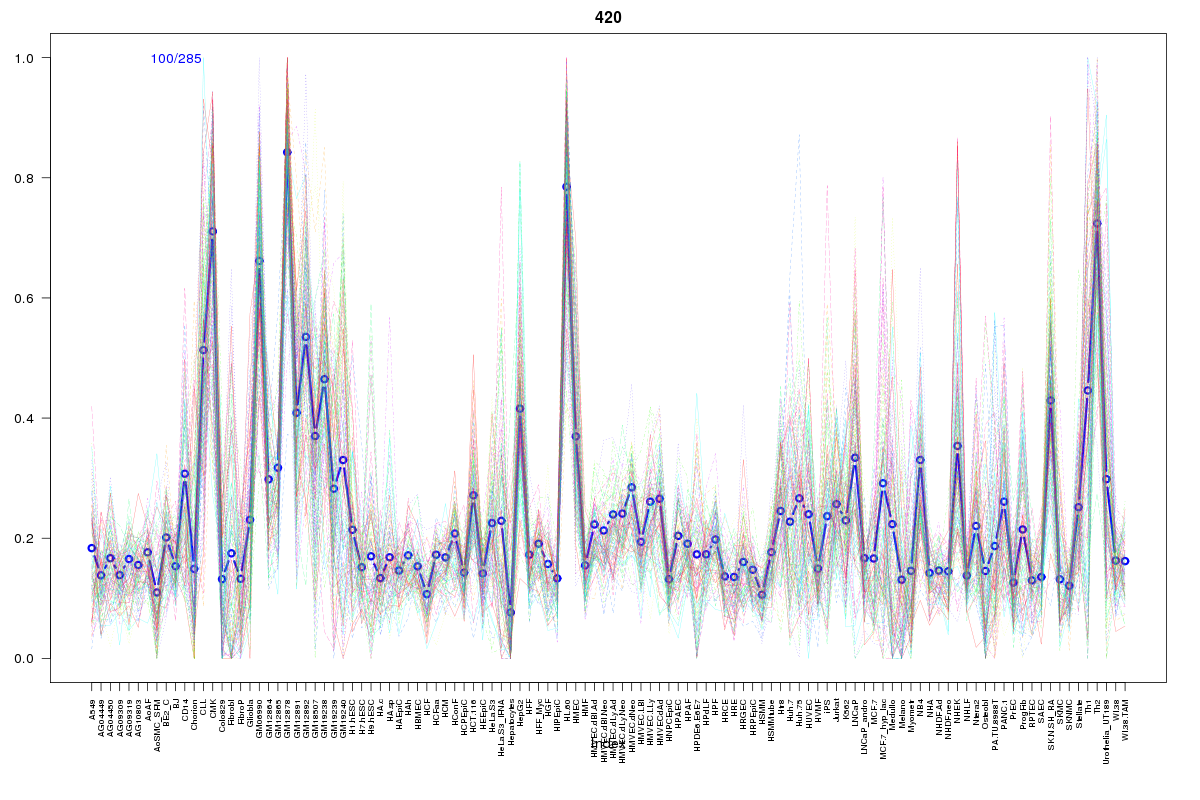 | 420 | 1 |
 | 134 | 1 |
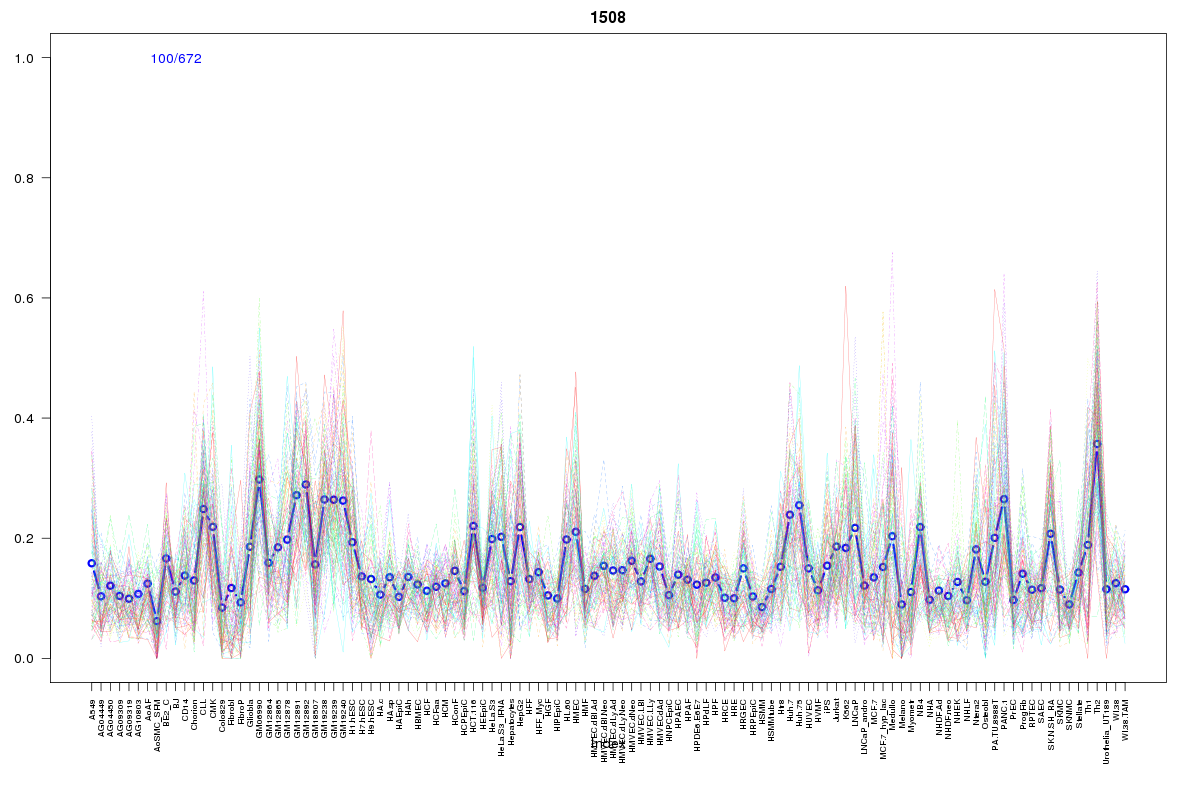 | 1508 | 1 |
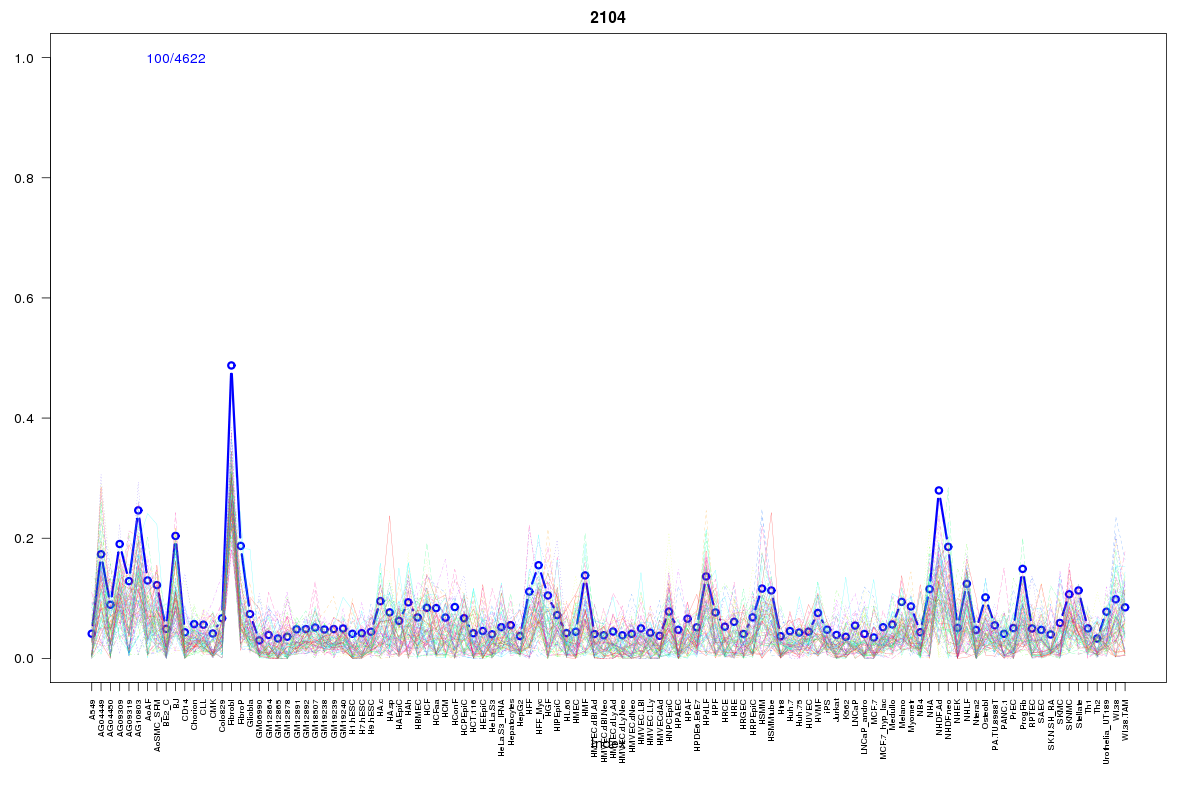 | 2104 | 1 |
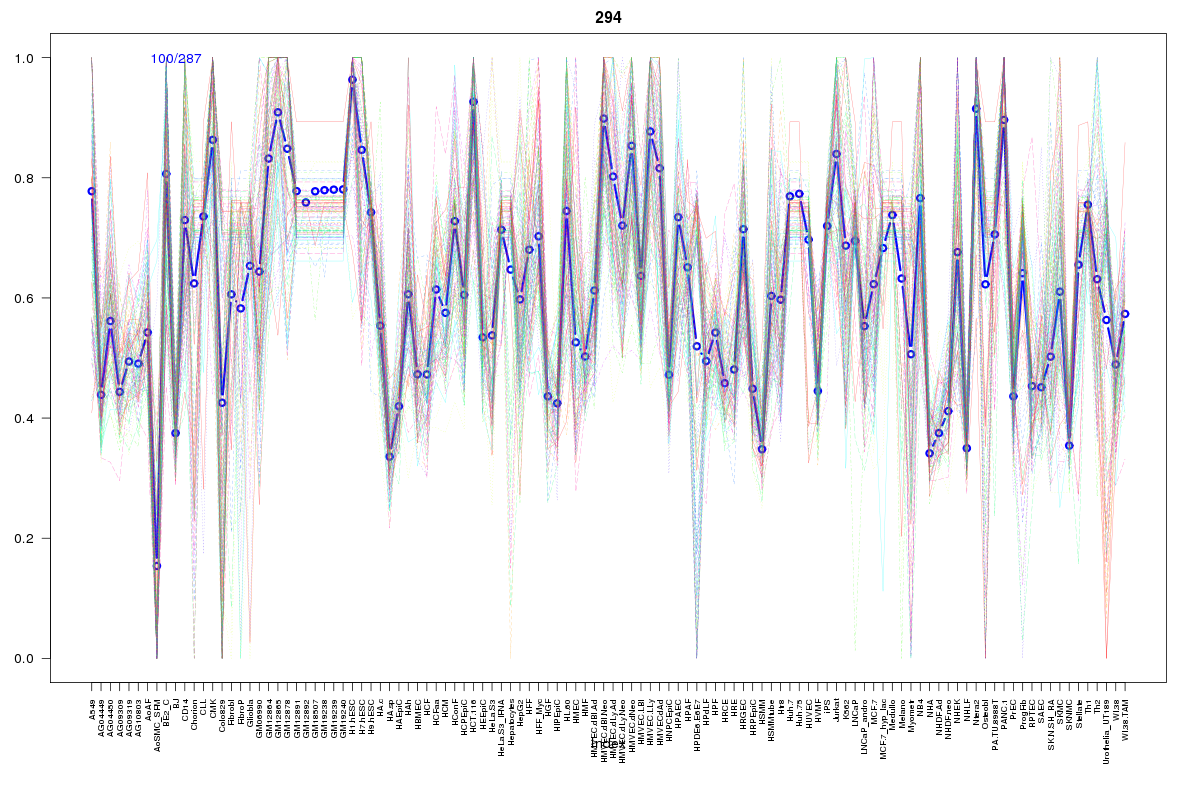 | 294 | 1 |
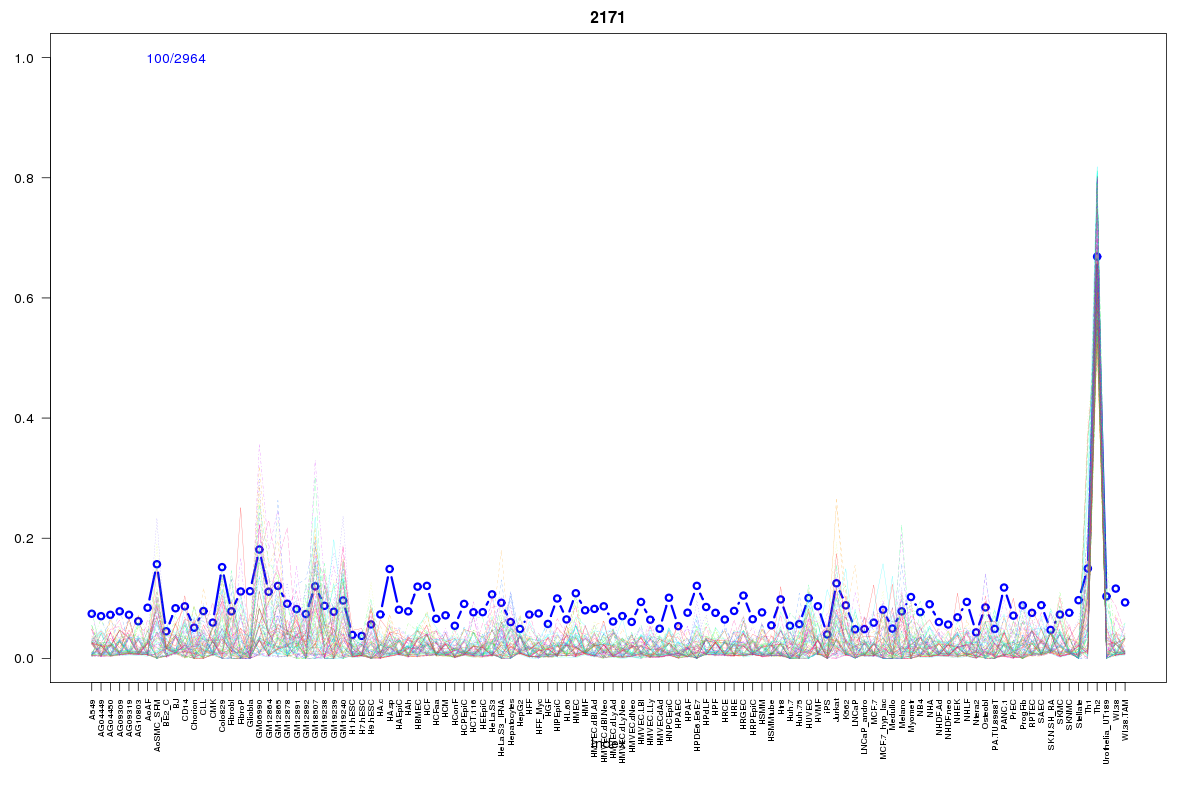 | 2171 | 1 |
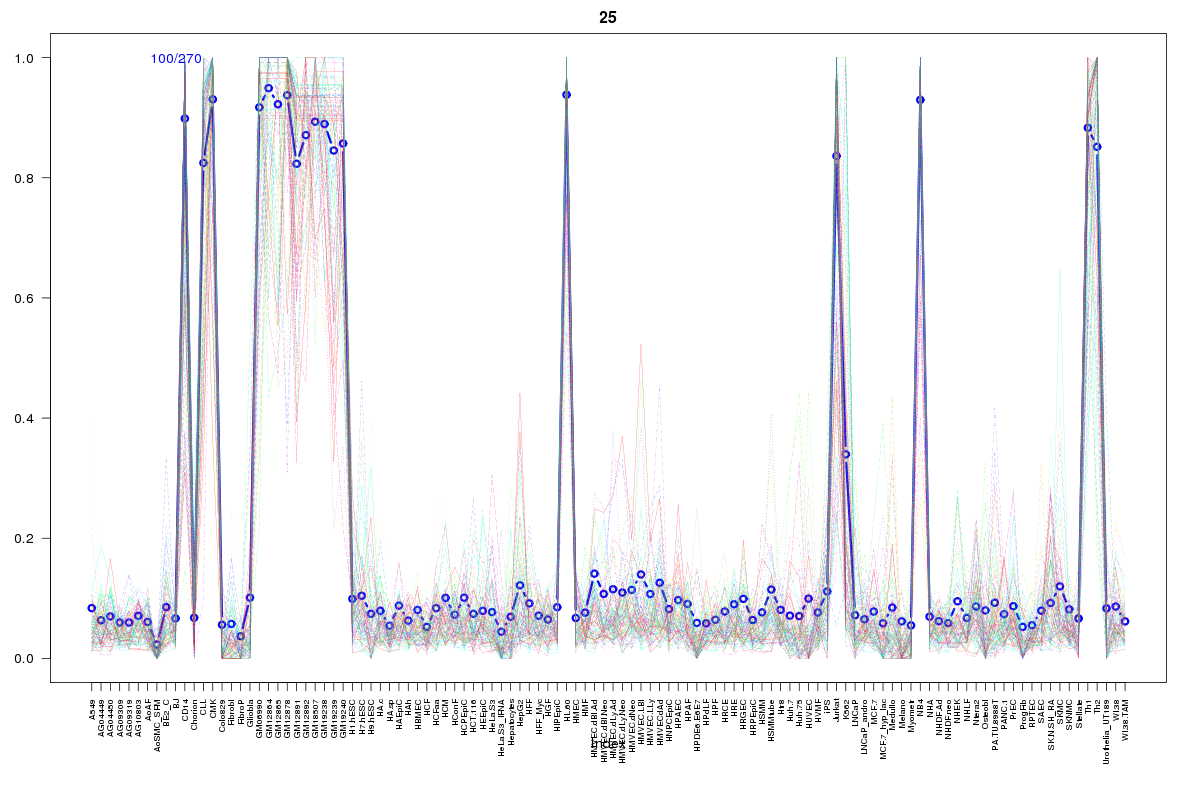 | 25 | 1 |
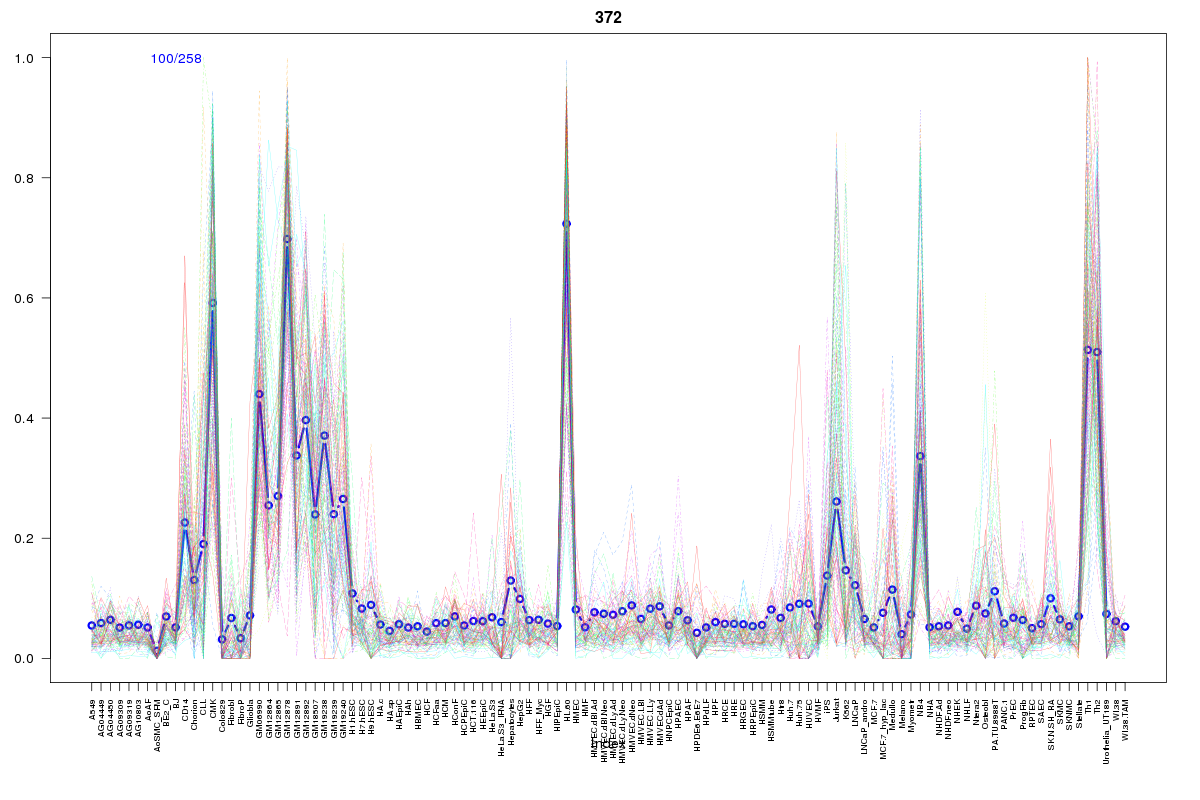 | 372 | 1 |
 | 570 | 1 |
 | 2072 | 1 |
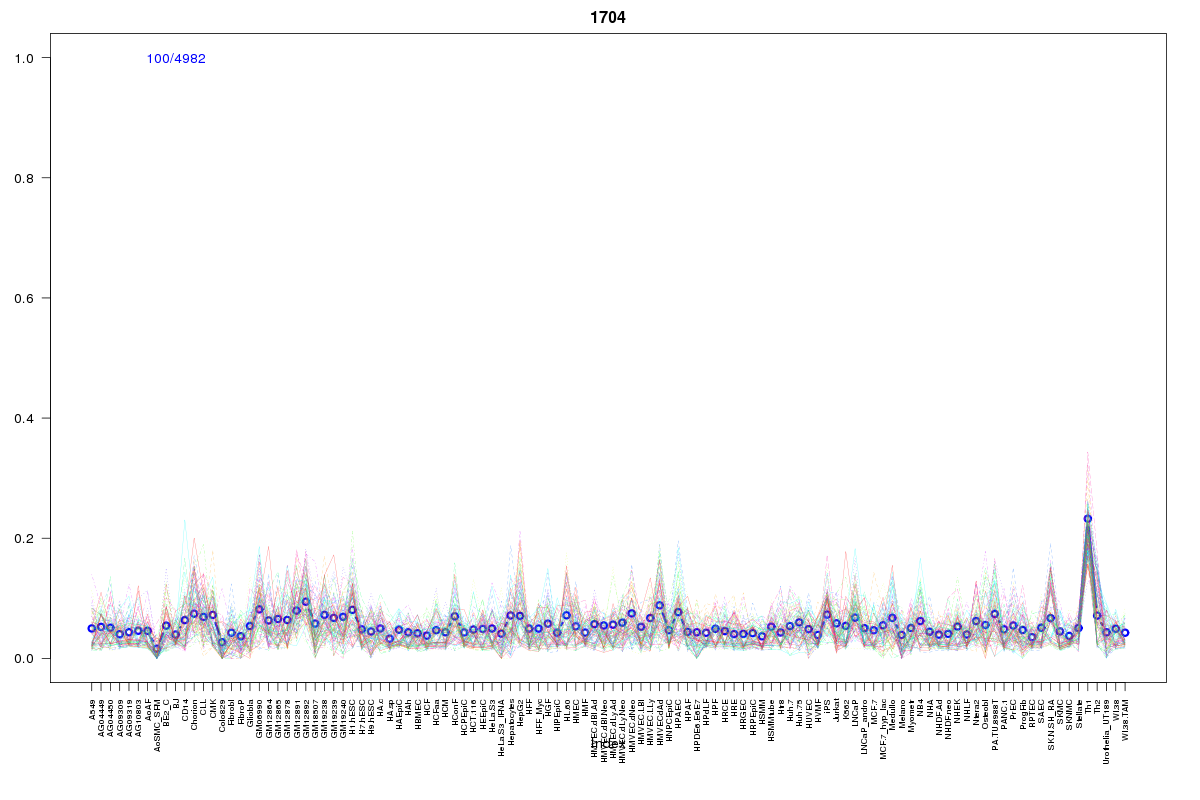 | 1704 | 1 |
Resources
BED file downloads
Connects to 21 DHS sitesTop 10 Correlated DHS Sites
p-values indiciate significant higher or lower correlation| Location | Cluster | P-value |
|---|---|---|
| chr1:151129020-151129170 | 25 | 0 |
| chr1:151130880-151131030 | 570 | 0 |
| chr1:151171300-151171450 | 420 | 0 |
| chr1:151129680-151129830 | 372 | 0.001 |
| chr1:151043760-151043910 | 433 | 0.002 |
| chr1:151043400-151043550 | 134 | 0.006 |
| chr1:151131125-151131275 | 2072 | 0.009 |
| chr1:151171545-151171695 | 1508 | 0.013 |
| chr1:151128580-151128730 | 294 | 0.016 |
| chr1:151162320-151162470 | 280 | 0.018 |
| chr1:151134265-151134415 | 1704 | 0.019 |
External Databases
UCSCEnsembl (ENSG00000163156)