Gene: ATP1A1
chr1: 116915289-116930777Expression Profile
(log scale)
Graphical Connections
Distribution of linked clusters:
You may find it interesting if many of the connected DHS sites belong to the same cluster.| Cluster Profile | Cluster ID | Number of DHS sites in this cluster |
|---|---|---|
 | 862 | 4 |
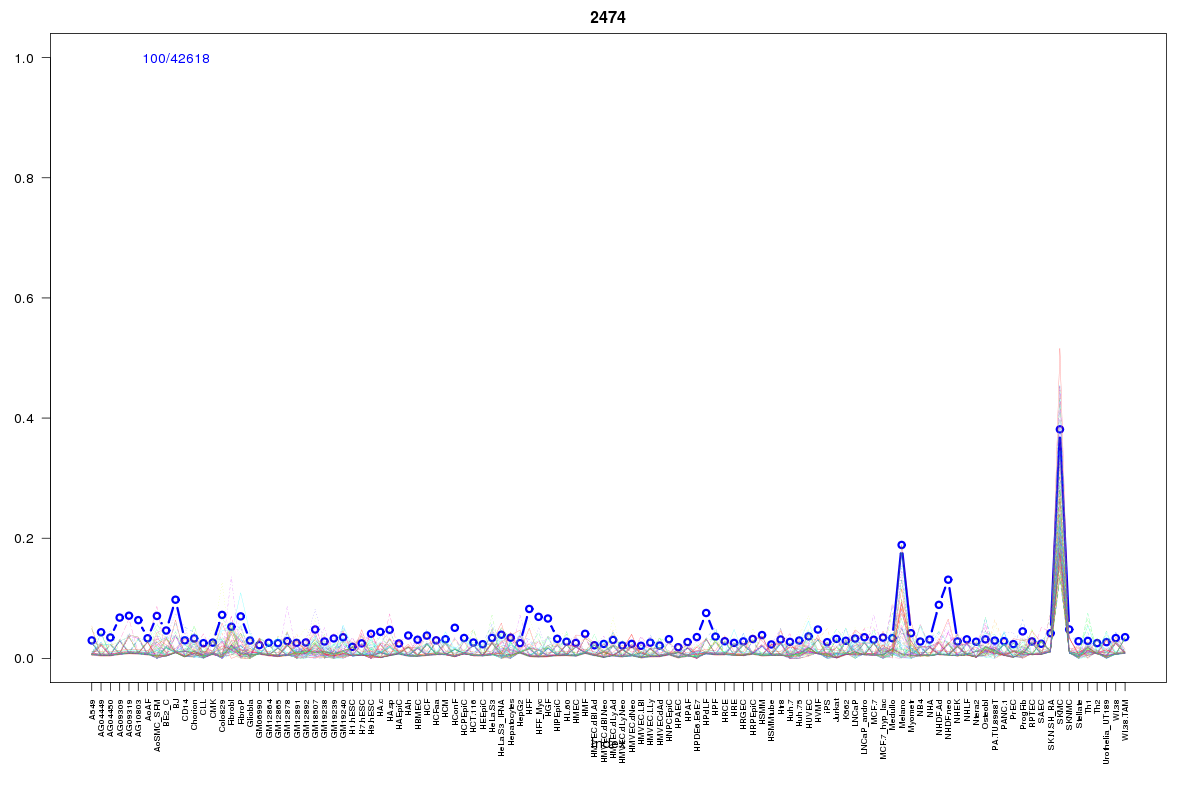 | 2474 | 2 |
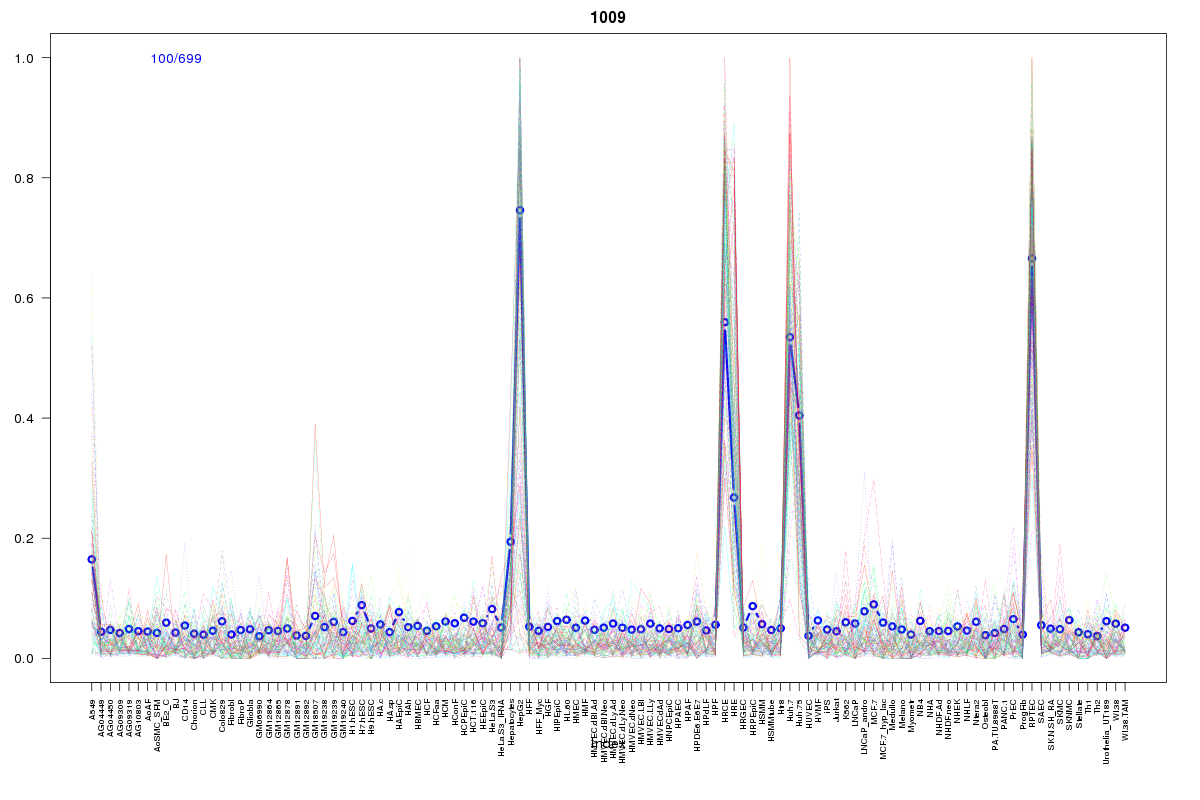 | 1009 | 2 |
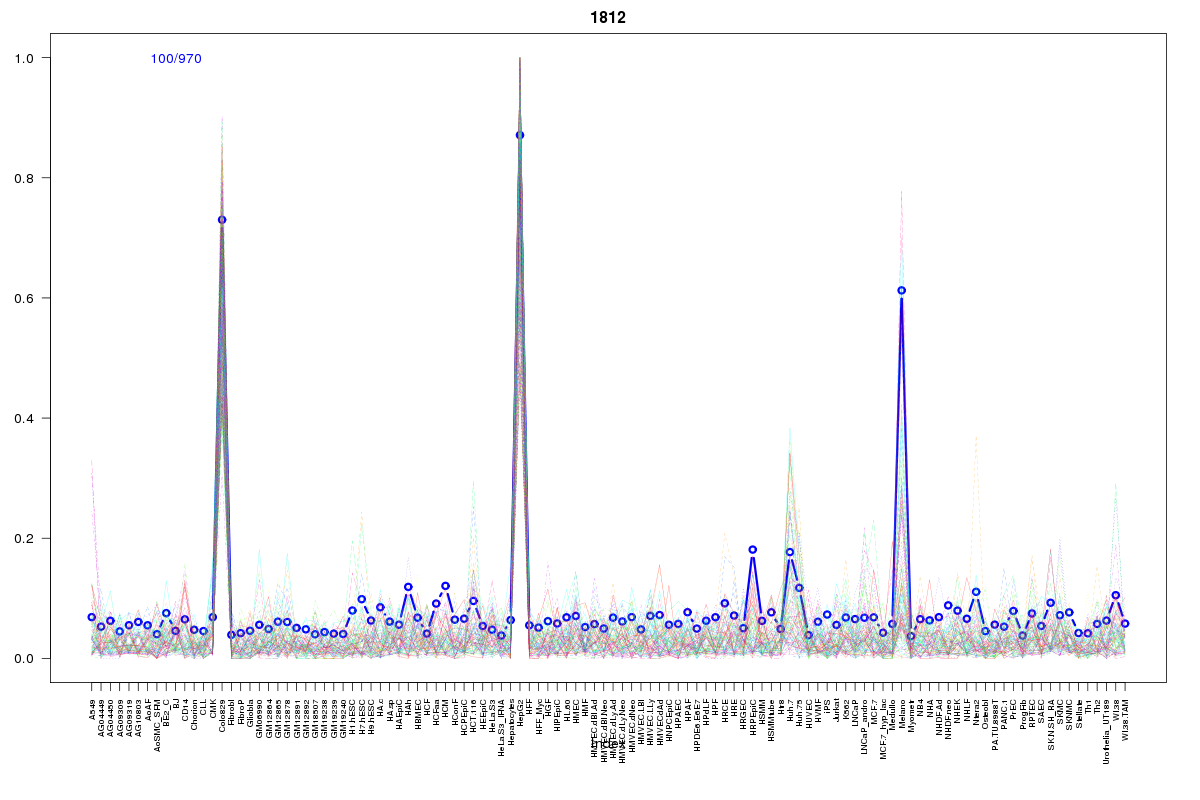 | 1812 | 2 |
 | 2468 | 2 |
 | 2322 | 2 |
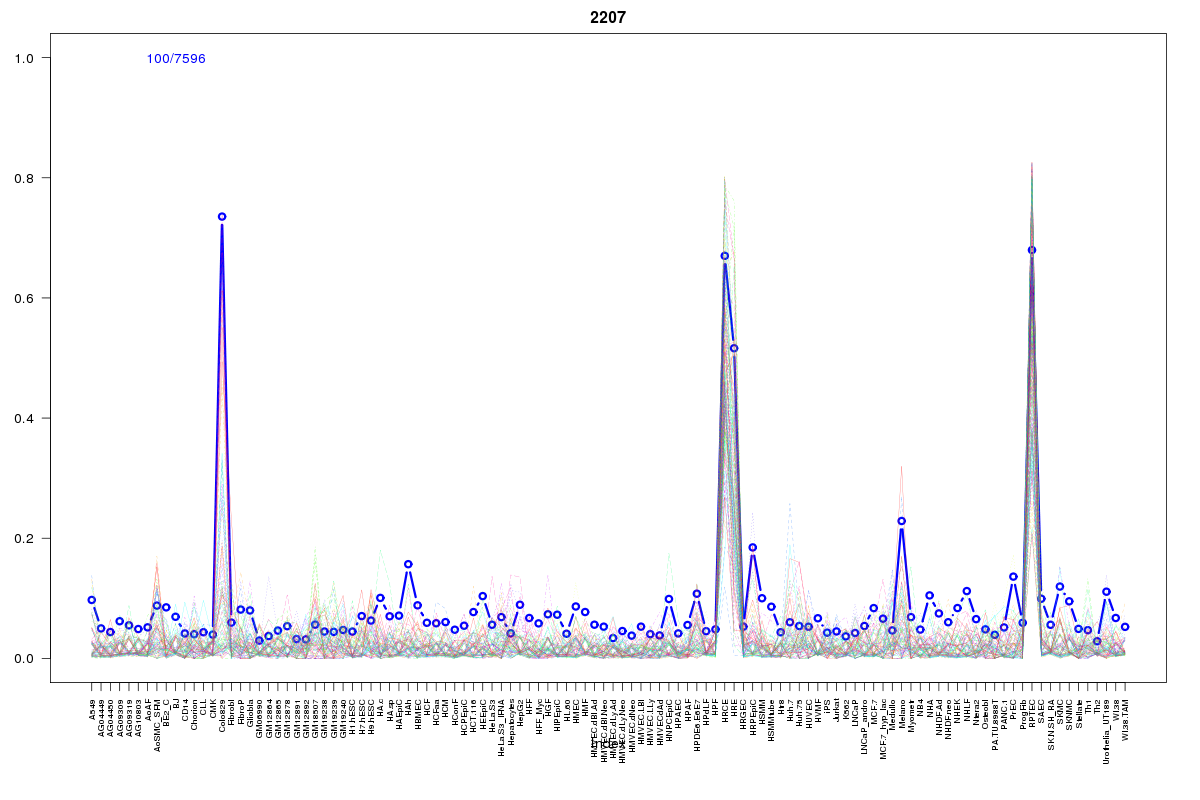 | 2207 | 2 |
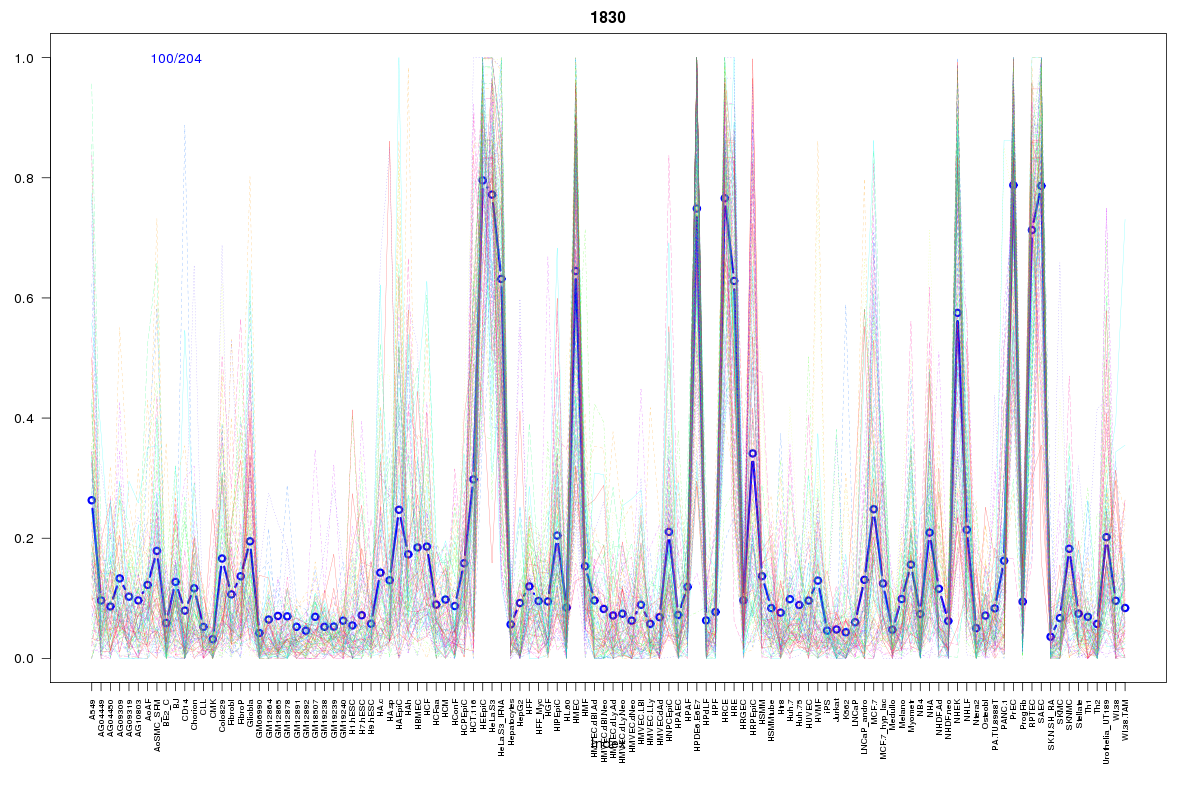 | 1830 | 1 |
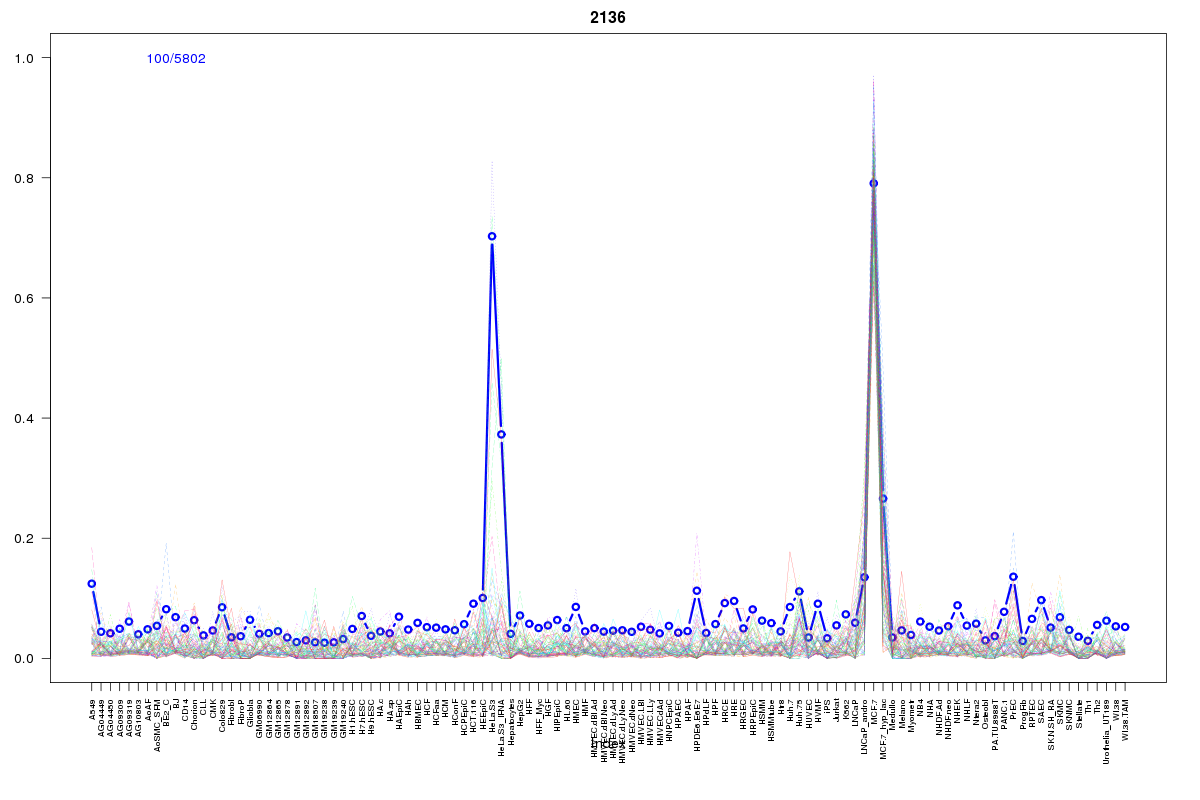 | 2136 | 1 |
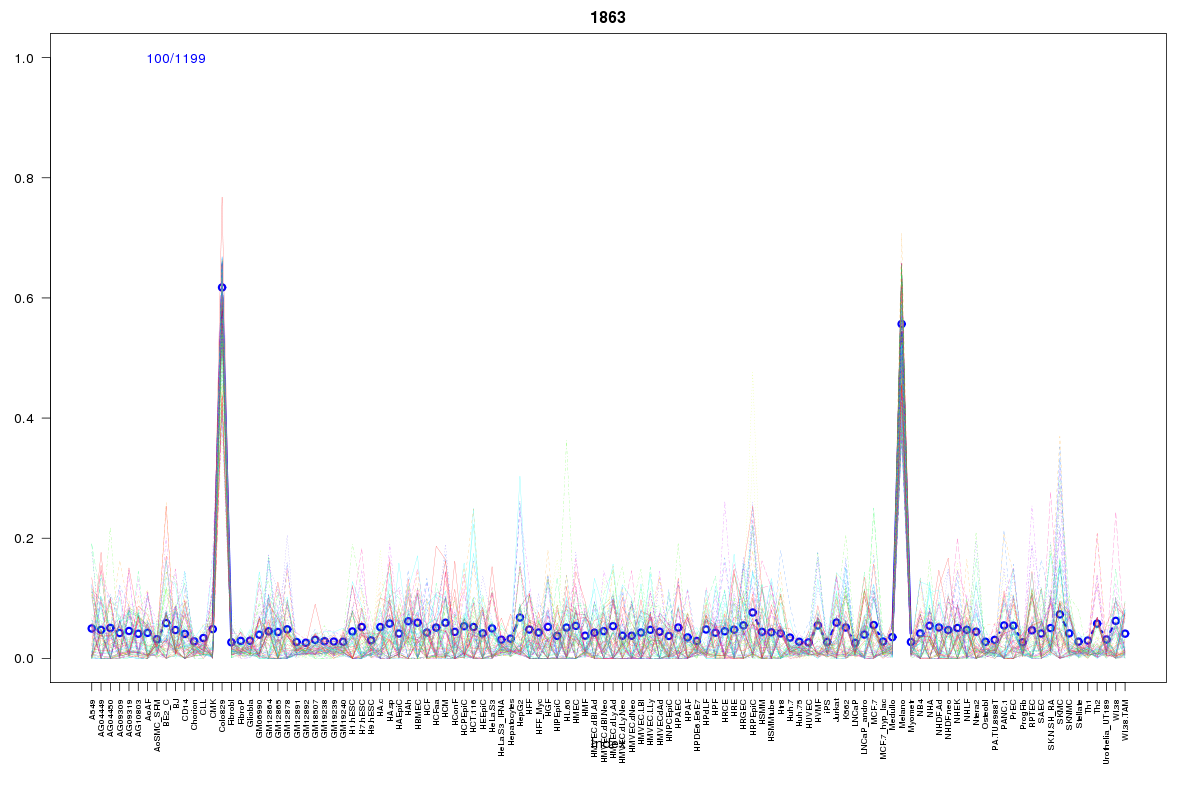 | 1863 | 1 |
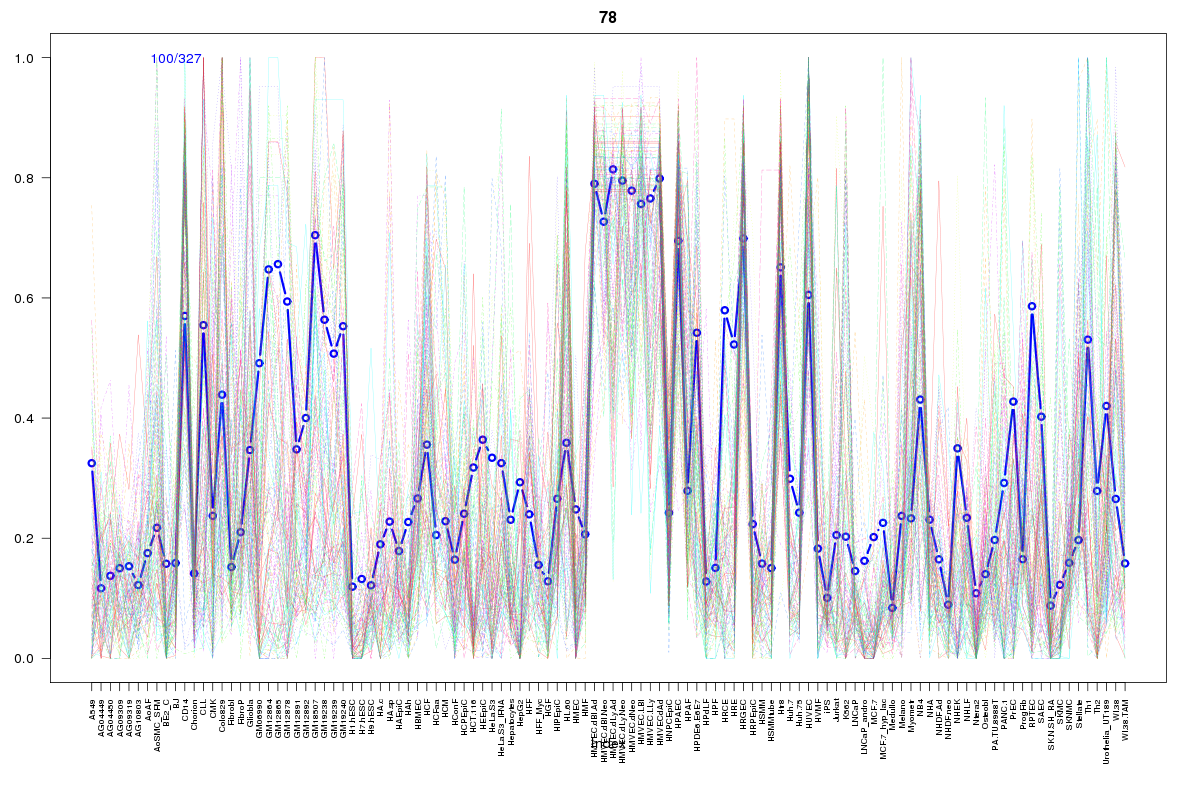 | 78 | 1 |
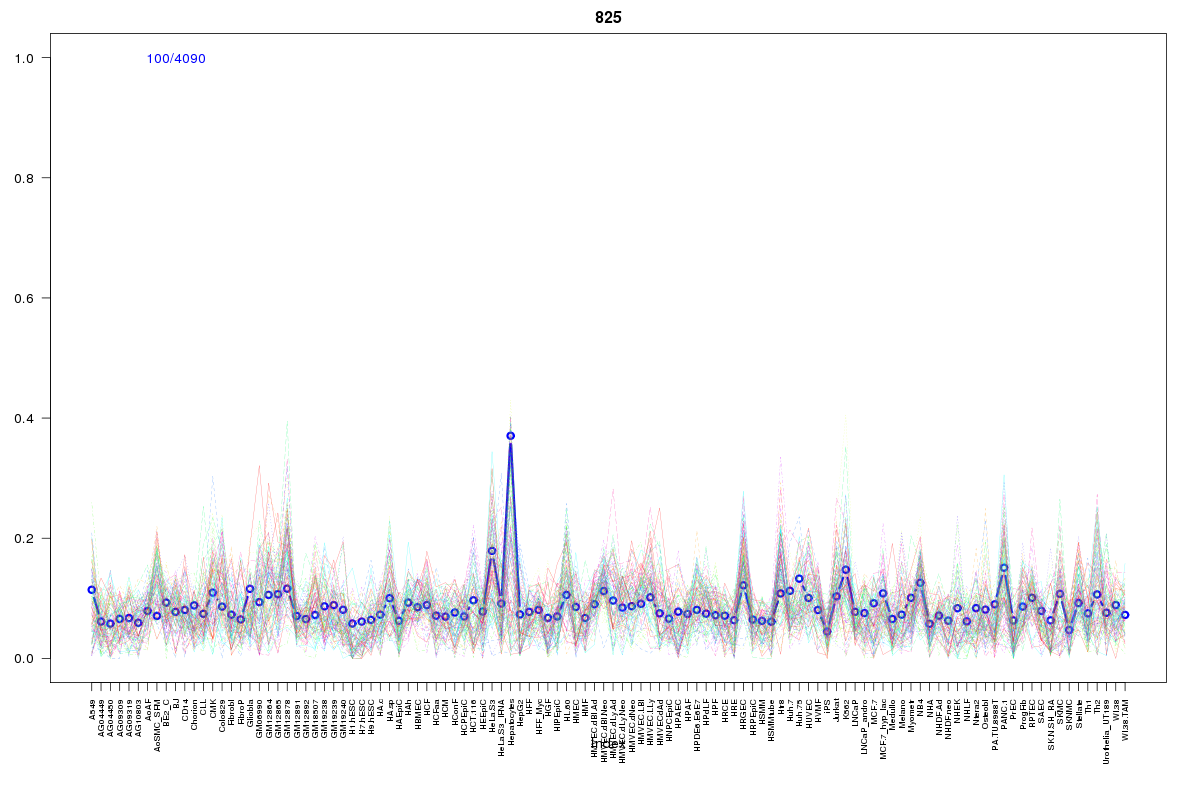 | 825 | 1 |
 | 1011 | 1 |
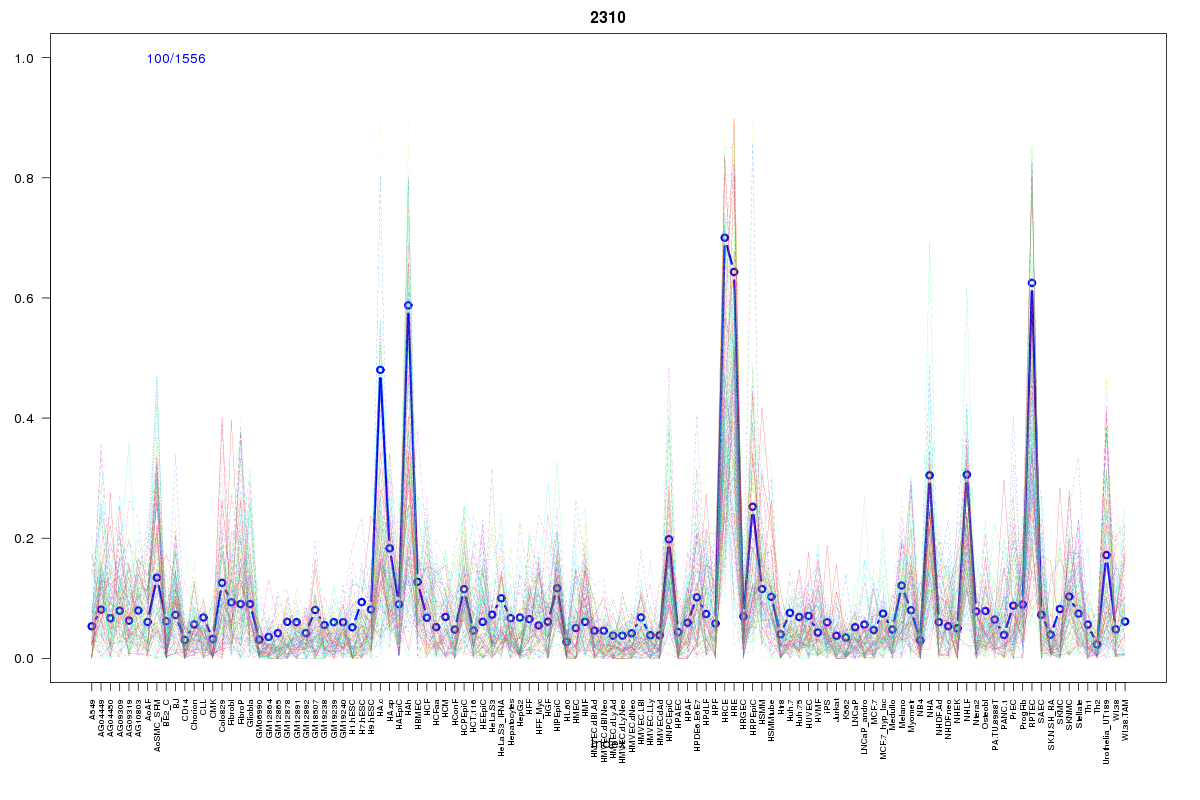 | 2310 | 1 |
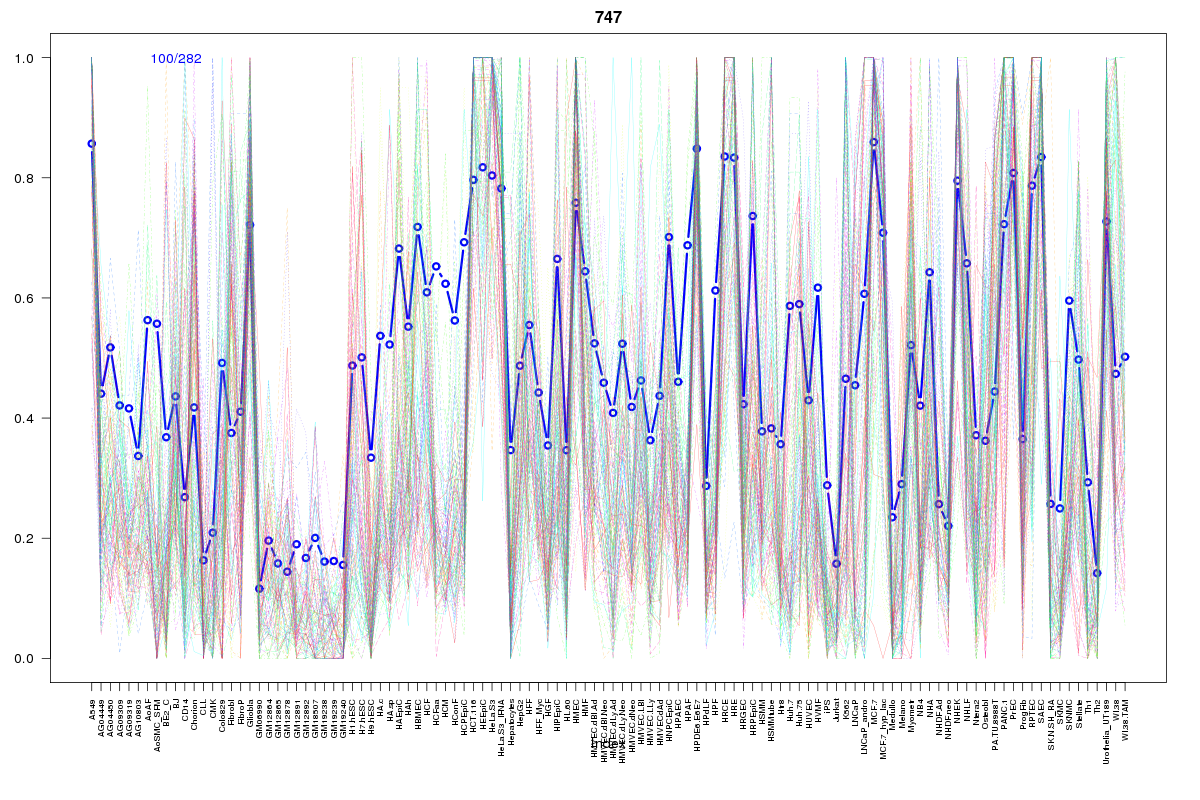 | 747 | 1 |
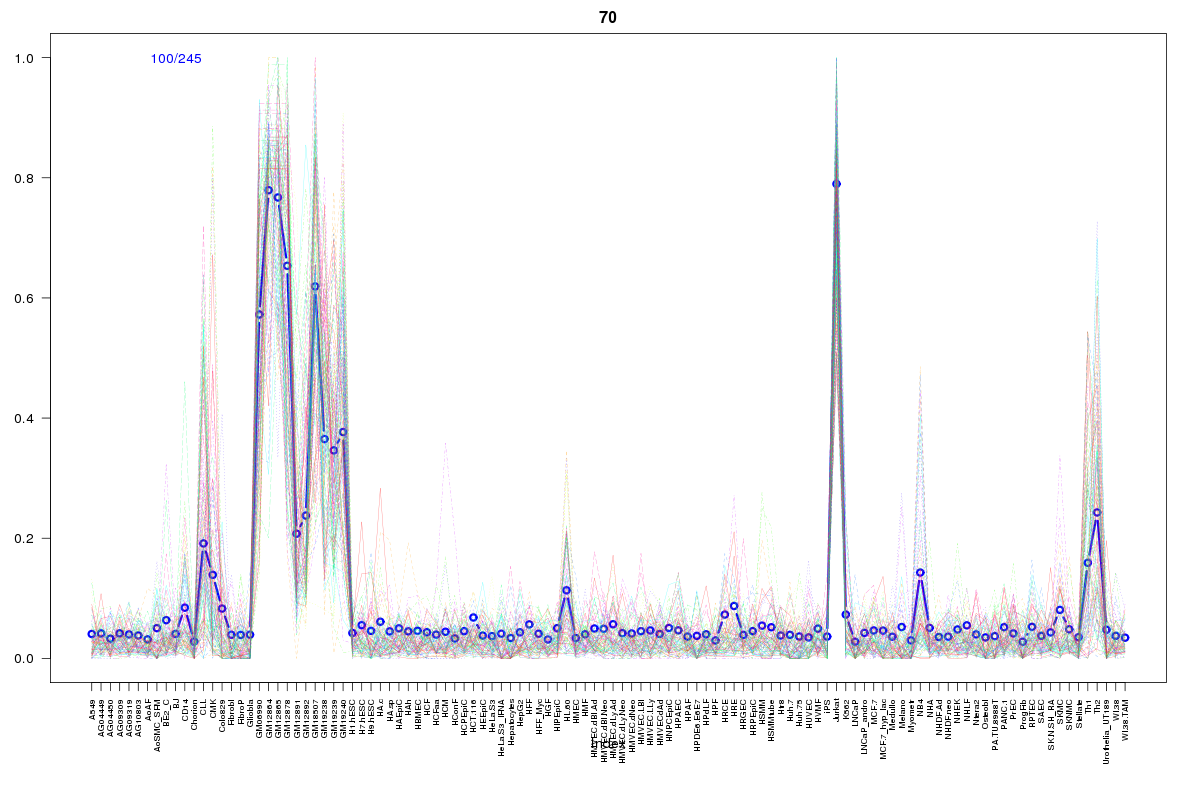 | 70 | 1 |
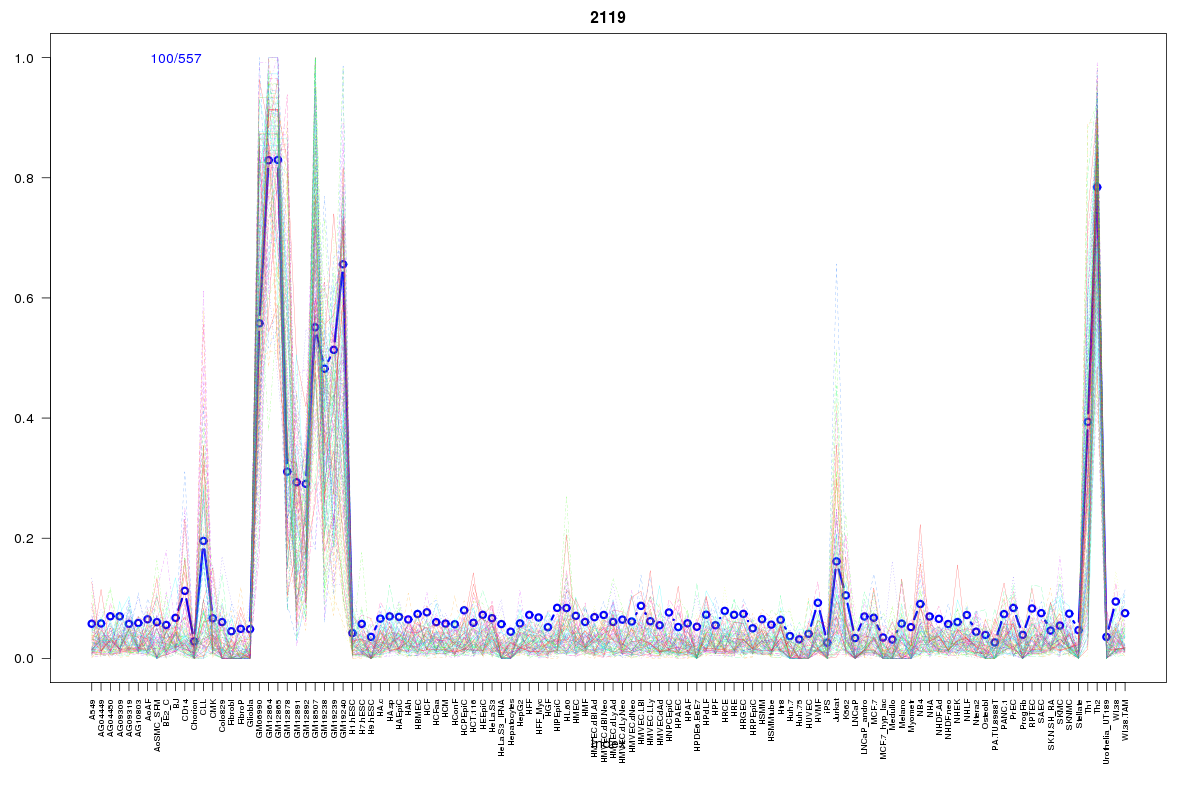 | 2119 | 1 |
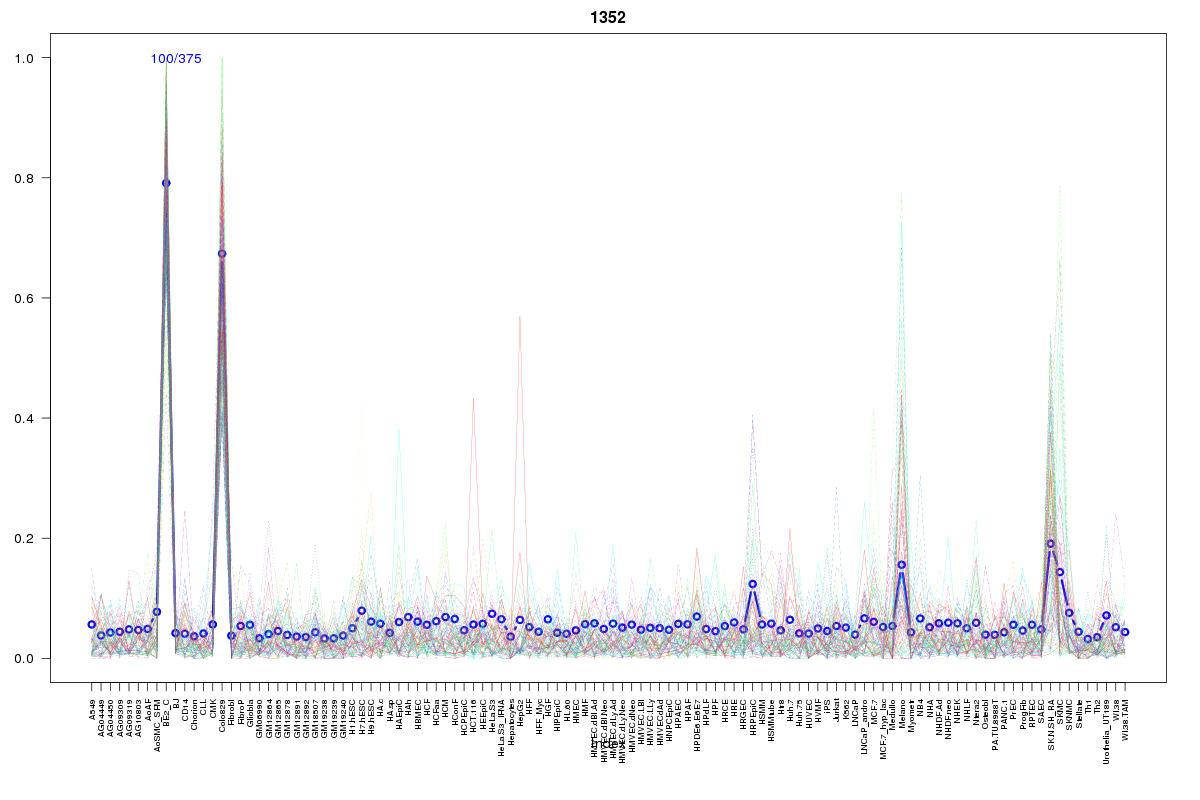 | 1352 | 1 |
 | 1065 | 1 |
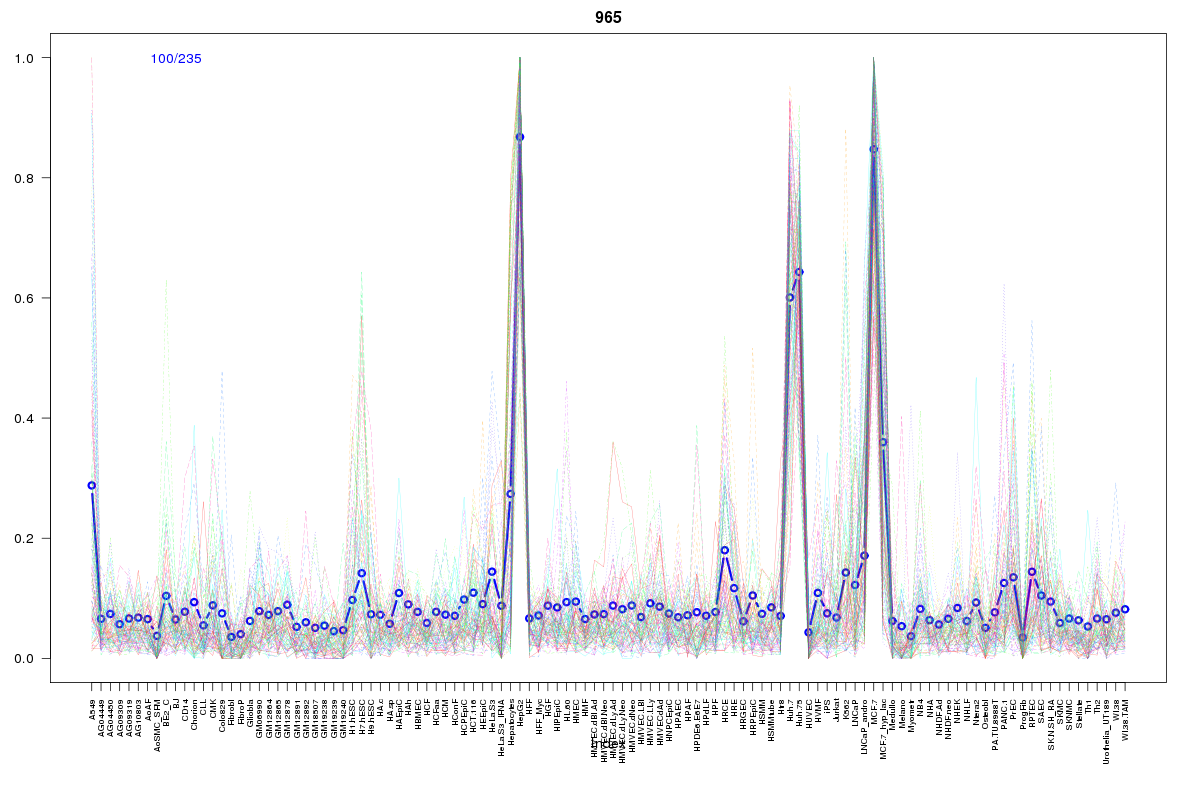 | 965 | 1 |
 | 2290 | 1 |
 | 1401 | 1 |
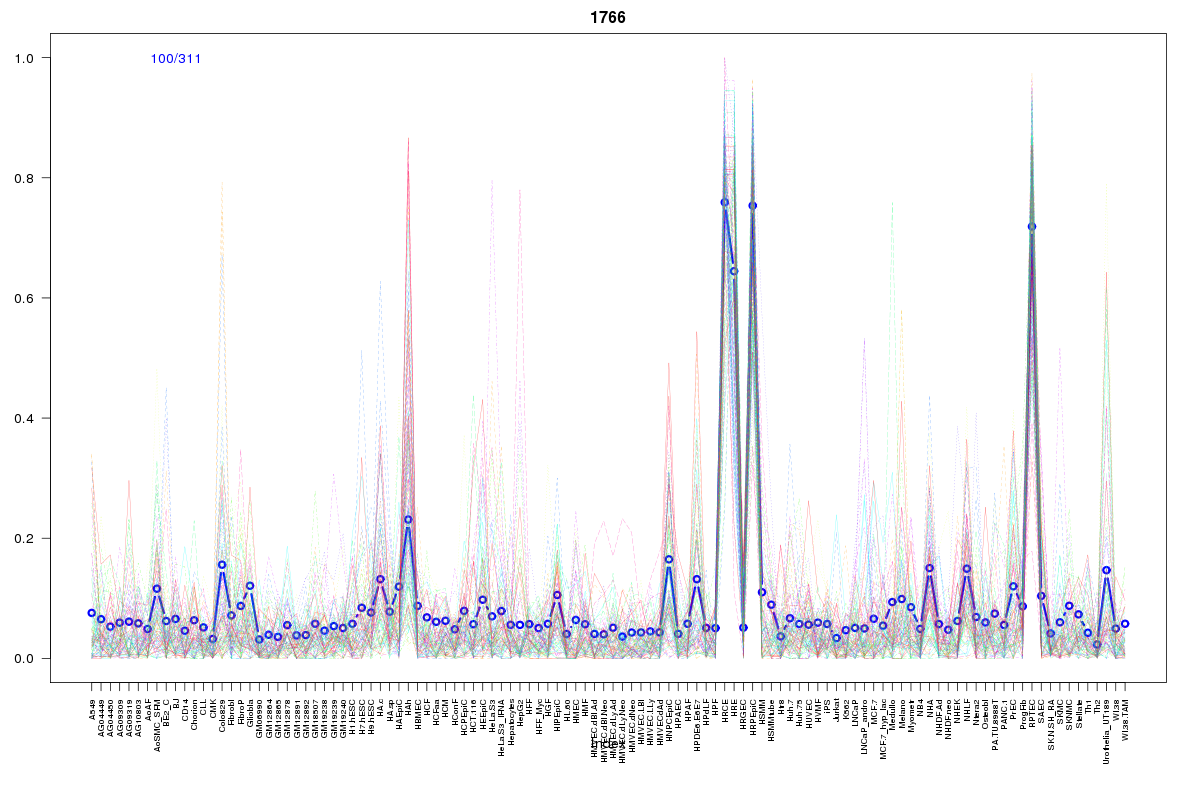 | 1766 | 1 |
 | 1698 | 1 |
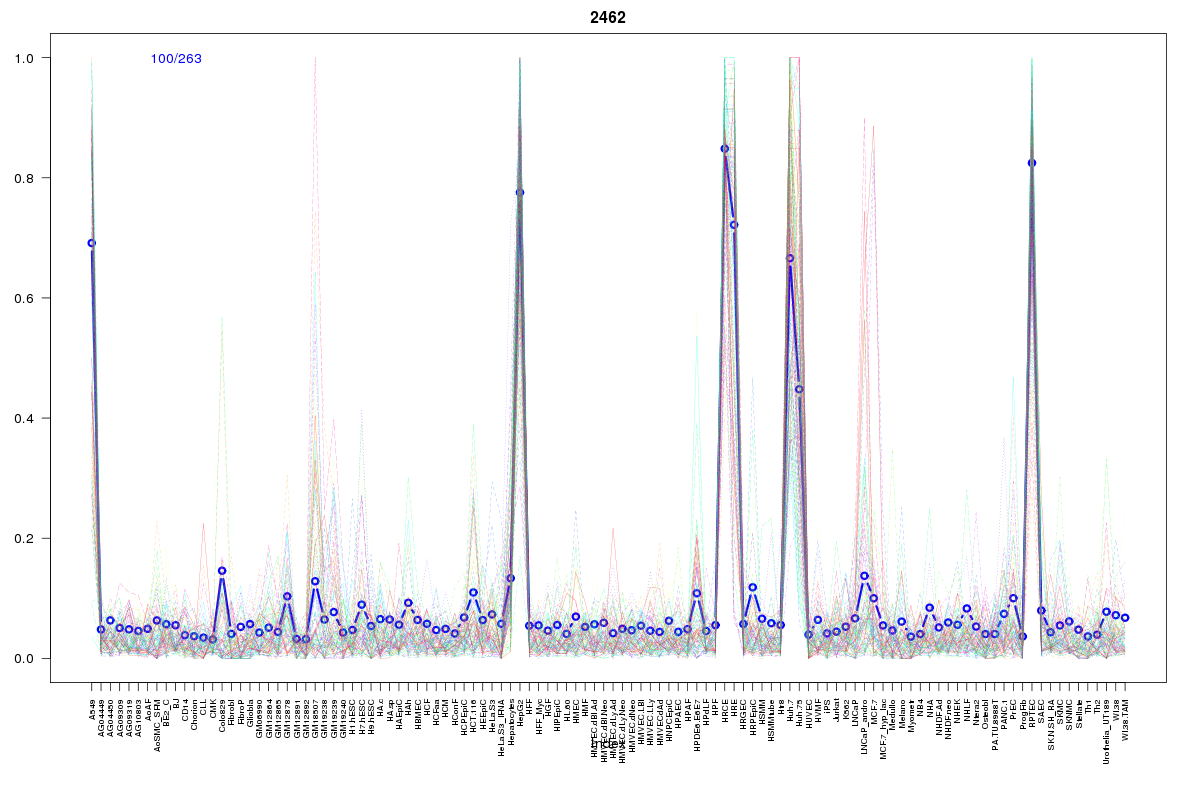 | 2462 | 1 |
Resources
BED file downloads
Connects to 34 DHS sitesTop 10 Correlated DHS Sites
p-values indiciate significant higher or lower correlation| Location | Cluster | P-value |
|---|---|---|
| chr1:117017900-117018050 | 2462 | 0 |
| chr1:117032080-117032230 | 78 | 0 |
| chr1:116917540-116917690 | 1011 | 0 |
| chr1:116876840-116876990 | 1698 | 0.002 |
| chr1:116954960-116955110 | 1009 | 0.002 |
| chr1:116917340-116917490 | 825 | 0.003 |
| chr1:117033365-117033515 | 2474 | 0.004 |
| chr1:116883580-116883730 | 1830 | 0.004 |
| chr1:116854960-116855110 | 965 | 0.004 |
| chr1:117018080-117018230 | 1009 | 0.004 |
| chr1:117015280-117015430 | 1766 | 0.005 |
External Databases
UCSCEnsembl (ENSG00000163399)