Gene: TMEM183A
chr1: 202976513-202993976Expression Profile
(log scale)
Graphical Connections
Distribution of linked clusters:
You may find it interesting if many of the connected DHS sites belong to the same cluster.| Cluster Profile | Cluster ID | Number of DHS sites in this cluster |
|---|---|---|
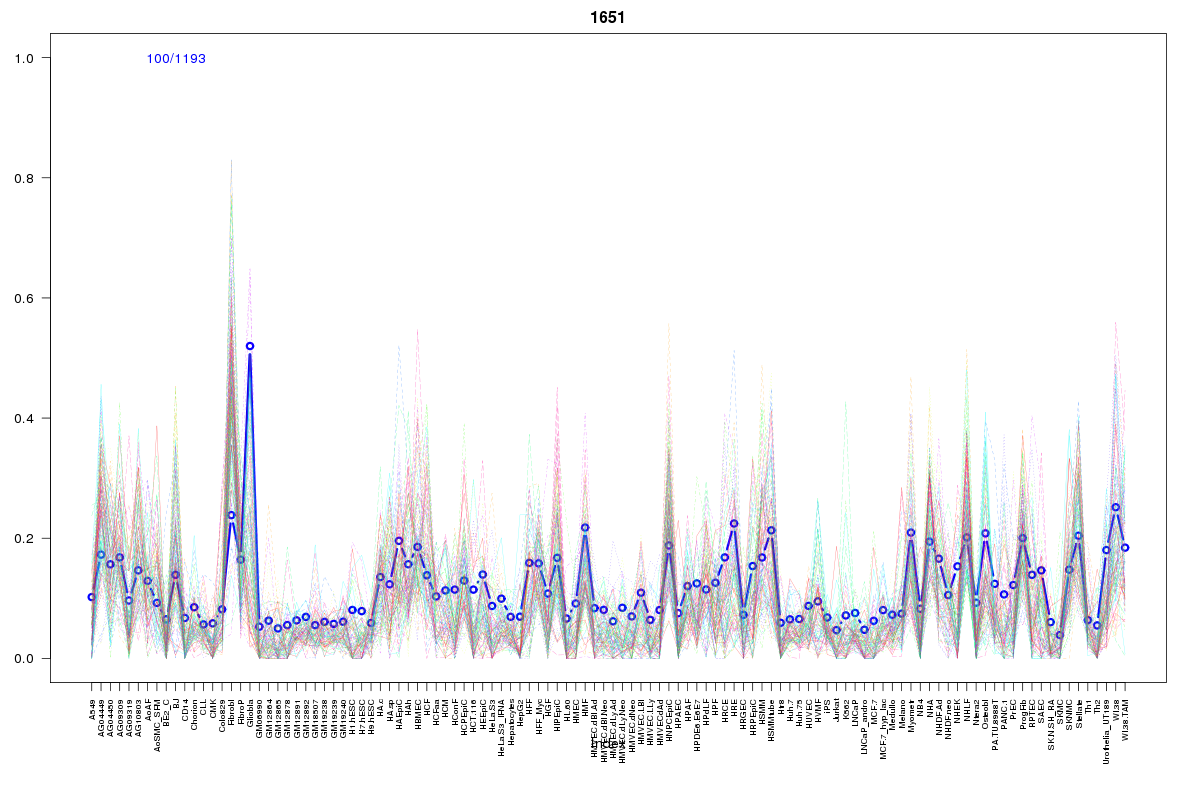 | 1651 | 2 |
 | 927 | 2 |
 | 2075 | 1 |
 | 1078 | 1 |
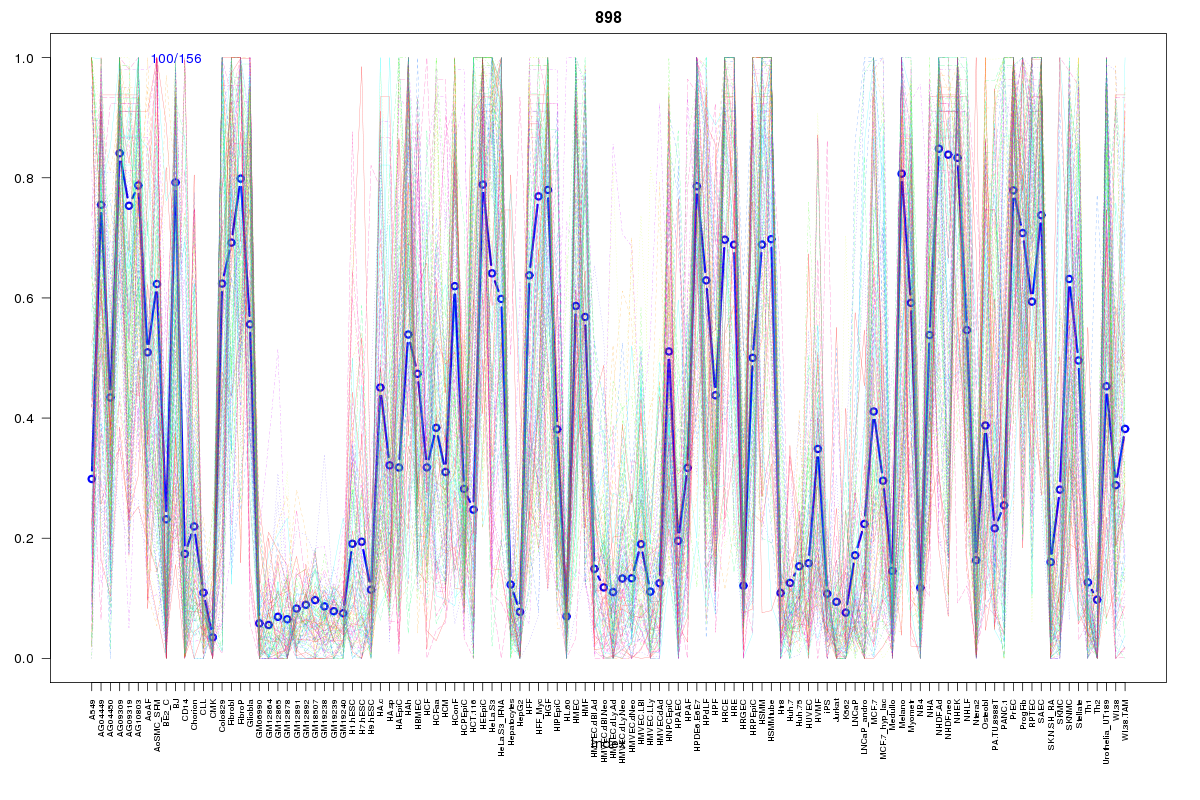 | 898 | 1 |
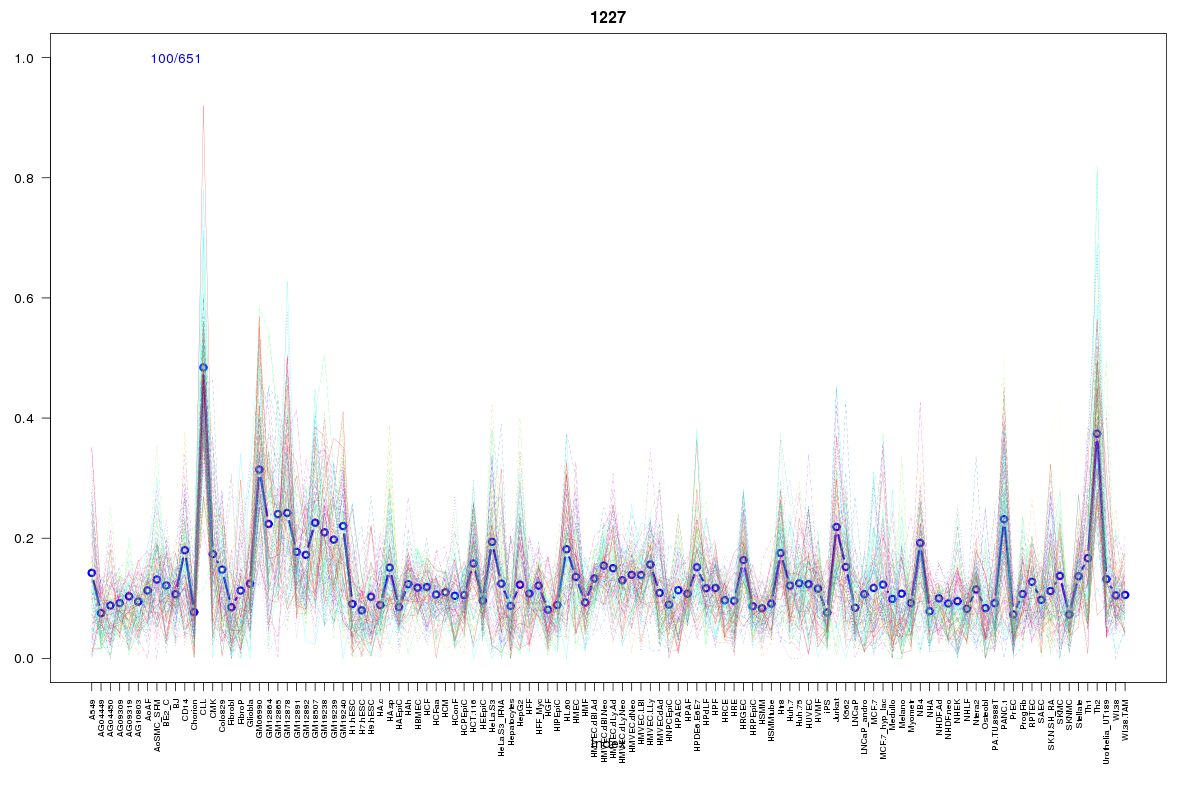 | 1227 | 1 |
 | 2052 | 1 |
 | 1095 | 1 |
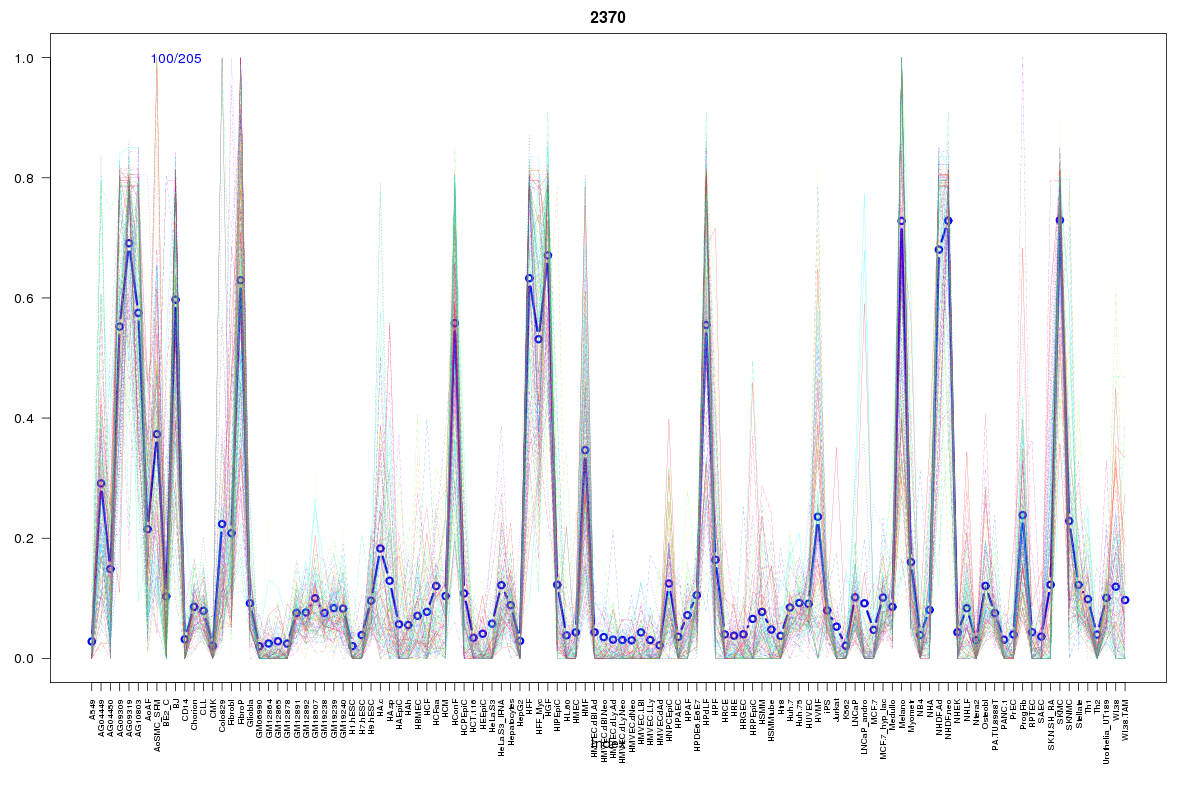 | 2370 | 1 |
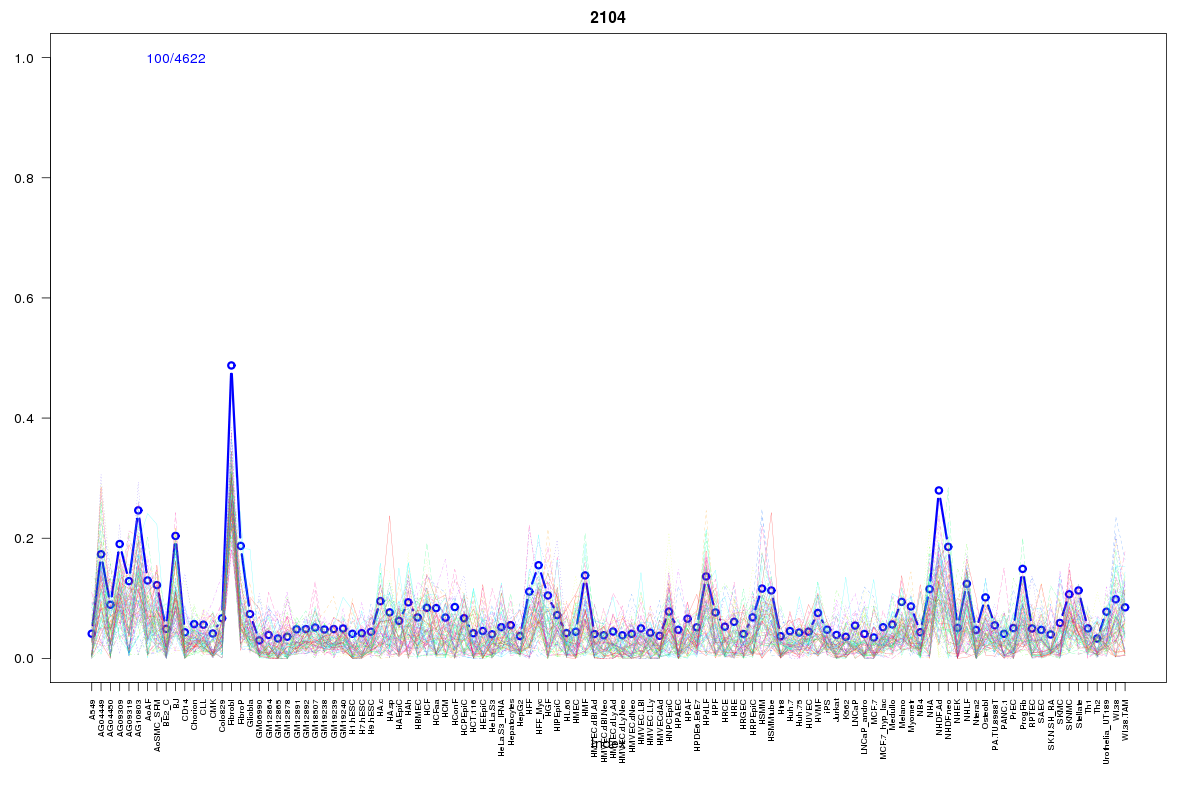 | 2104 | 1 |
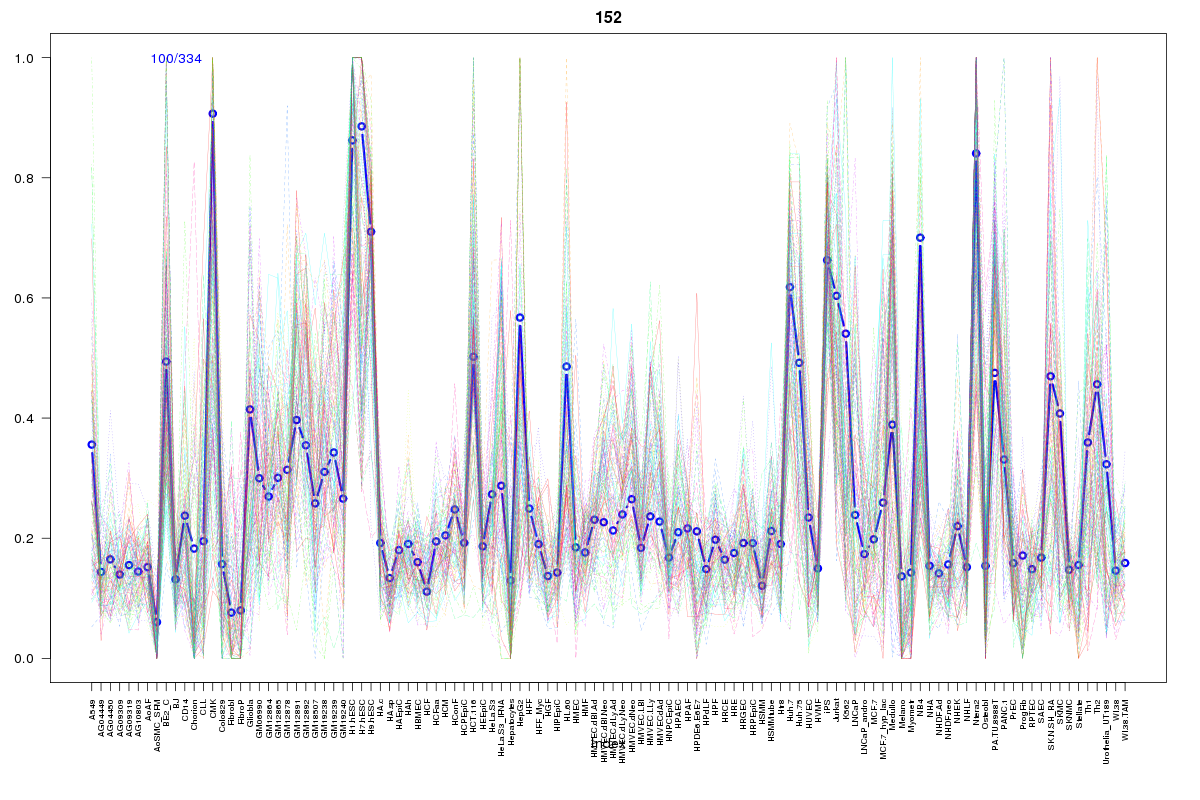 | 152 | 1 |
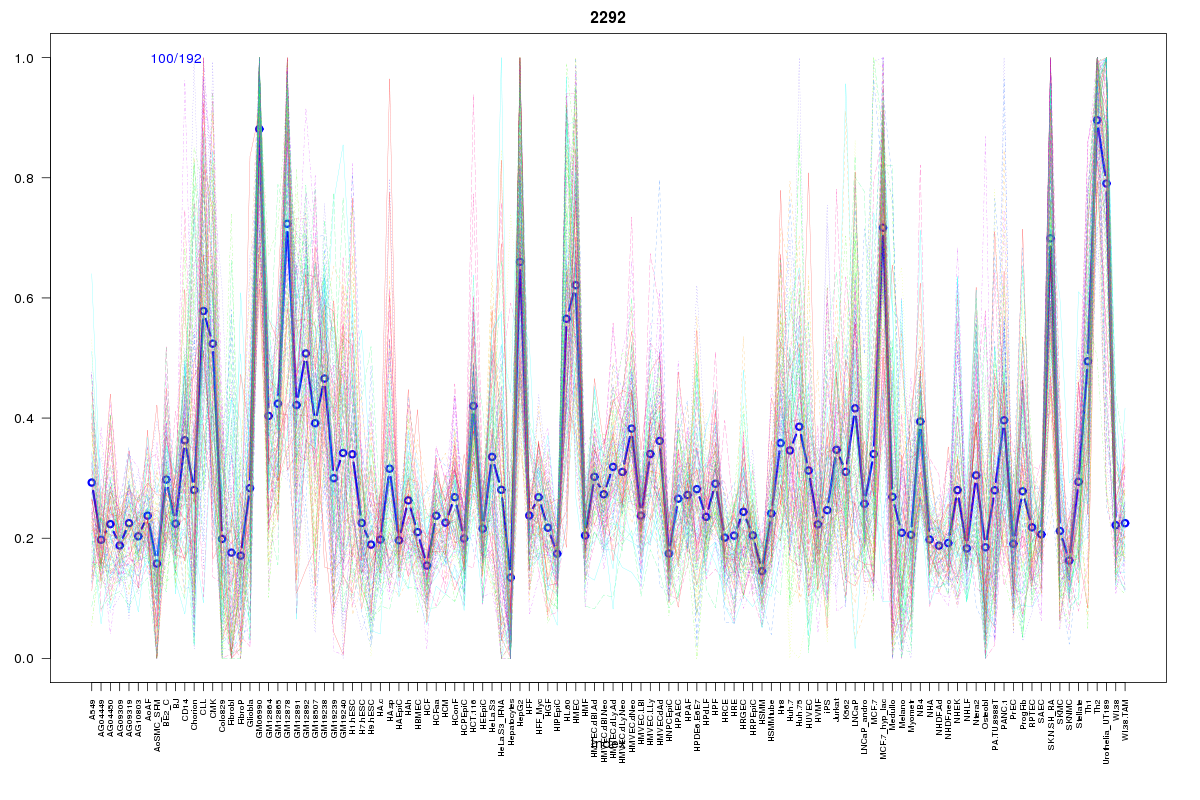 | 2292 | 1 |
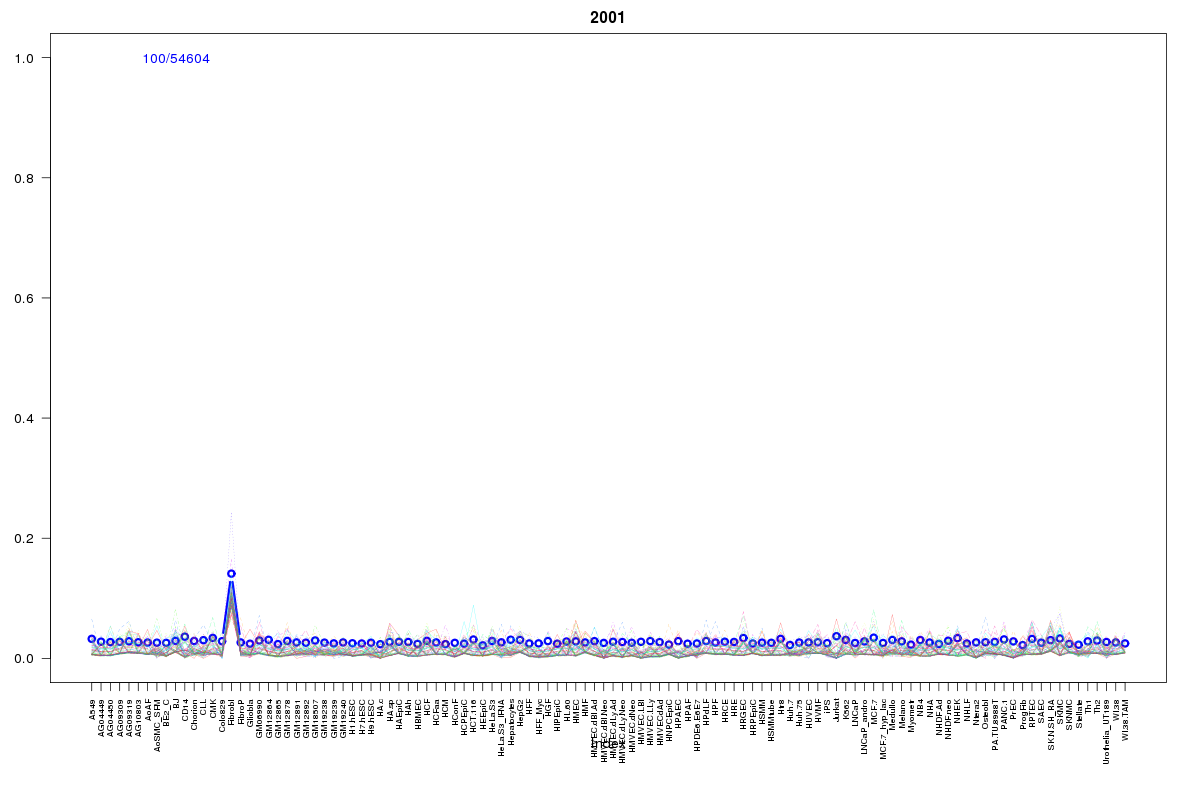 | 2001 | 1 |
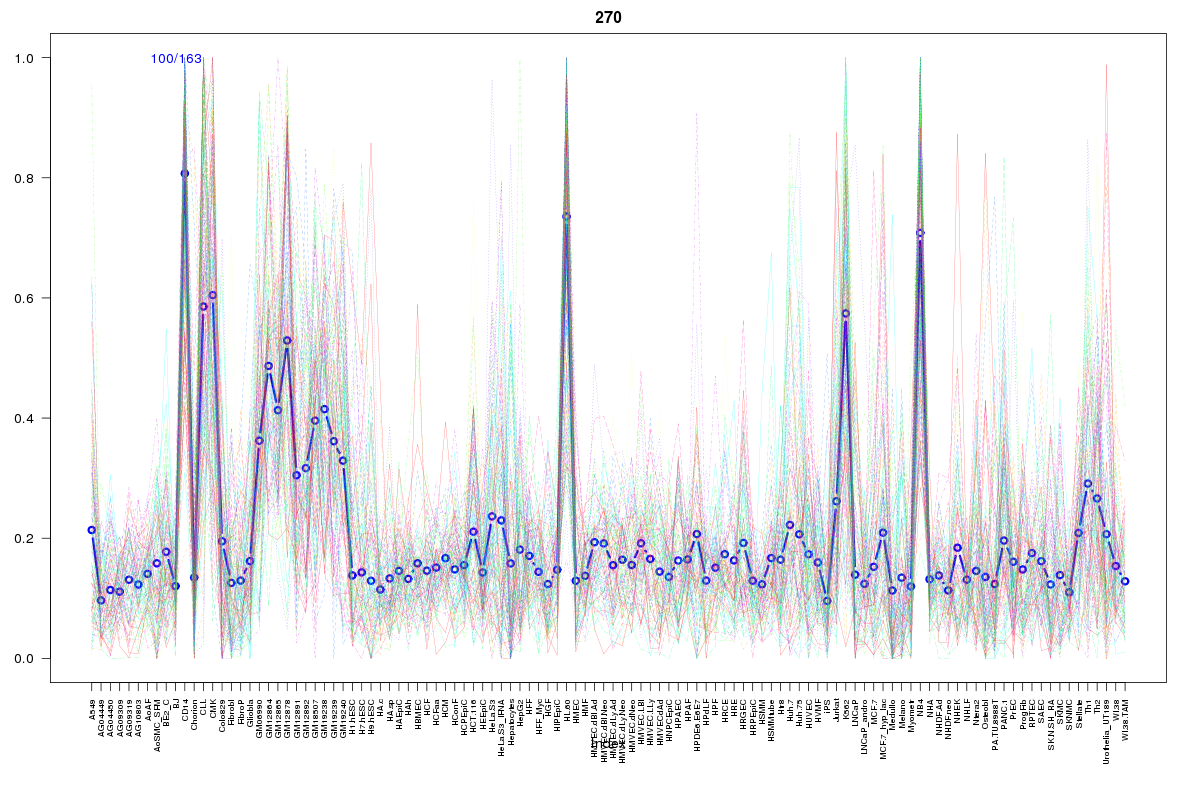 | 270 | 1 |
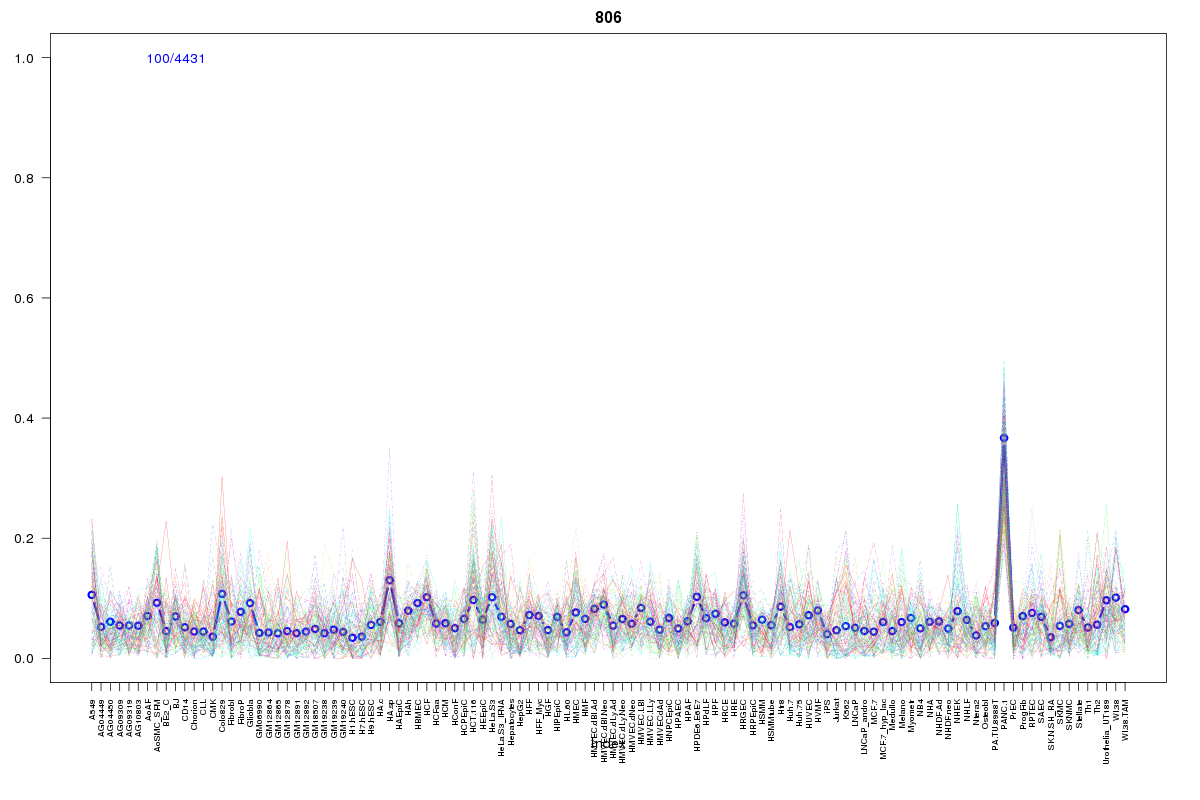 | 806 | 1 |
 | 1056 | 1 |
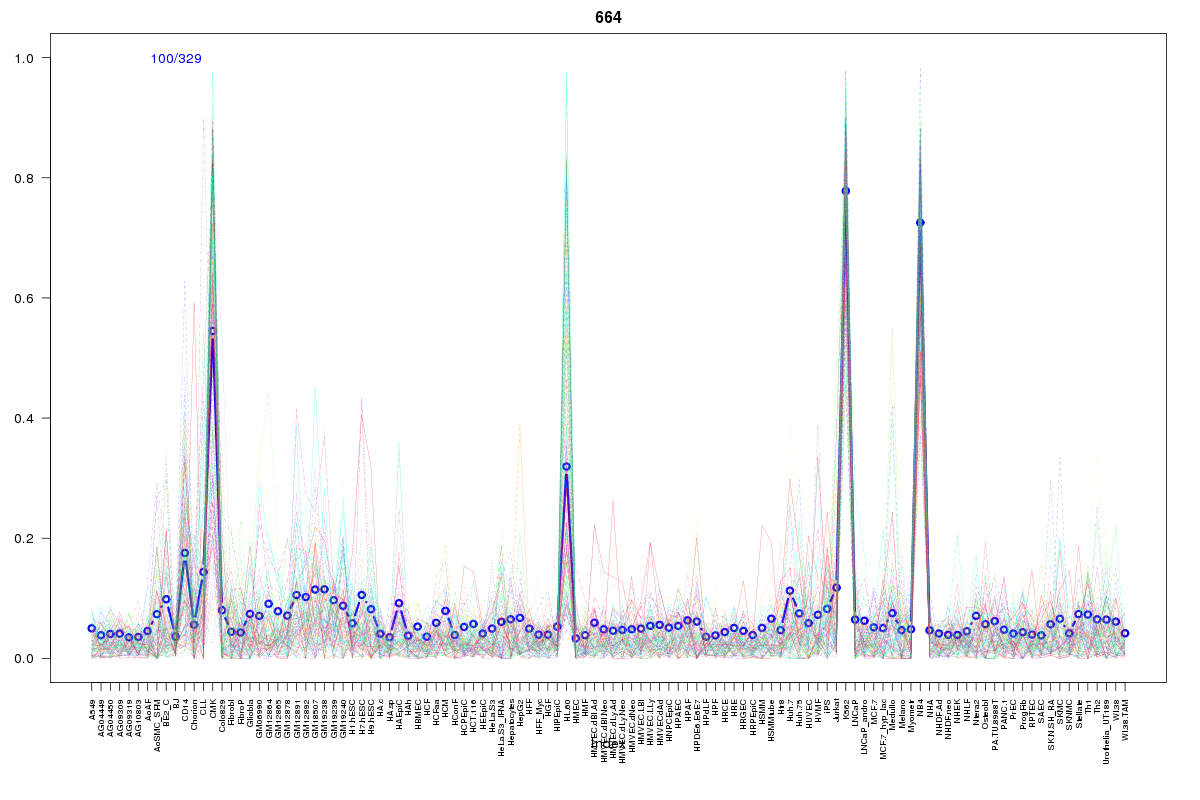 | 664 | 1 |
Resources
BED file downloads
Connects to 19 DHS sitesTop 10 Correlated DHS Sites
p-values indiciate significant higher or lower correlation| Location | Cluster | P-value |
|---|---|---|
| chr1:202938100-202938250 | 270 | 0.003 |
| chr1:203008785-203008935 | 1227 | 0.004 |
| chr1:202976200-202976350 | 2075 | 0.006 |
| chr1:202968680-202968830 | 1056 | 0.013 |
| chr1:202996005-202996155 | 1078 | 0.014 |
| chr1:202968305-202968455 | 806 | 0.015 |
| chr1:203053740-203053890 | 152 | 0.015 |
| chr1:202936600-202936750 | 2292 | 0.019 |
| chr1:202974900-202975050 | 664 | 0.024 |
| chr1:203027140-203027290 | 2370 | 0.022 |
| chr1:203019345-203019495 | 927 | 0.02 |
External Databases
UCSCEnsembl (ENSG00000163444)