Gene: GNL3
chr3: 52715171-52723121Expression Profile
(log scale)
Graphical Connections
Distribution of linked clusters:
You may find it interesting if many of the connected DHS sites belong to the same cluster.| Cluster Profile | Cluster ID | Number of DHS sites in this cluster |
|---|---|---|
 | 569 | 4 |
 | 2114 | 1 |
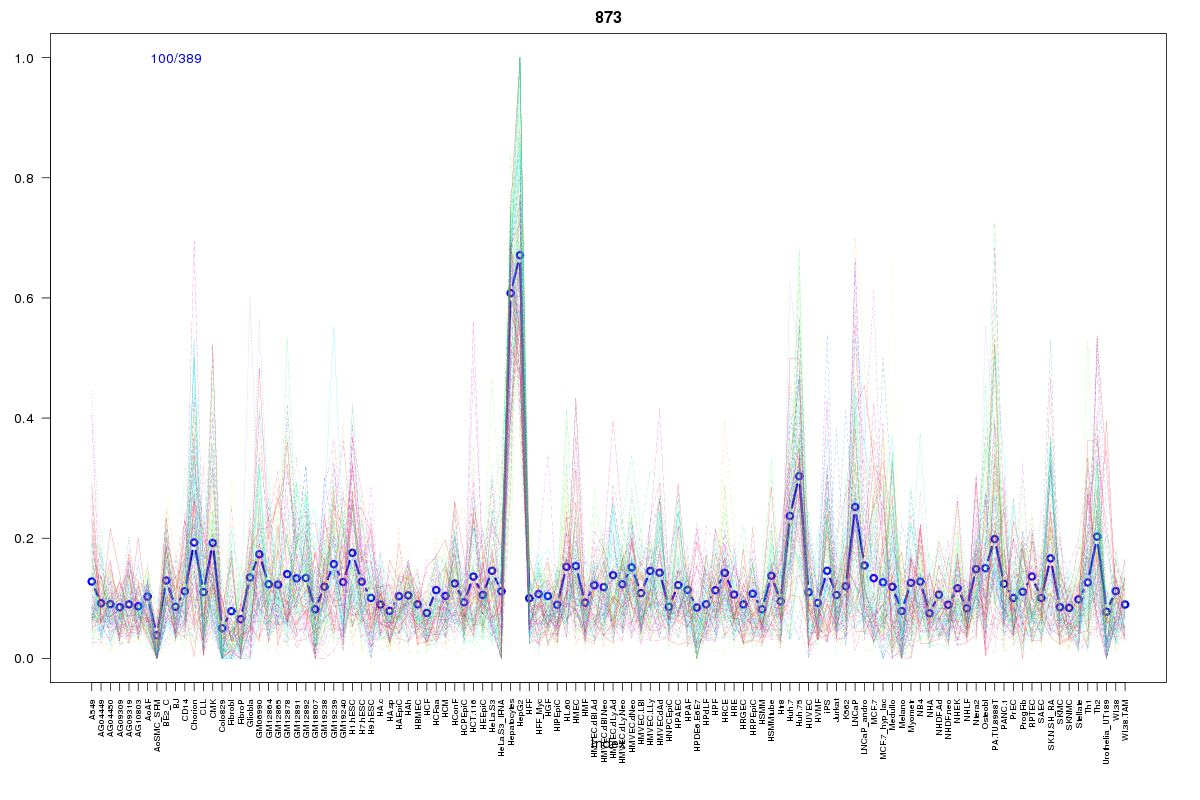 | 873 | 1 |
 | 629 | 1 |
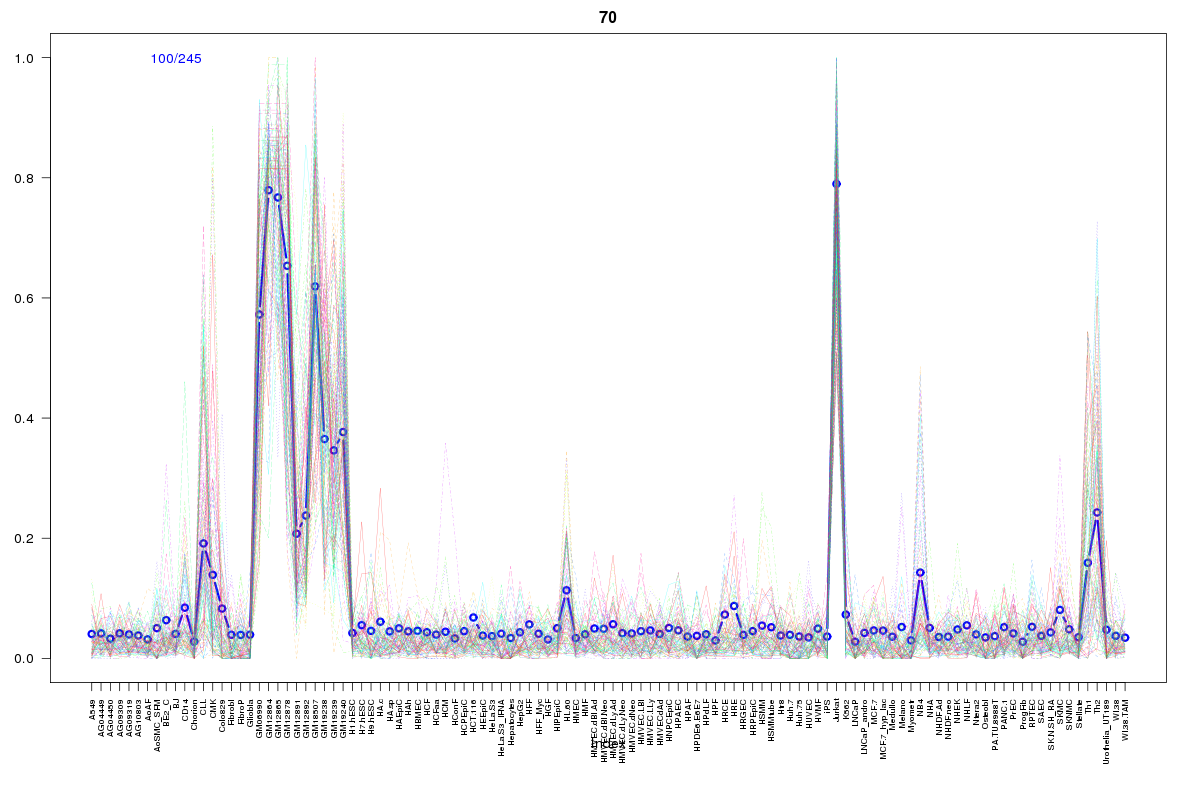 | 70 | 1 |
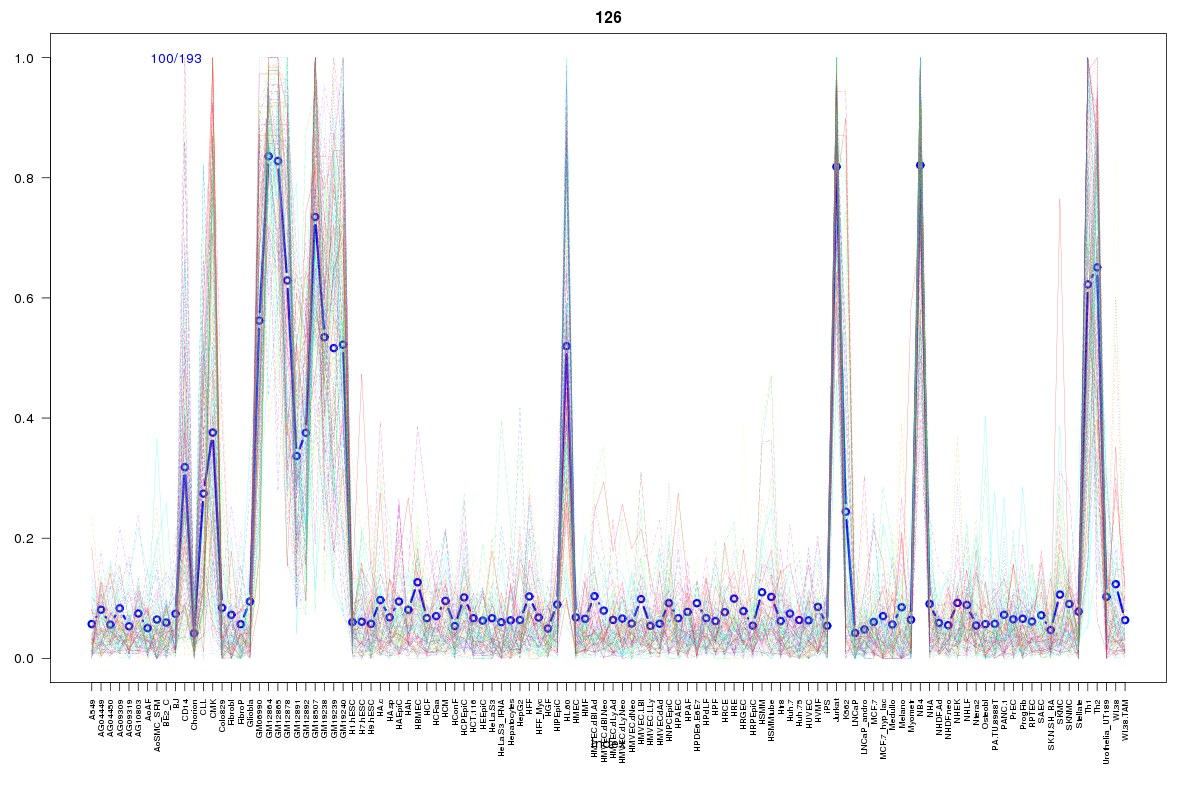 | 126 | 1 |
 | 430 | 1 |
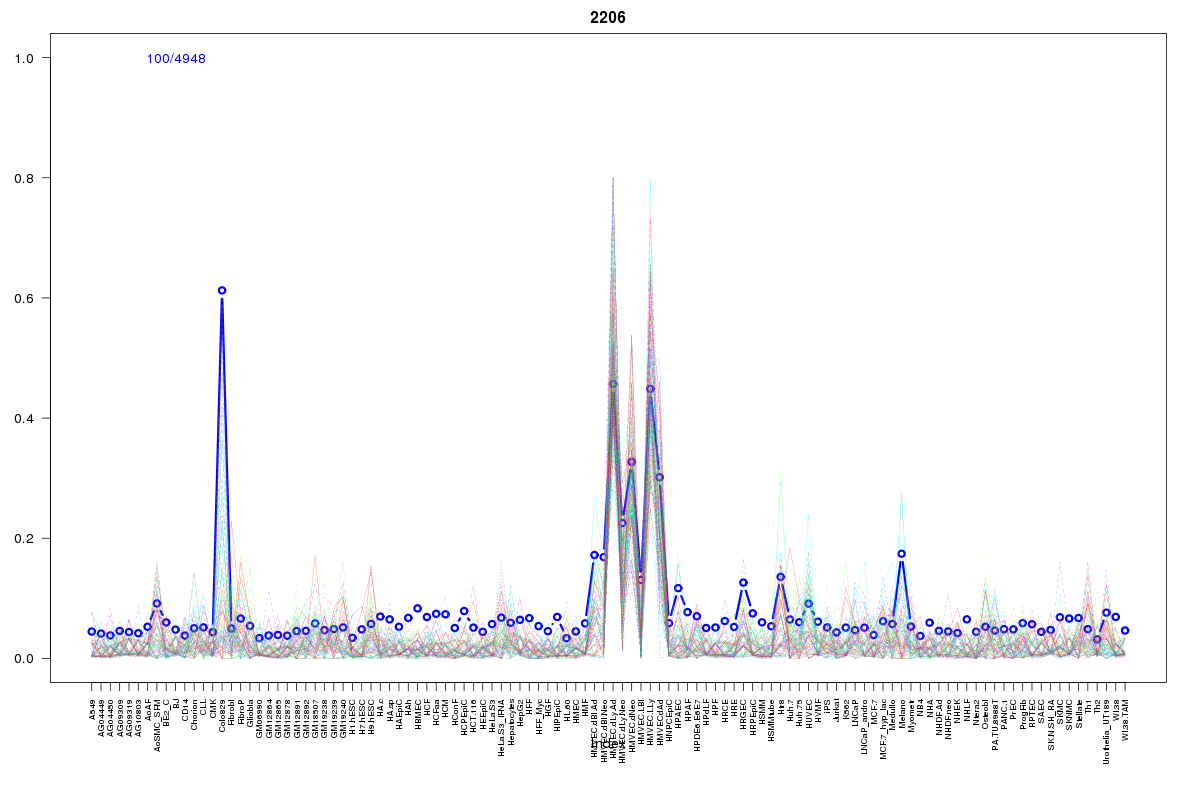 | 2206 | 1 |
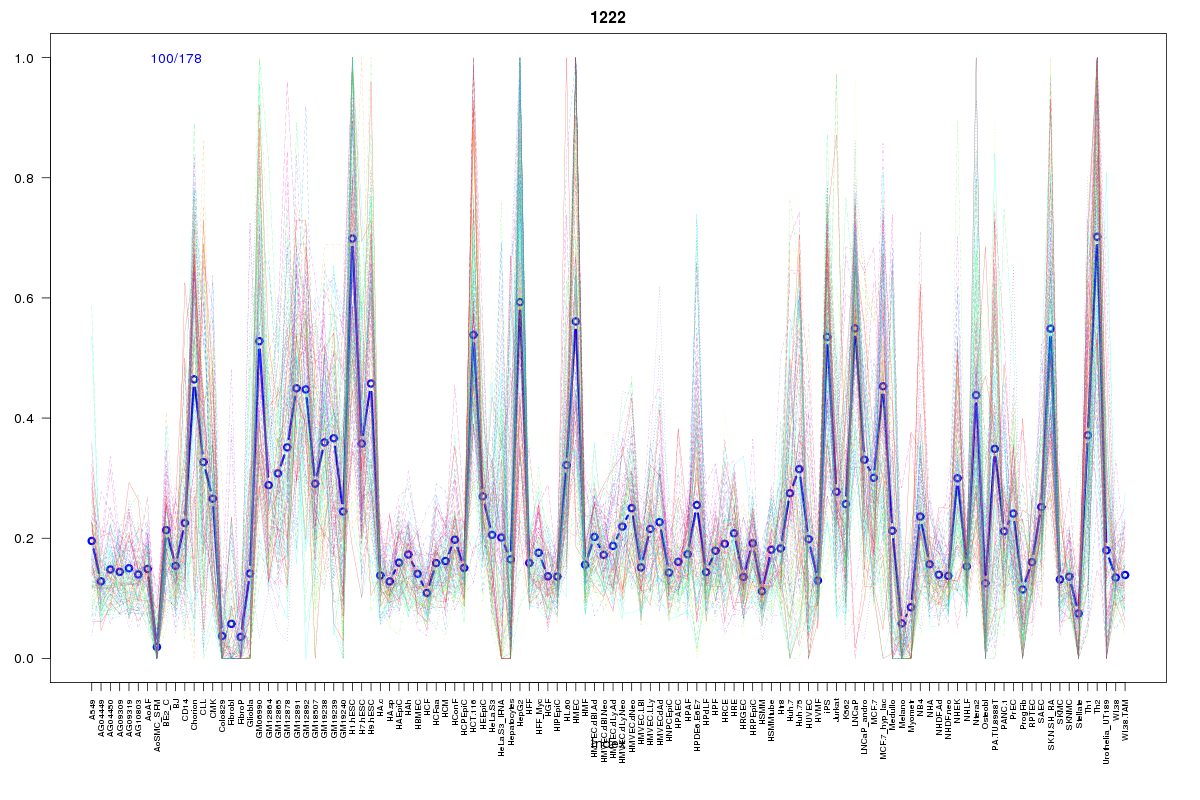 | 1222 | 1 |
 | 2052 | 1 |
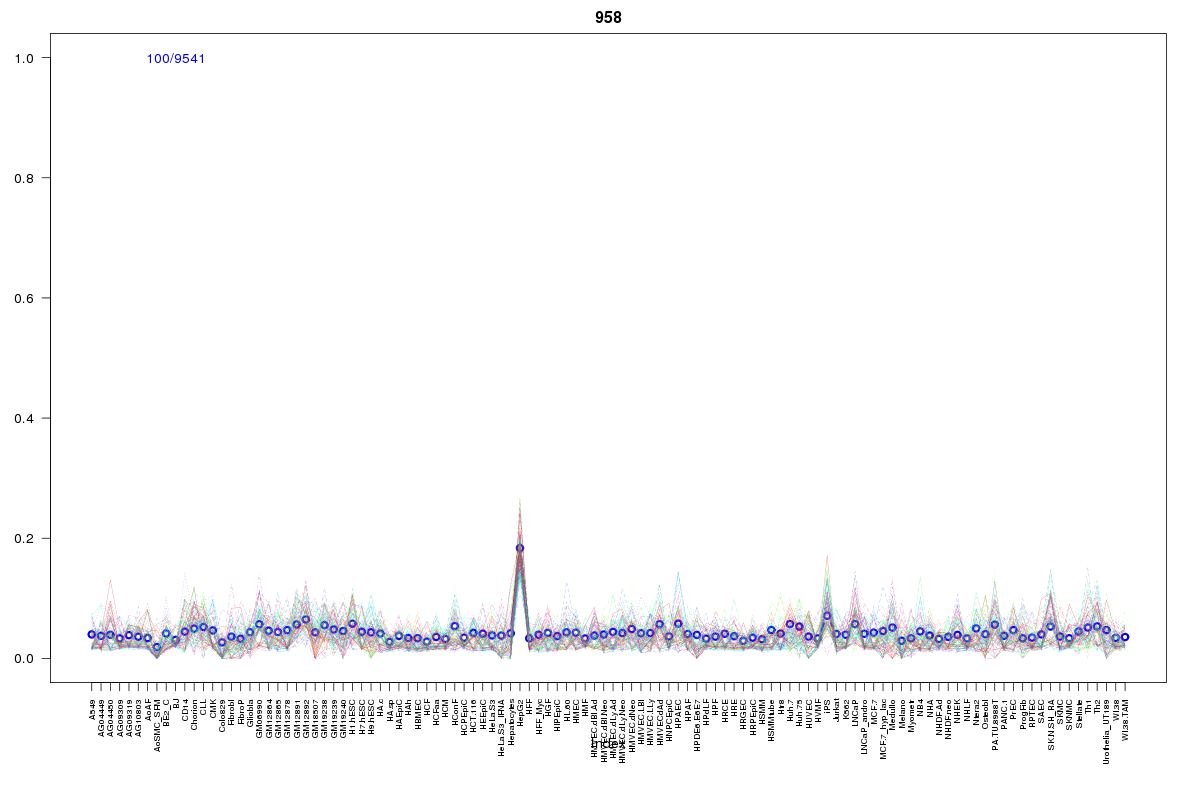 | 958 | 1 |
 | 615 | 1 |
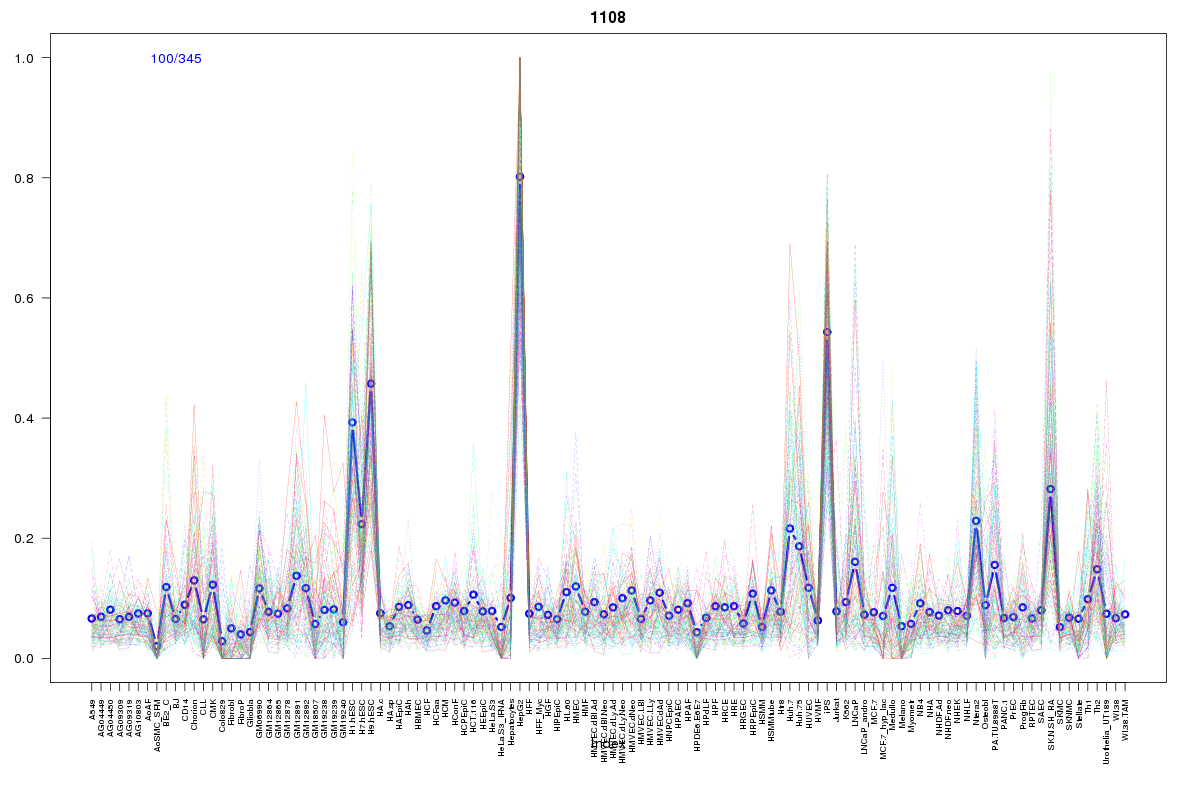 | 1108 | 1 |
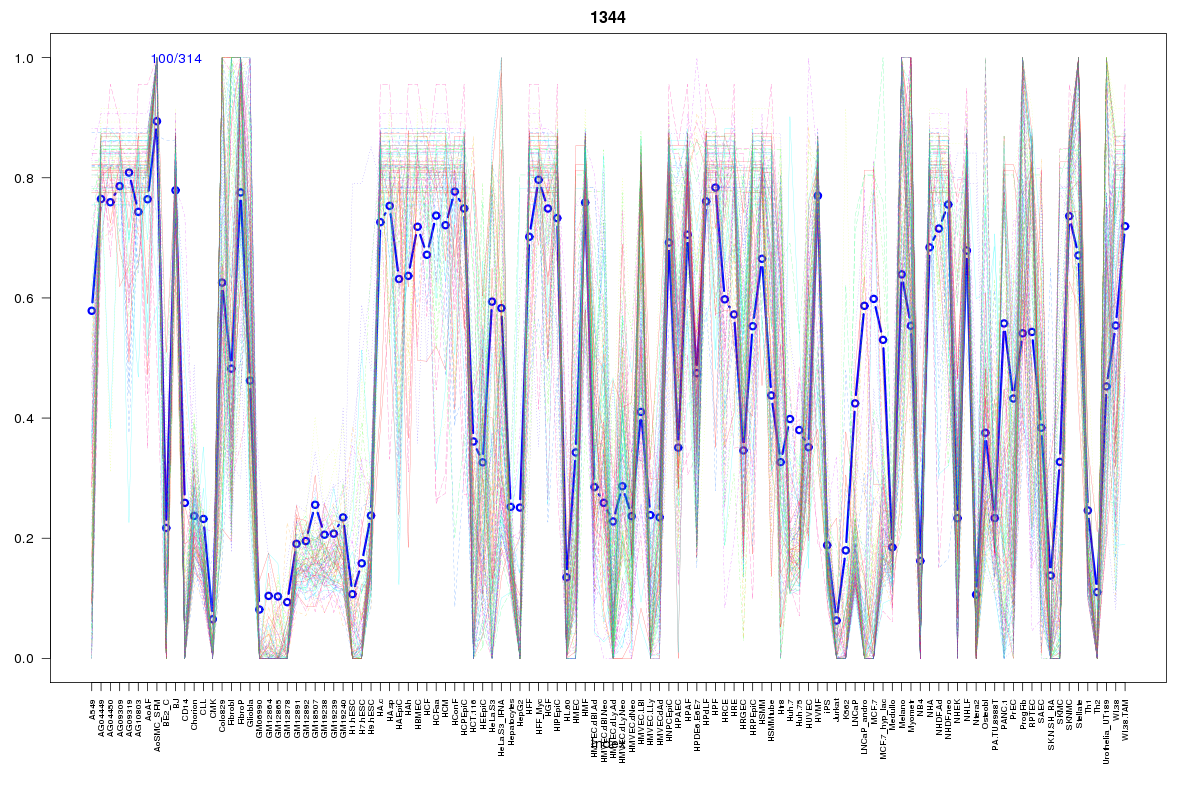 | 1344 | 1 |
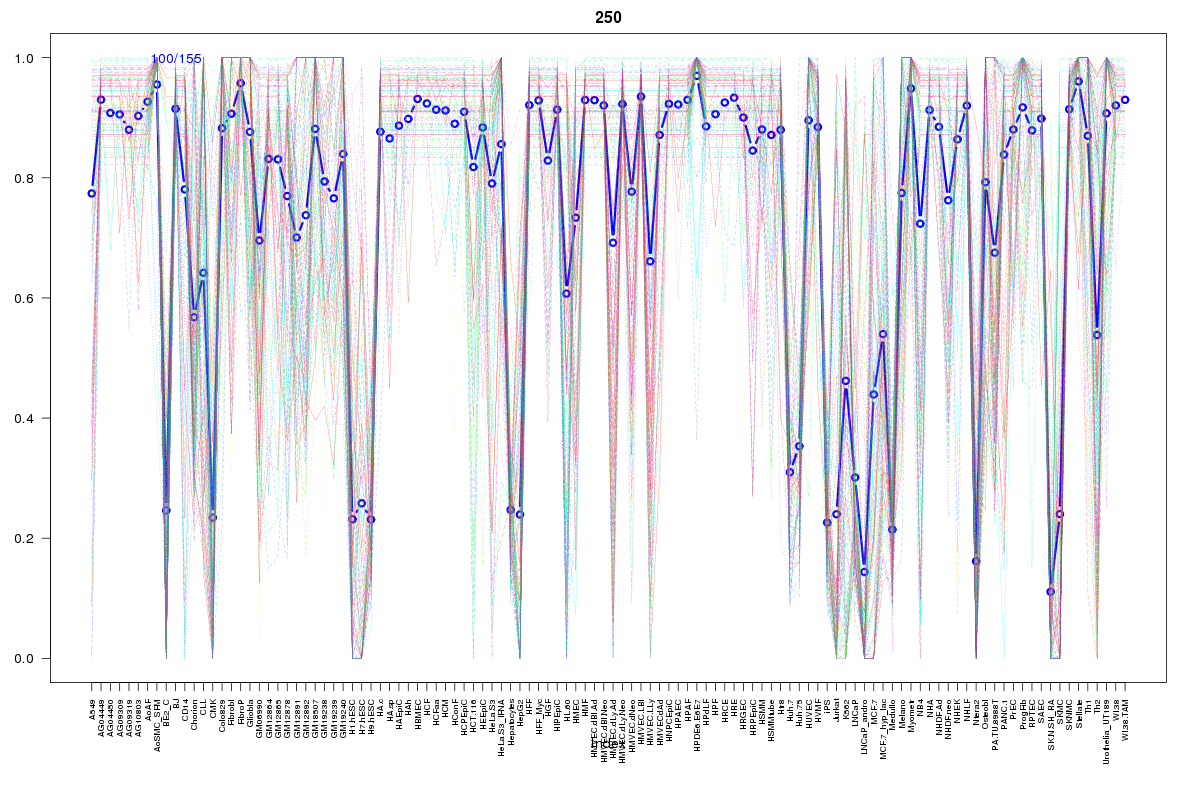 | 250 | 1 |
 | 15 | 1 |
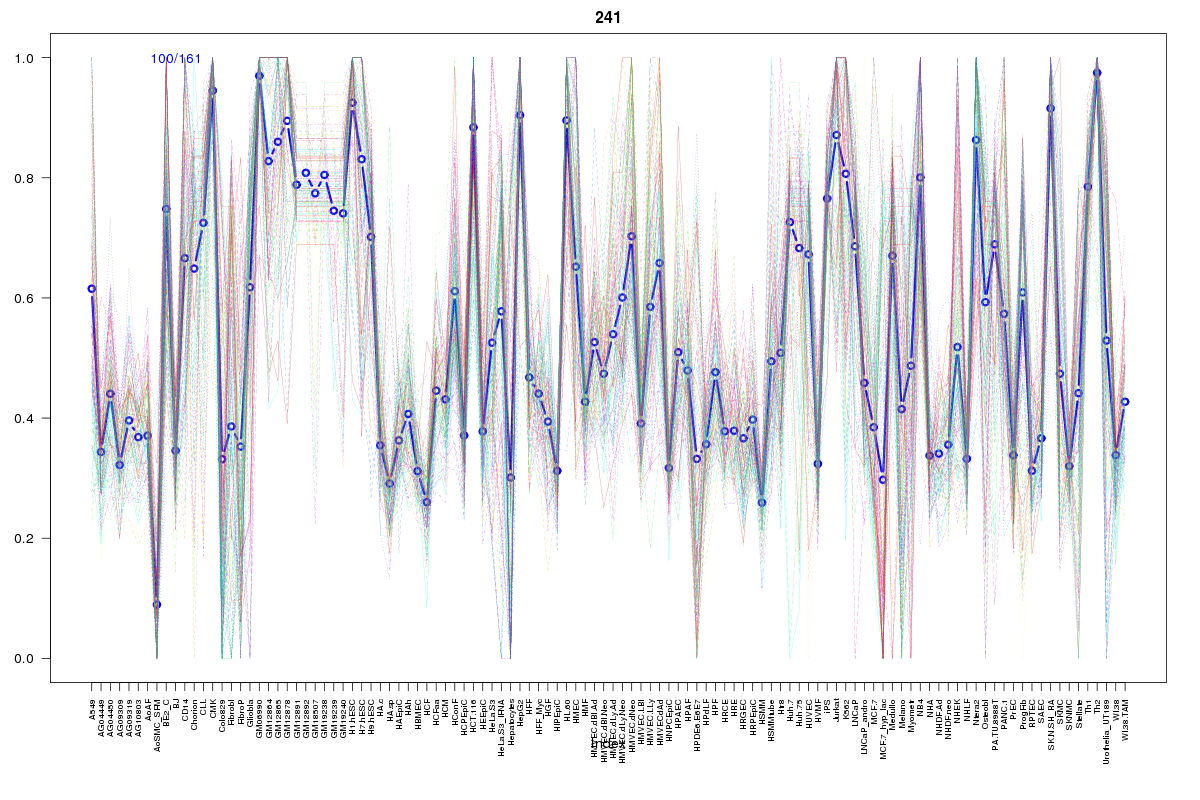 | 241 | 1 |
Resources
BED file downloads
Connects to 20 DHS sitesTop 10 Correlated DHS Sites
p-values indiciate significant higher or lower correlation| Location | Cluster | P-value |
|---|---|---|
| chr3:52755080-52755230 | 126 | 0.003 |
| chr3:52804600-52804750 | 1222 | 0.003 |
| chr3:52715085-52715235 | 15 | 0.003 |
| chr3:52719500-52719650 | 241 | 0.003 |
| chr3:52739145-52739295 | 629 | 0.005 |
| chr3:52688160-52688310 | 615 | 0.008 |
| chr3:52741680-52741830 | 70 | 0.009 |
| chr3:52722000-52722150 | 2114 | 0.009 |
| chr3:52731240-52731390 | 569 | 0.01 |
| chr3:52824860-52825010 | 958 | 0.012 |
| chr3:52723960-52724110 | 569 | 0.015 |
External Databases
UCSCEnsembl (ENSG00000163938)