Gene: GHITM
chr10: 85899195-85913001Expression Profile
(log scale)
Graphical Connections
Distribution of linked clusters:
You may find it interesting if many of the connected DHS sites belong to the same cluster.| Cluster Profile | Cluster ID | Number of DHS sites in this cluster |
|---|---|---|
 | 1659 | 1 |
 | 2114 | 1 |
 | 1056 | 1 |
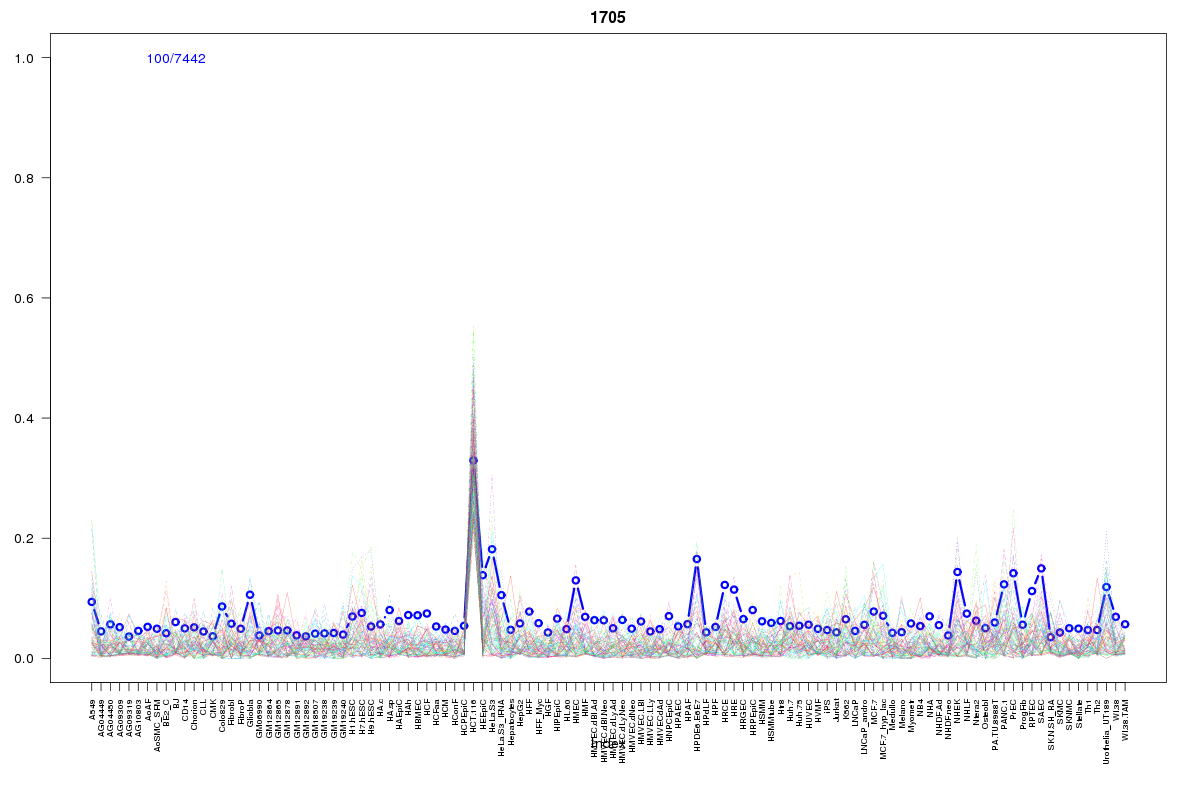 | 1705 | 1 |
 | 615 | 1 |
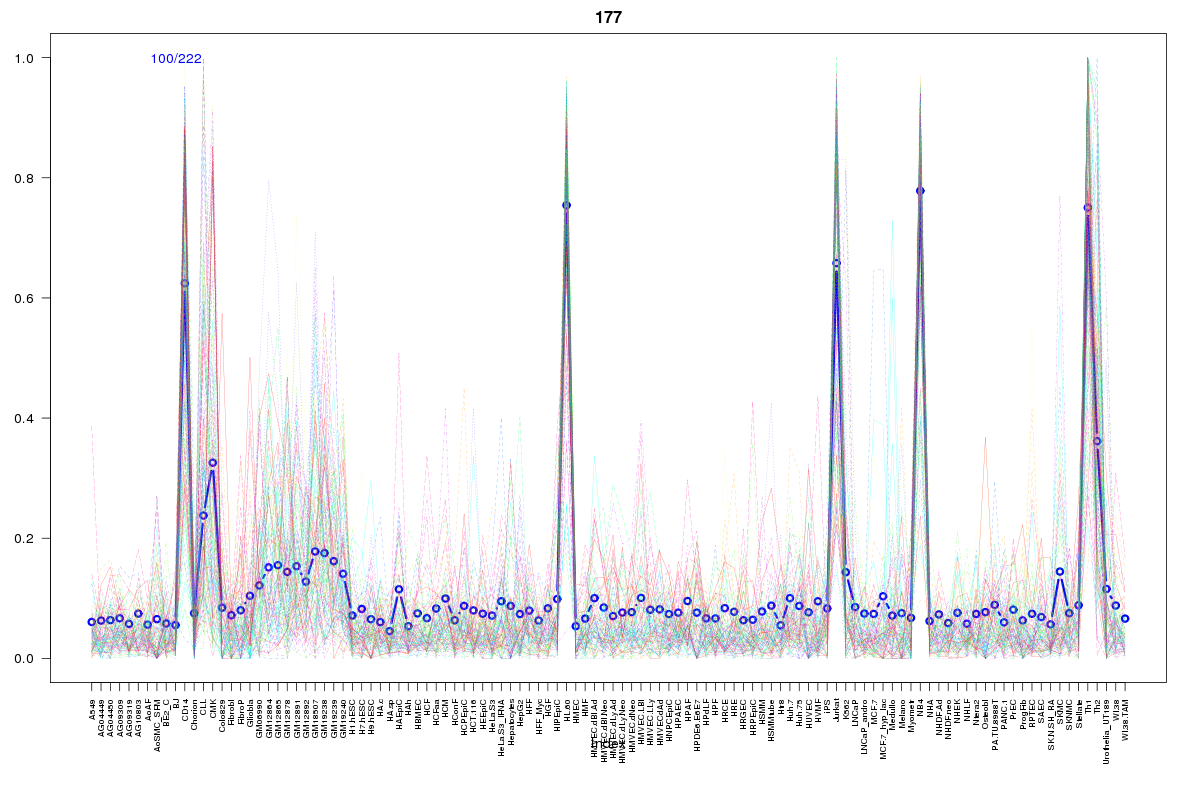 | 177 | 1 |
 | 862 | 1 |
 | 2211 | 1 |
 | 2055 | 1 |
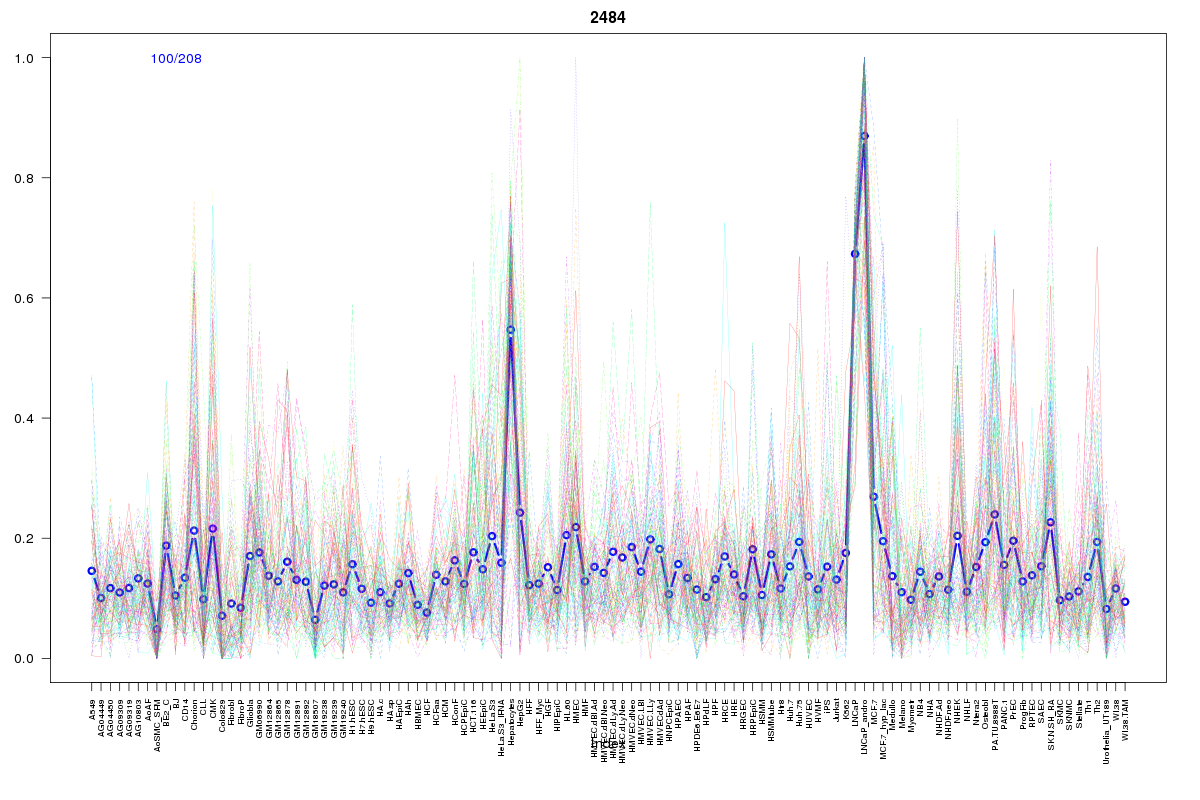 | 2484 | 1 |
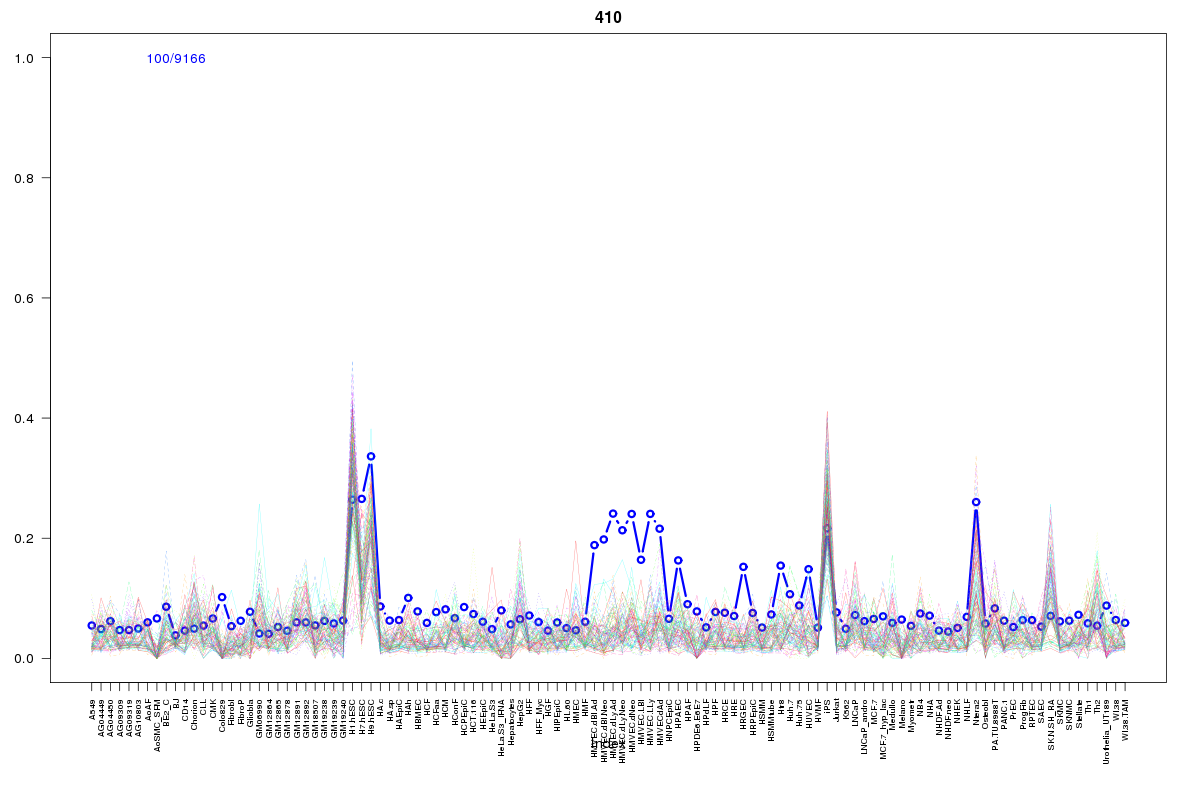 | 410 | 1 |
Resources
BED file downloads
Connects to 11 DHS sitesTop 10 Correlated DHS Sites
p-values indiciate significant higher or lower correlation| Location | Cluster | P-value |
|---|---|---|
| chr10:85915880-85916030 | 615 | 0.005 |
| chr10:85900260-85900410 | 1705 | 0.006 |
| chr10:85878500-85878650 | 1659 | 0.011 |
| chr10:85916640-85916790 | 177 | 0.011 |
| chr10:85955980-85956130 | 2484 | 0.012 |
| chr10:85917940-85918090 | 862 | 0.013 |
| chr10:85899720-85899870 | 1056 | 0.015 |
| chr10:85895900-85896050 | 2114 | 0.021 |
| chr10:85937385-85937535 | 2211 | 0.021 |
| chr10:85942385-85942535 | 2055 | 0.016 |
| chr10:85997345-85997495 | 410 | 0.016 |
External Databases
UCSCEnsembl (ENSG00000165678)