Gene: SPATA3
chr2: 231860835-231871999Expression Profile
(log scale)
Graphical Connections
Distribution of linked clusters:
You may find it interesting if many of the connected DHS sites belong to the same cluster.| Cluster Profile | Cluster ID | Number of DHS sites in this cluster |
|---|---|---|
 | 2055 | 2 |
 | 130 | 1 |
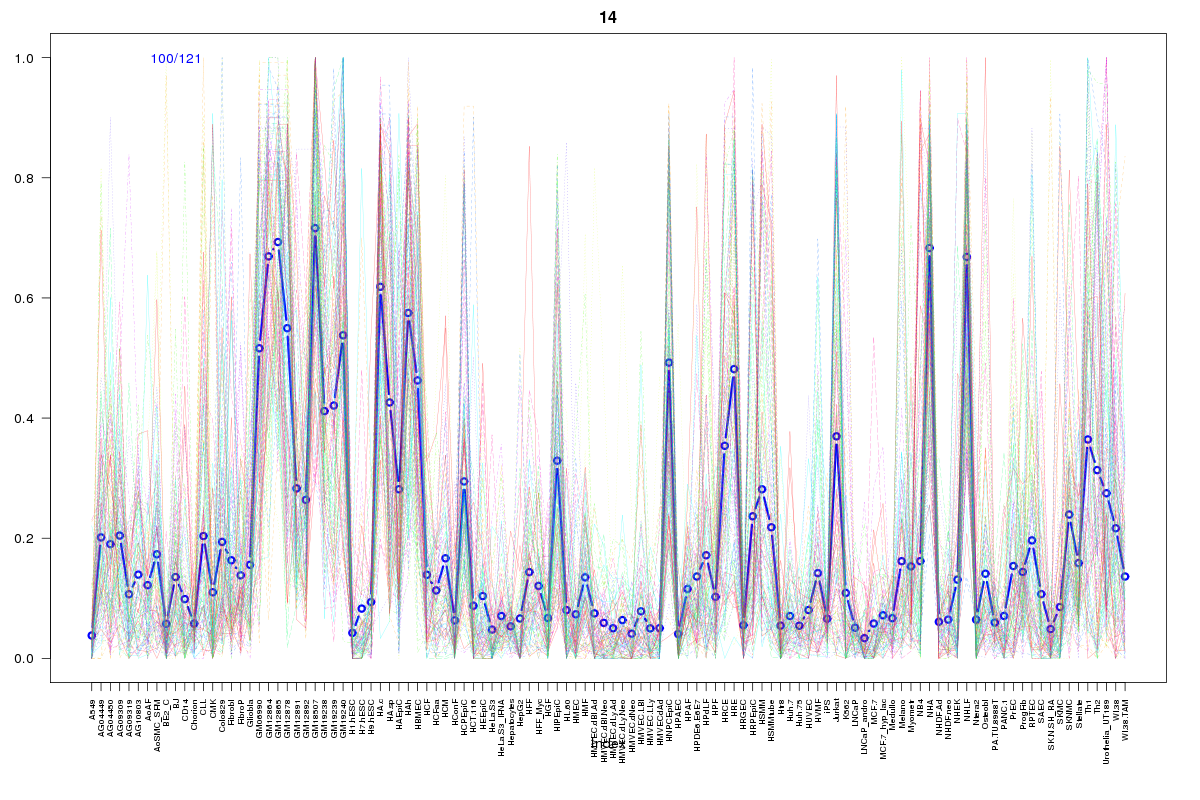 | 14 | 1 |
 | 1605 | 1 |
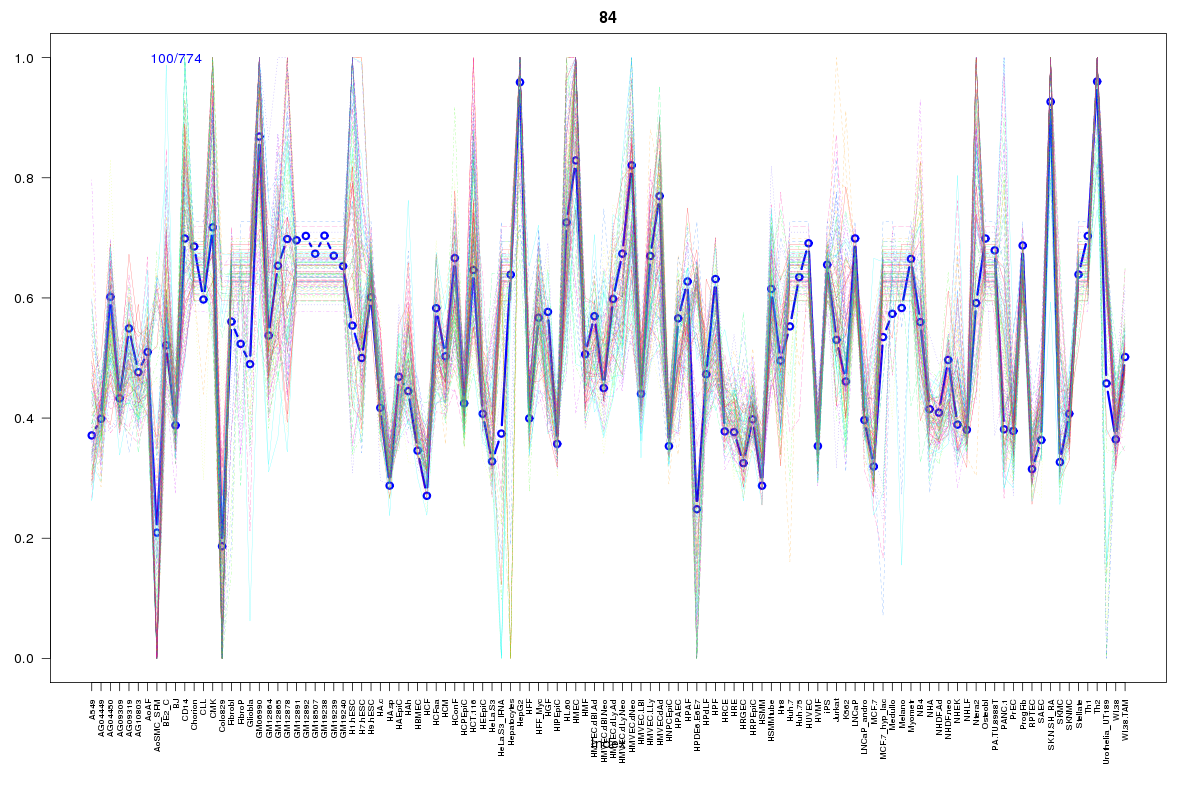 | 84 | 1 |
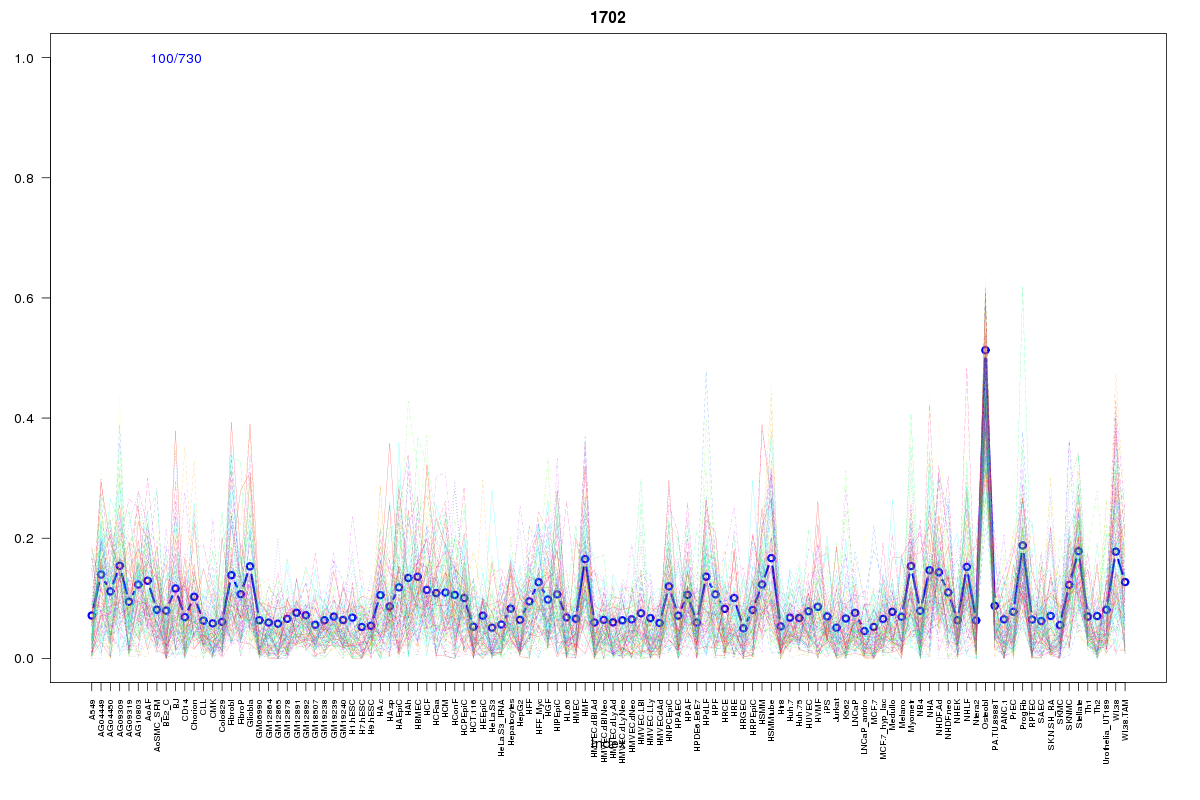 | 1702 | 1 |
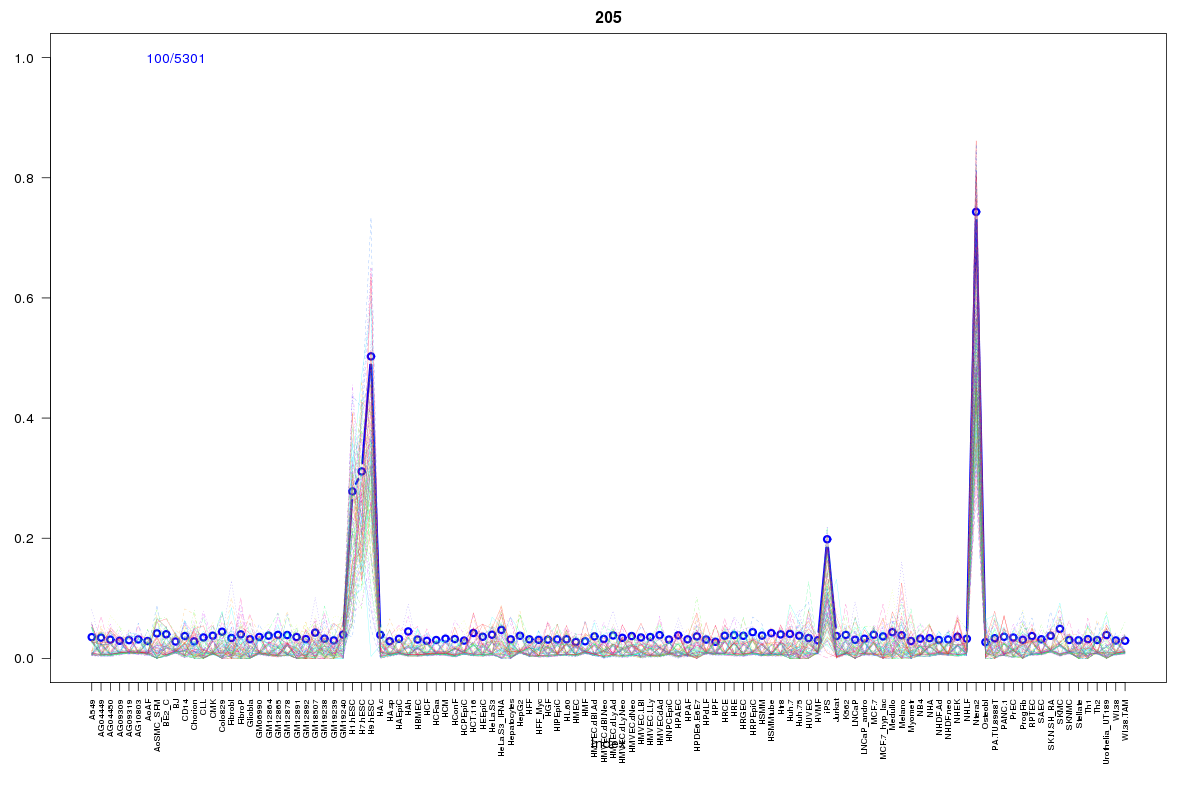 | 205 | 1 |
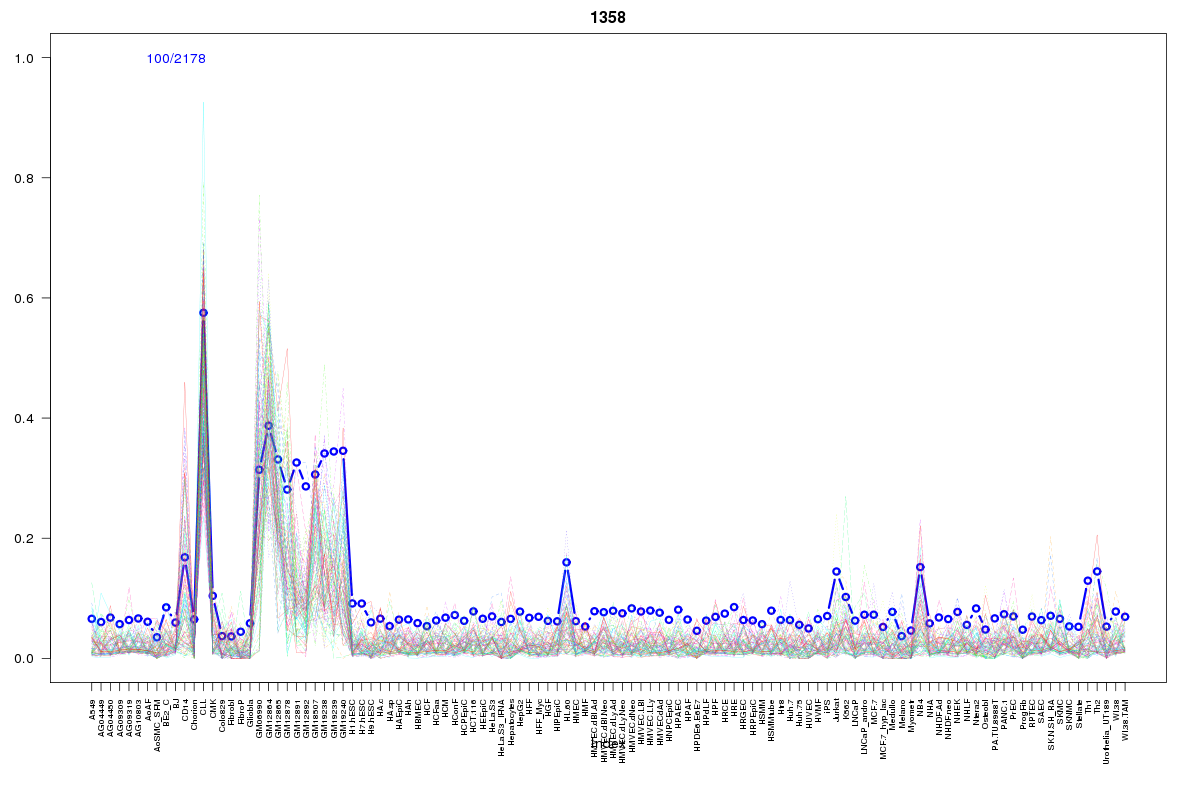 | 1358 | 1 |
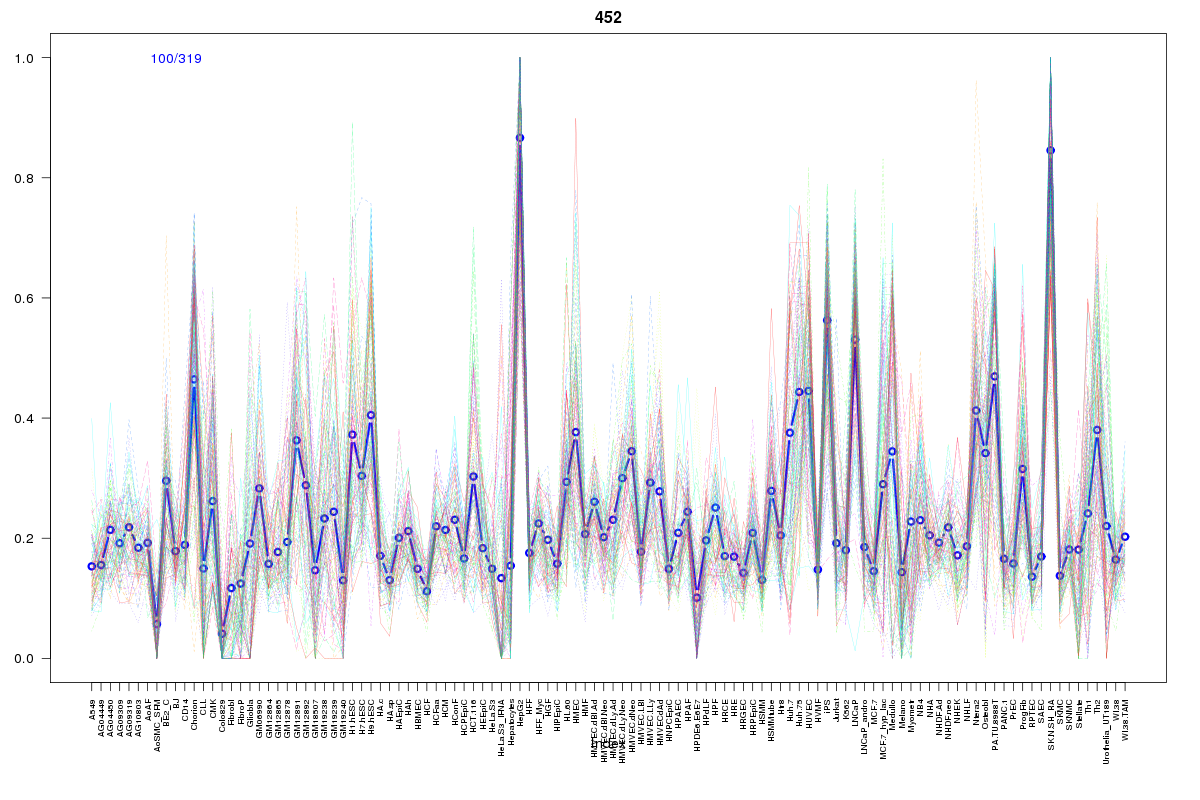 | 452 | 1 |
 | 1230 | 1 |
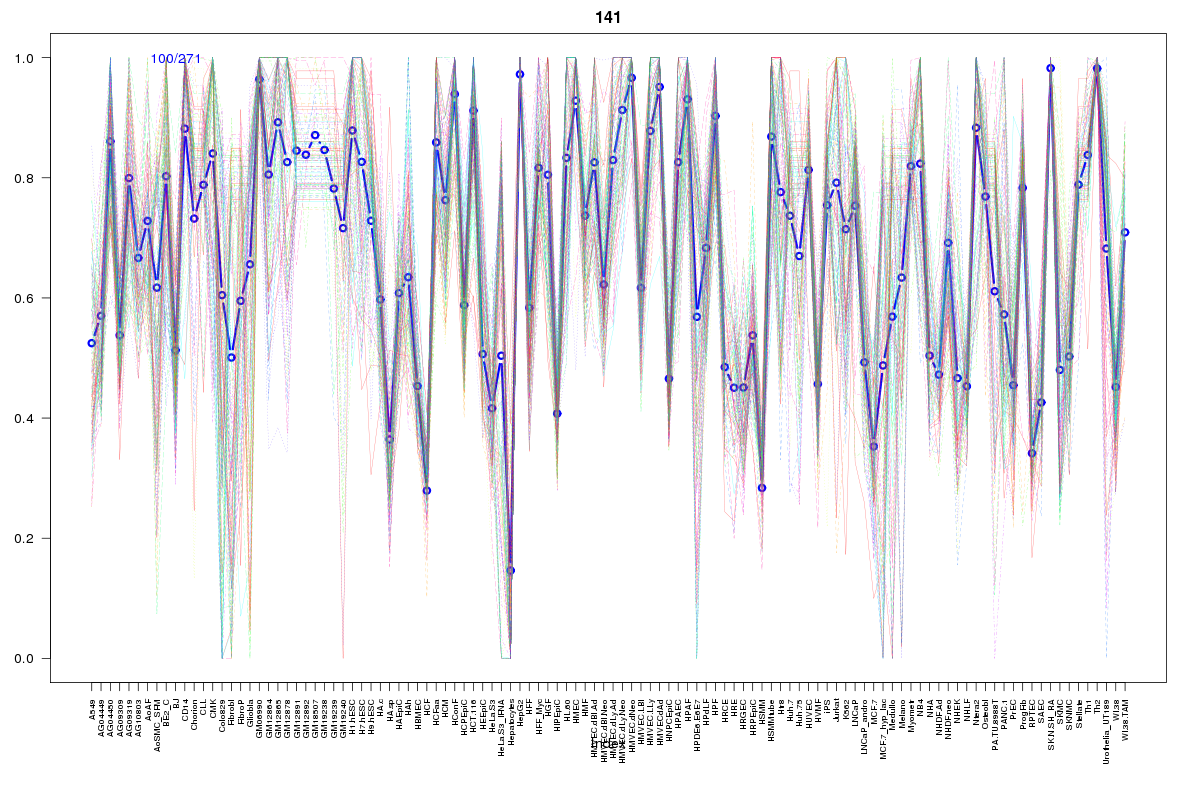 | 141 | 1 |
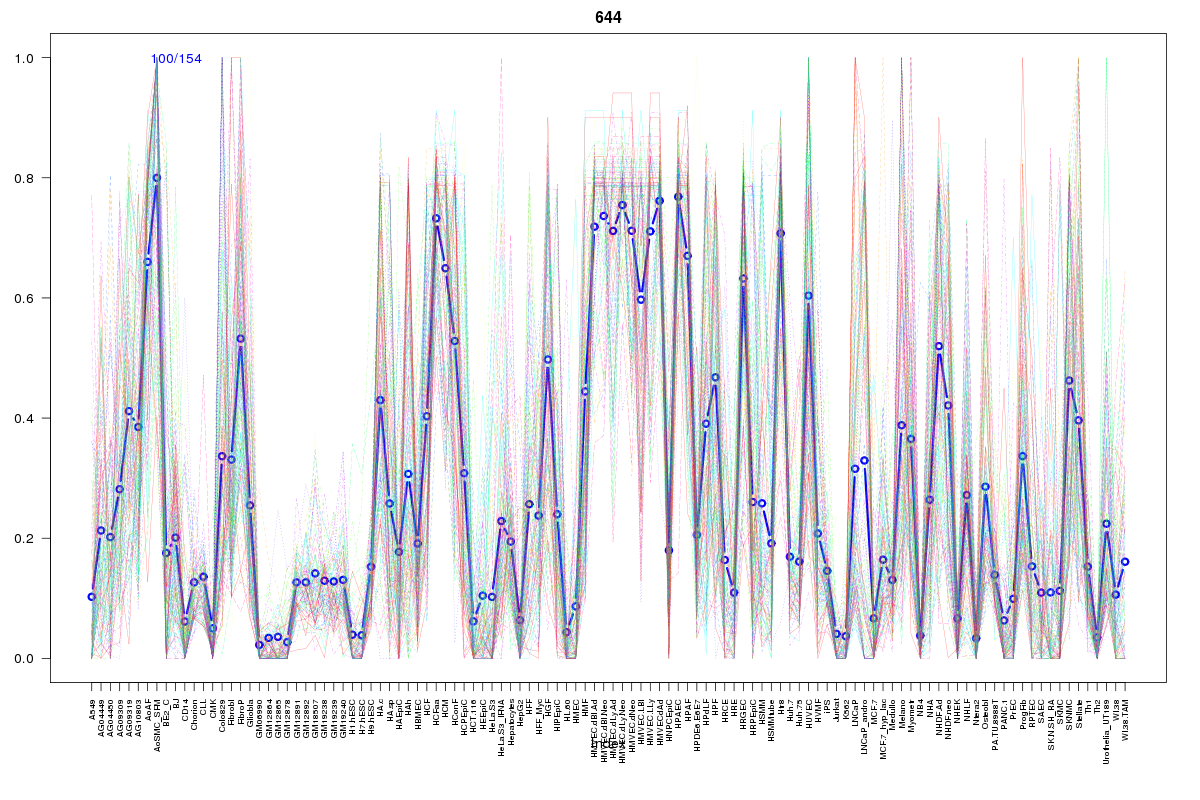 | 644 | 1 |
 | 15 | 1 |
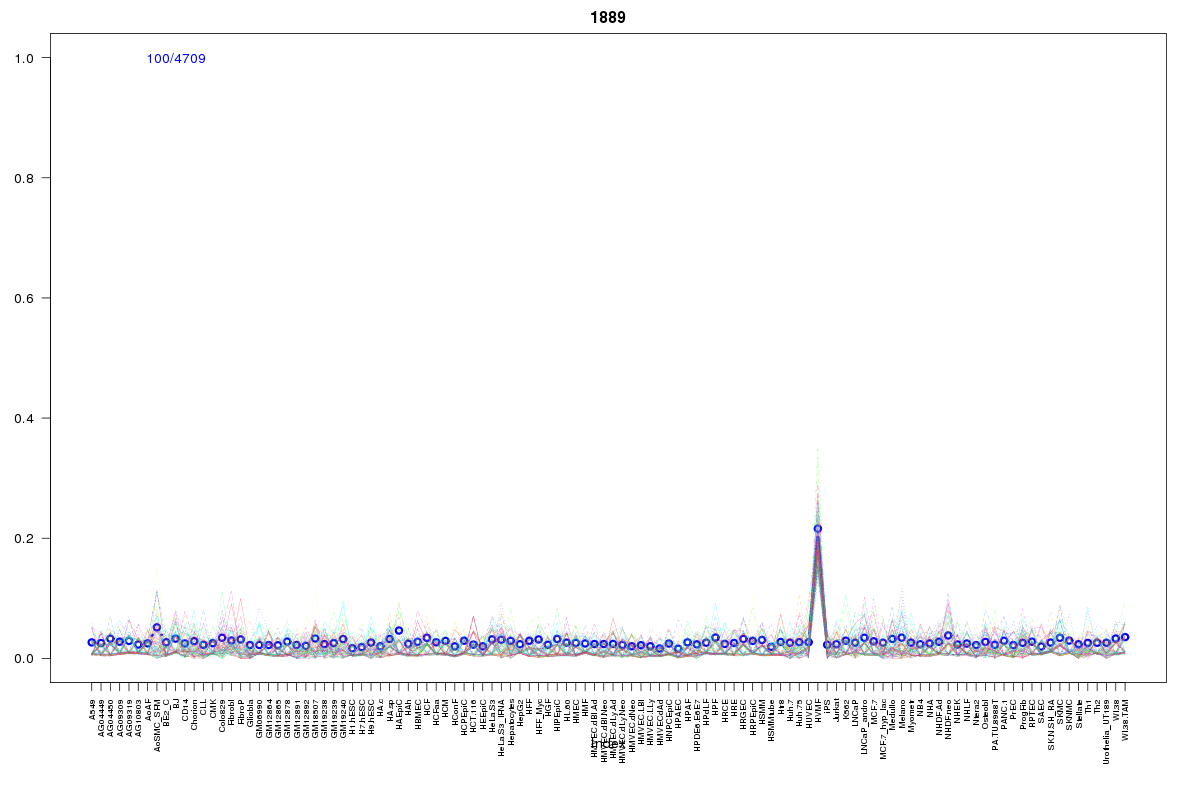 | 1889 | 1 |
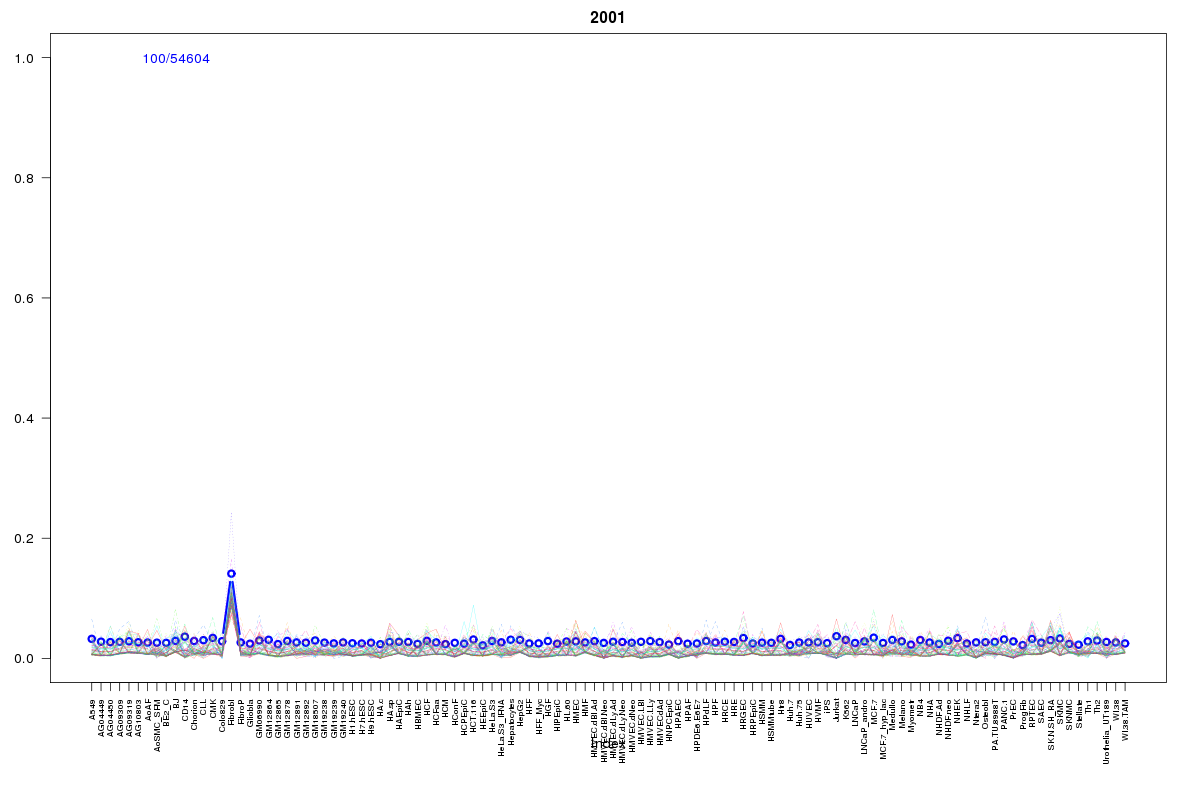 | 2001 | 1 |
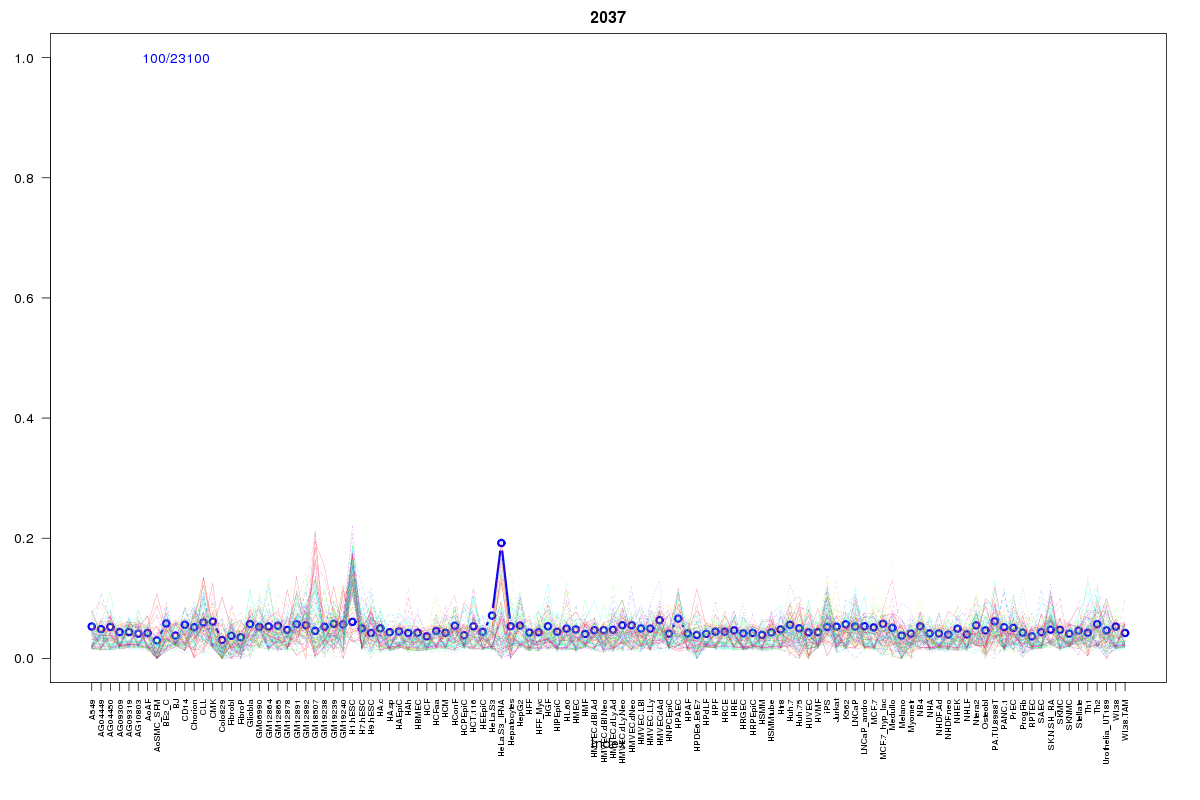 | 2037 | 1 |
 | 860 | 1 |
Resources
BED file downloads
Connects to 18 DHS sitesTop 10 Correlated DHS Sites
p-values indiciate significant higher or lower correlation| Location | Cluster | P-value |
|---|---|---|
| chr2:231839180-231839330 | 14 | 0.005 |
| chr2:231981220-231981370 | 1889 | 0.011 |
| chr2:231799105-231799255 | 2037 | 0.012 |
| chr2:231839020-231839170 | 130 | 0.012 |
| chr2:231779465-231779615 | 15 | 0.02 |
| chr2:231804205-231804355 | 860 | 0.02 |
| chr2:231803485-231803635 | 2055 | 0.02 |
| chr2:231806805-231806955 | 2055 | 0.022 |
| chr2:231866945-231867095 | 1702 | 0.022 |
| chr2:231899460-231899610 | 1358 | 0.022 |
| chr2:231786005-231786155 | 2001 | 0.023 |
External Databases
UCSCEnsembl (ENSG00000173699)