Gene: PHLDA3
chr1: 201434619-201438312Expression Profile
(log scale)
Graphical Connections
Distribution of linked clusters:
You may find it interesting if many of the connected DHS sites belong to the same cluster.| Cluster Profile | Cluster ID | Number of DHS sites in this cluster |
|---|---|---|
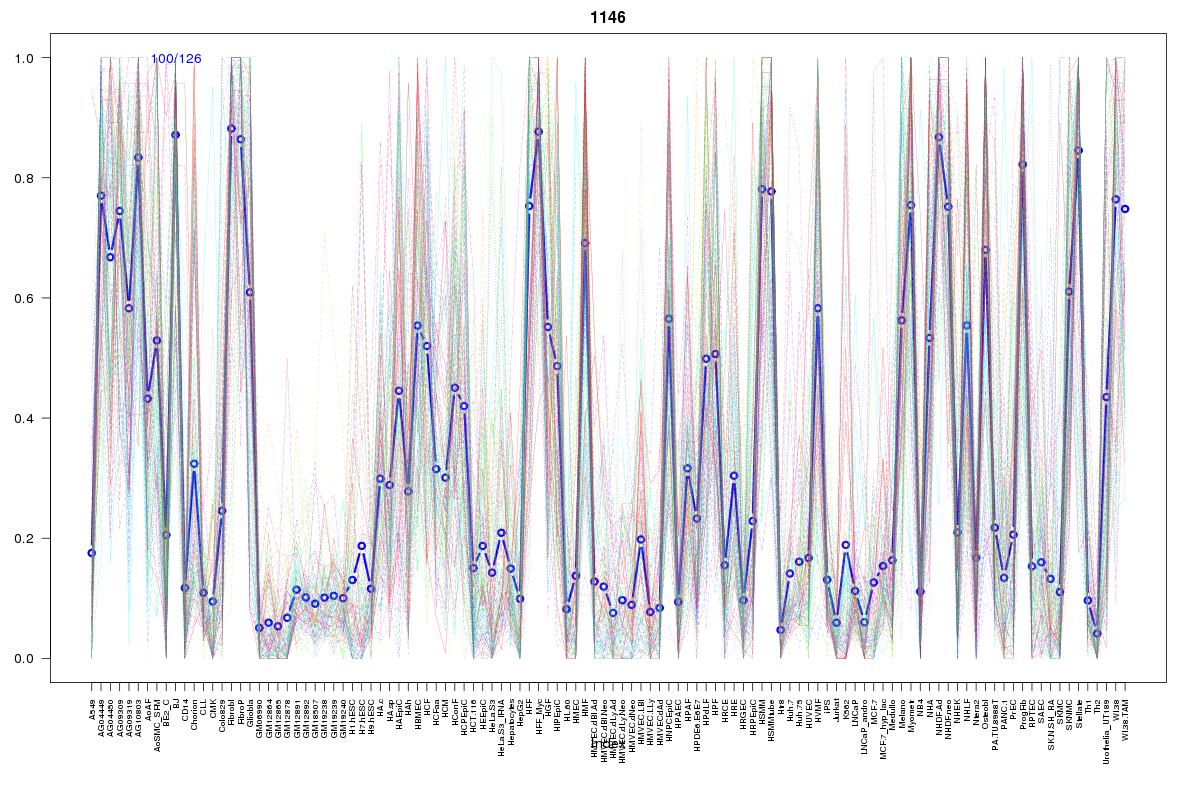 | 1146 | 2 |
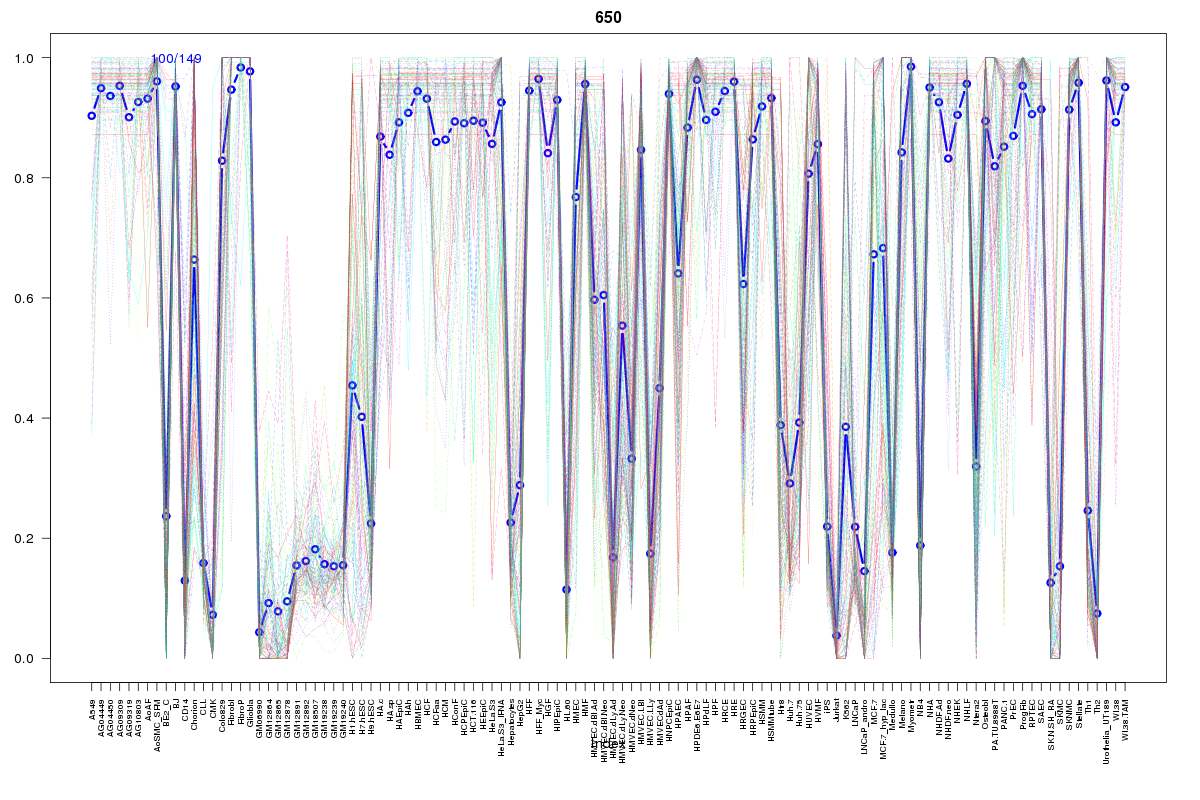 | 650 | 2 |
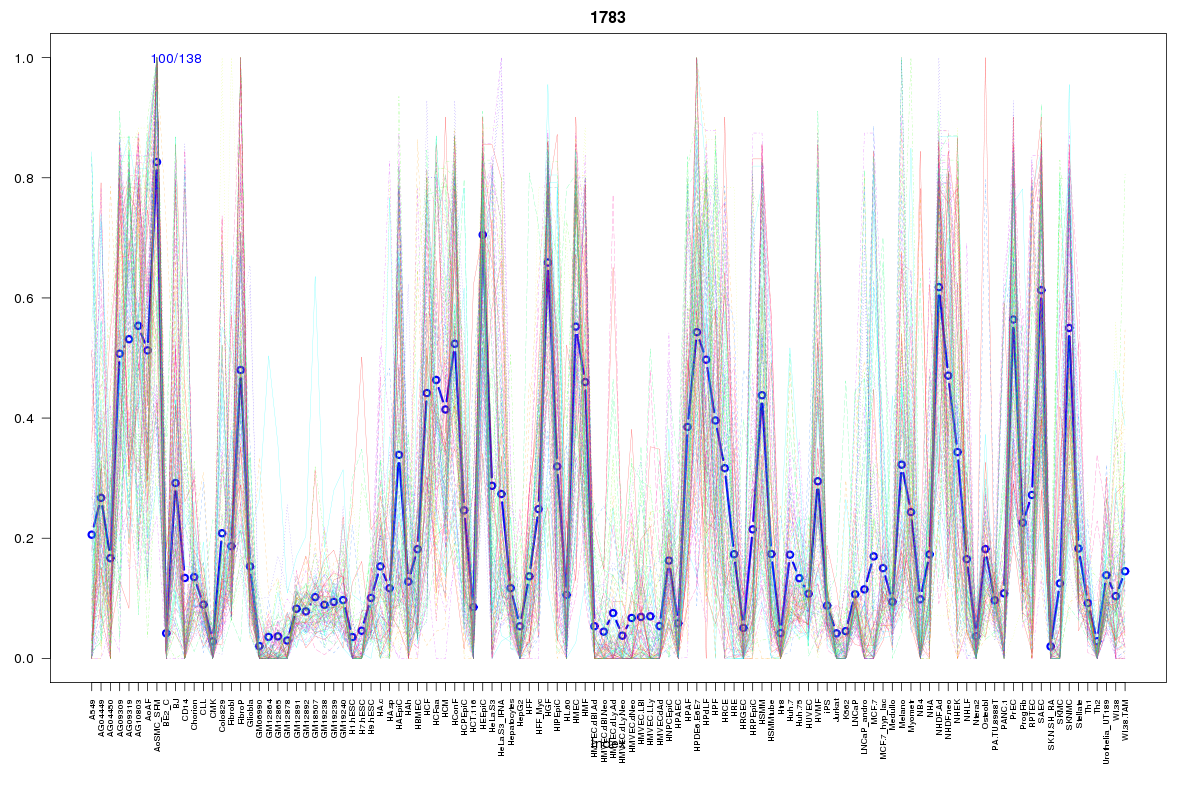 | 1783 | 1 |
 | 2401 | 1 |
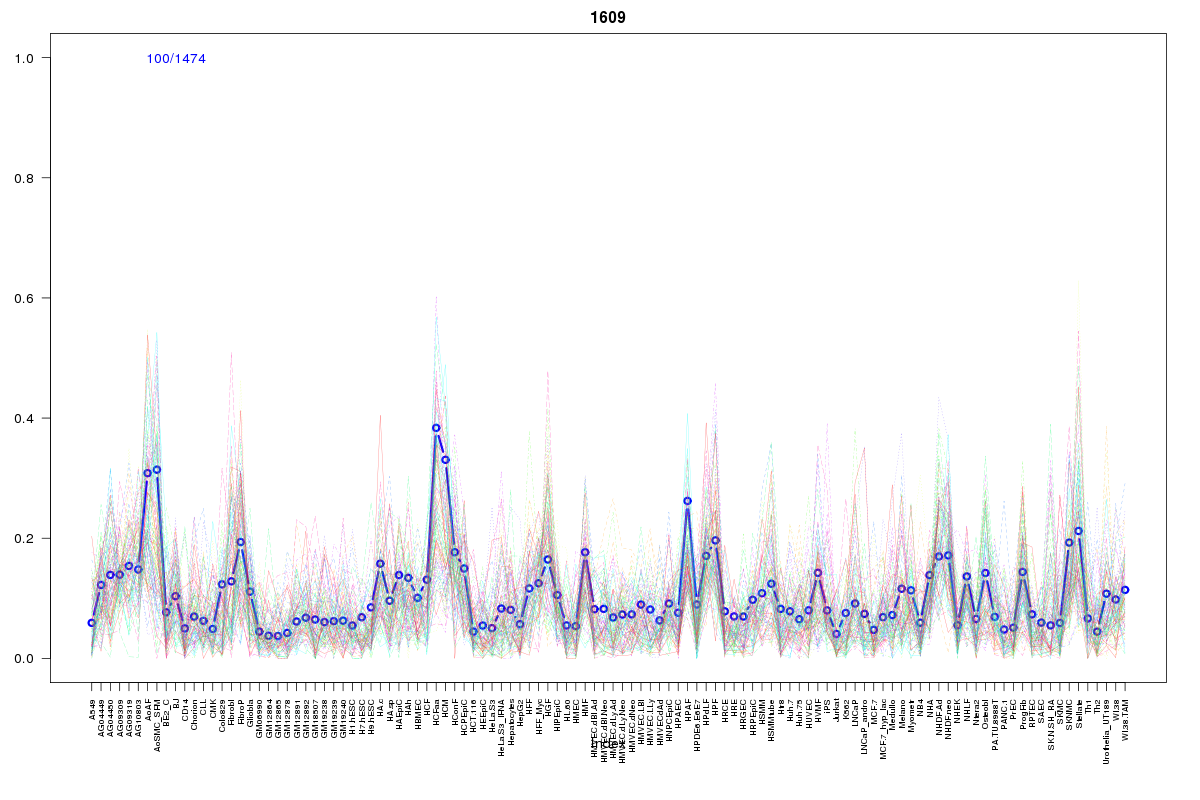 | 1609 | 1 |
 | 421 | 1 |
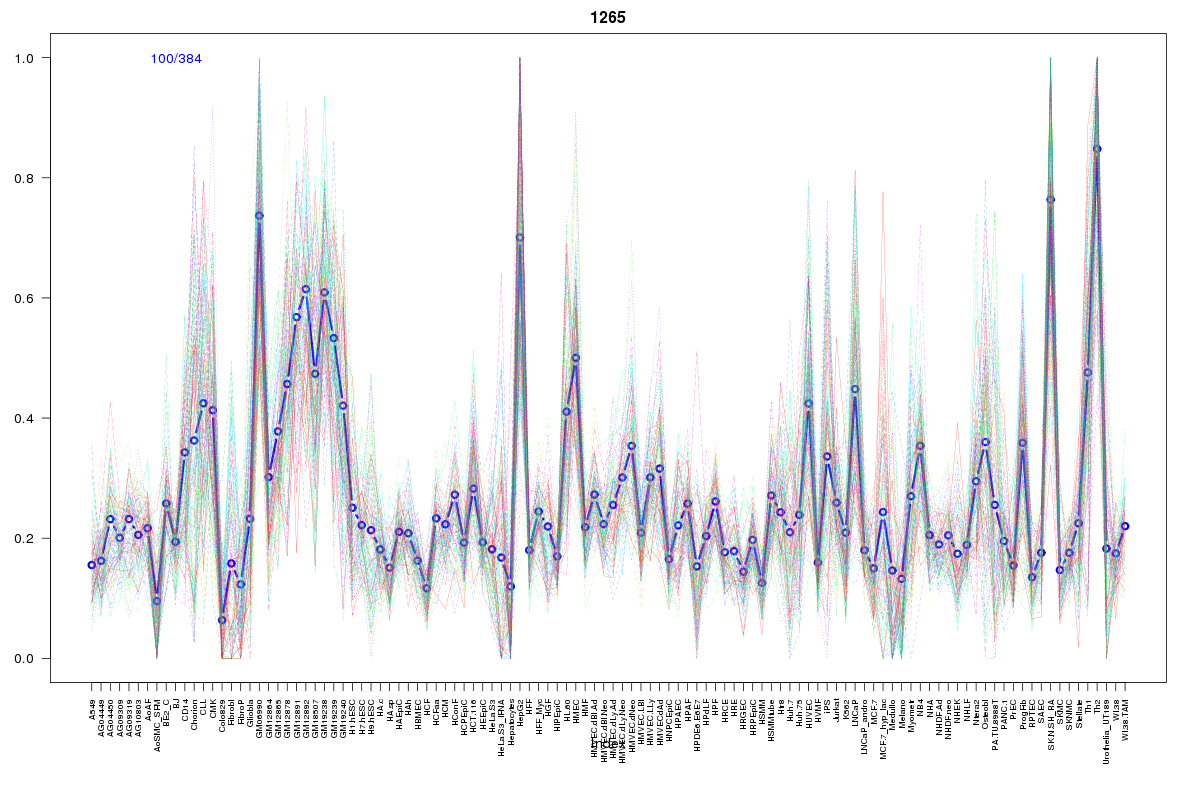 | 1265 | 1 |
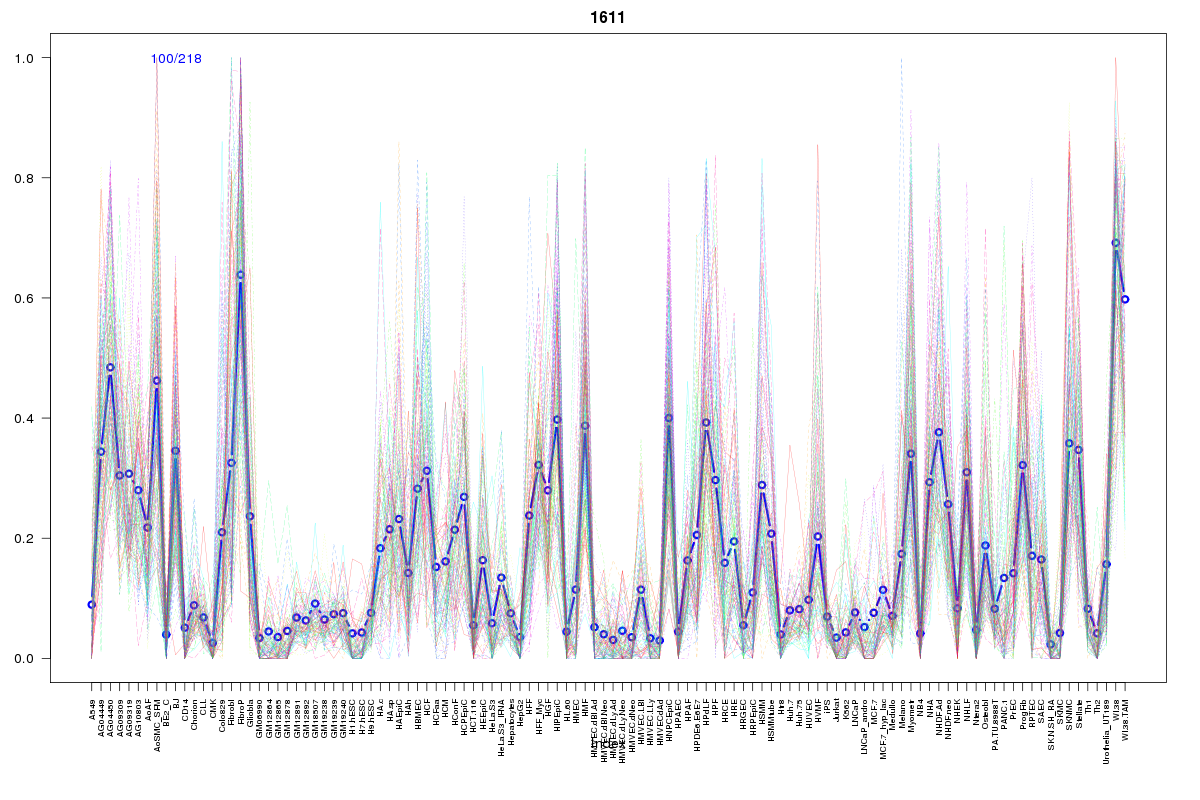 | 1611 | 1 |
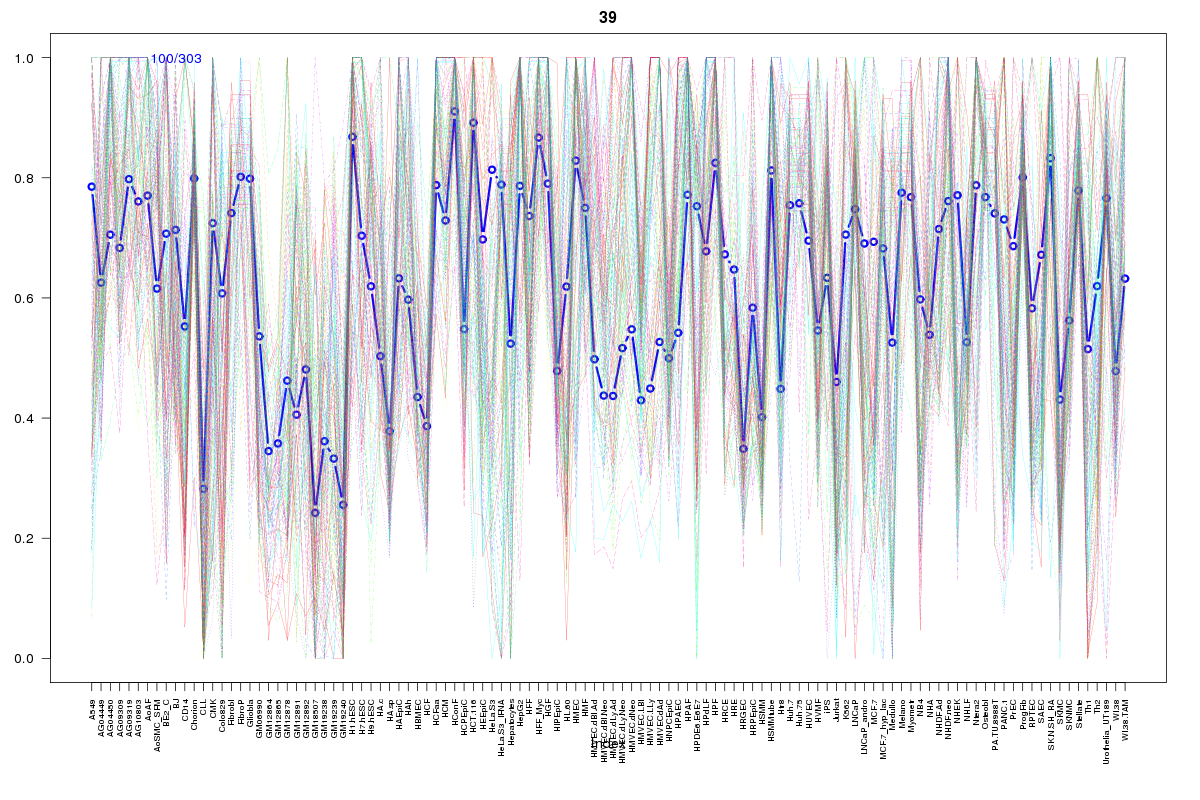 | 39 | 1 |
 | 1495 | 1 |
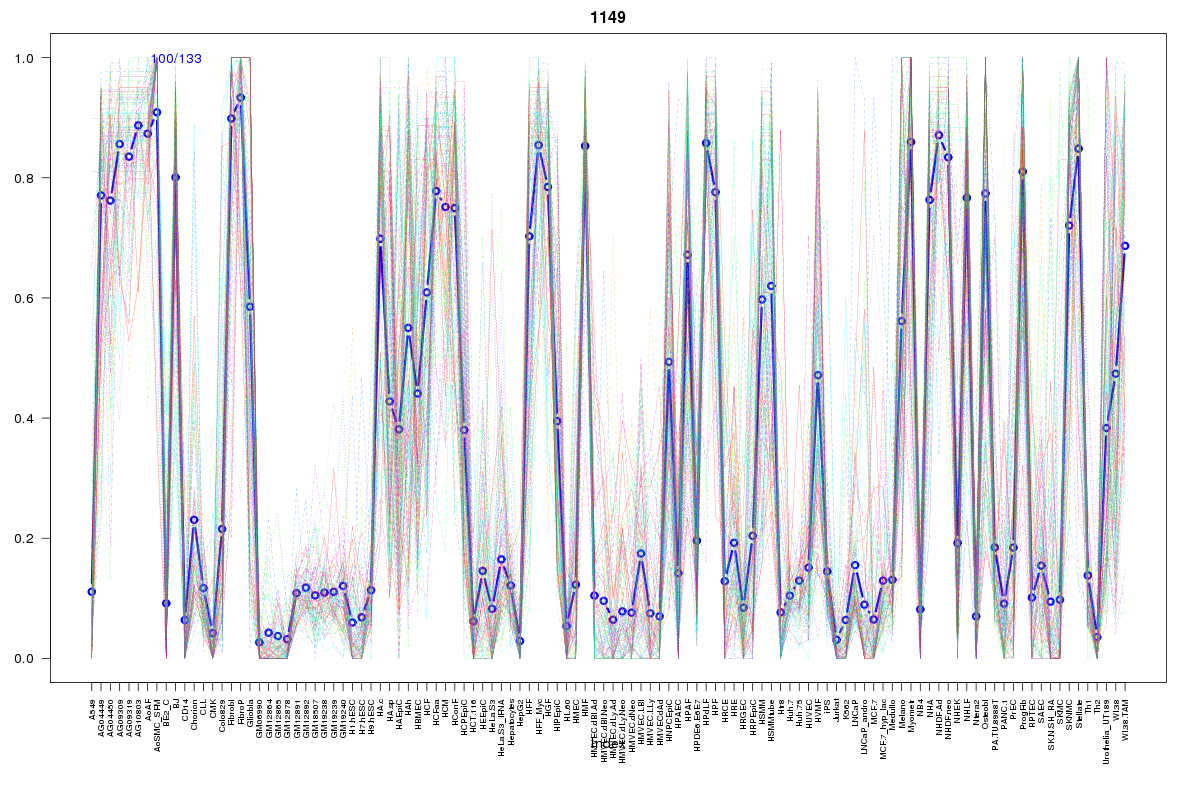 | 1149 | 1 |
 | 1244 | 1 |
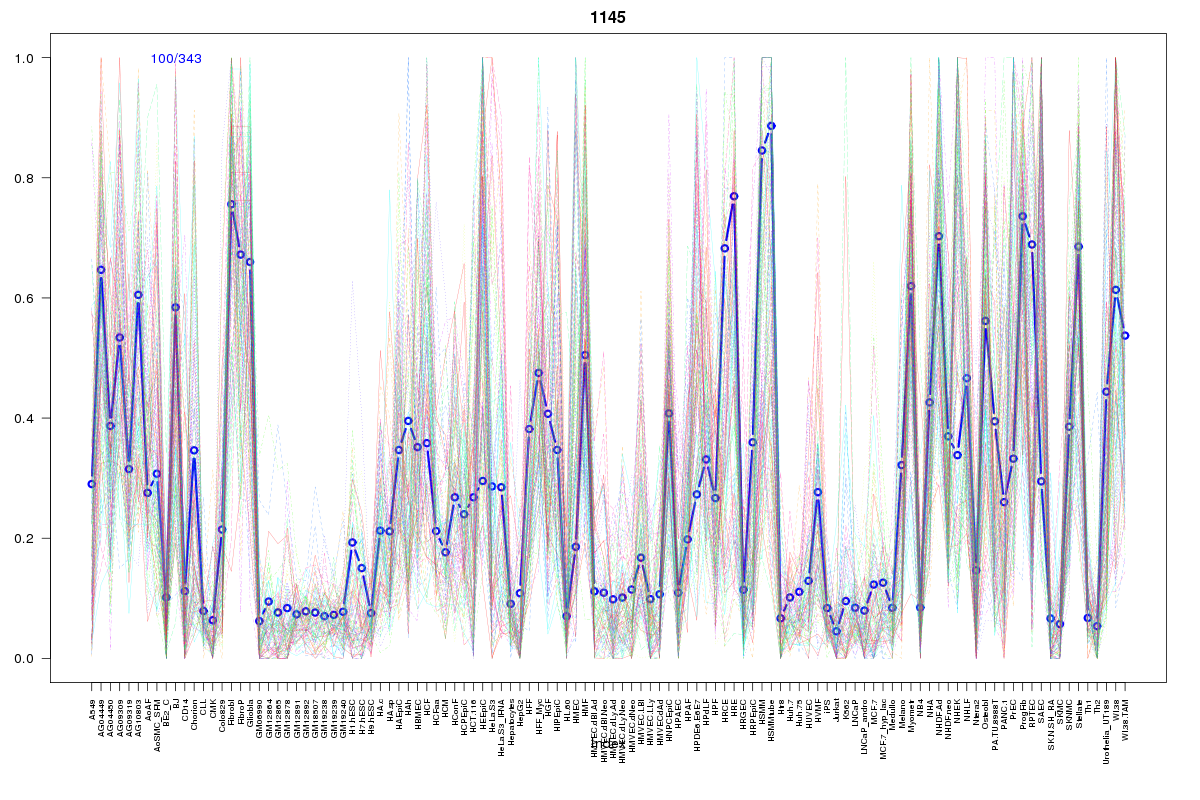 | 1145 | 1 |
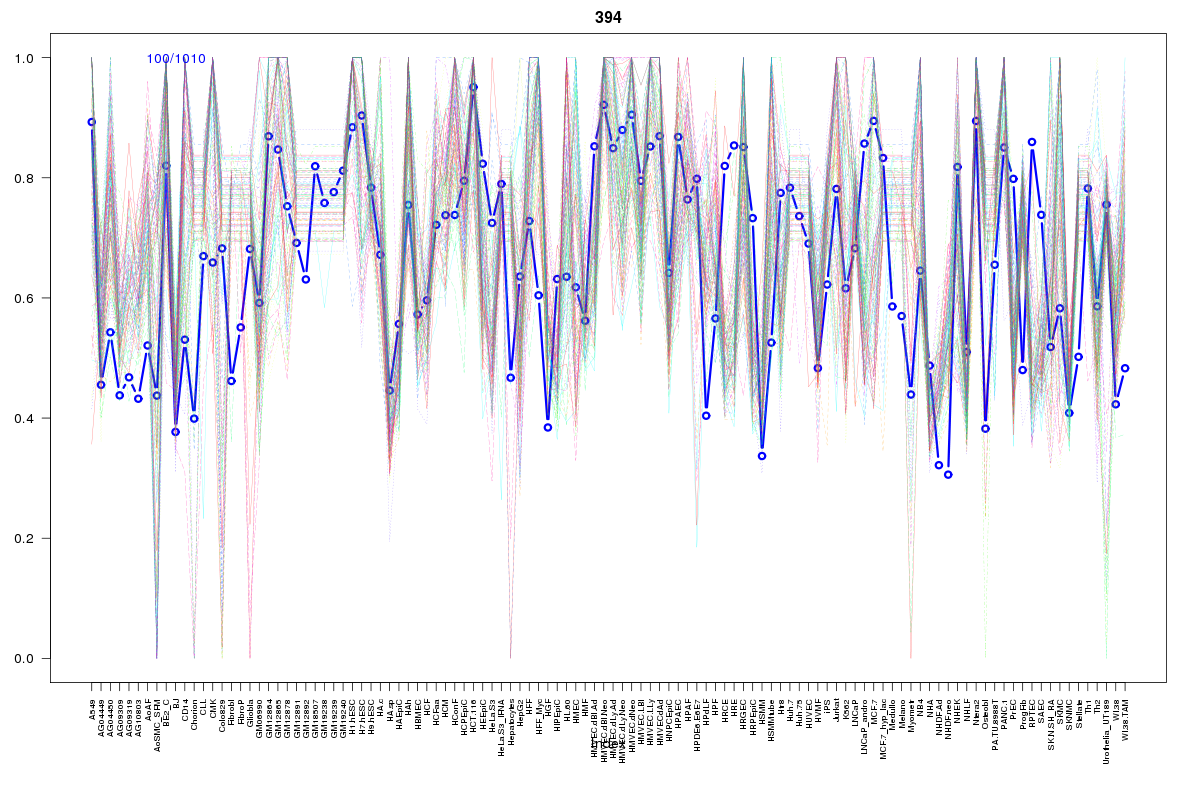 | 394 | 1 |
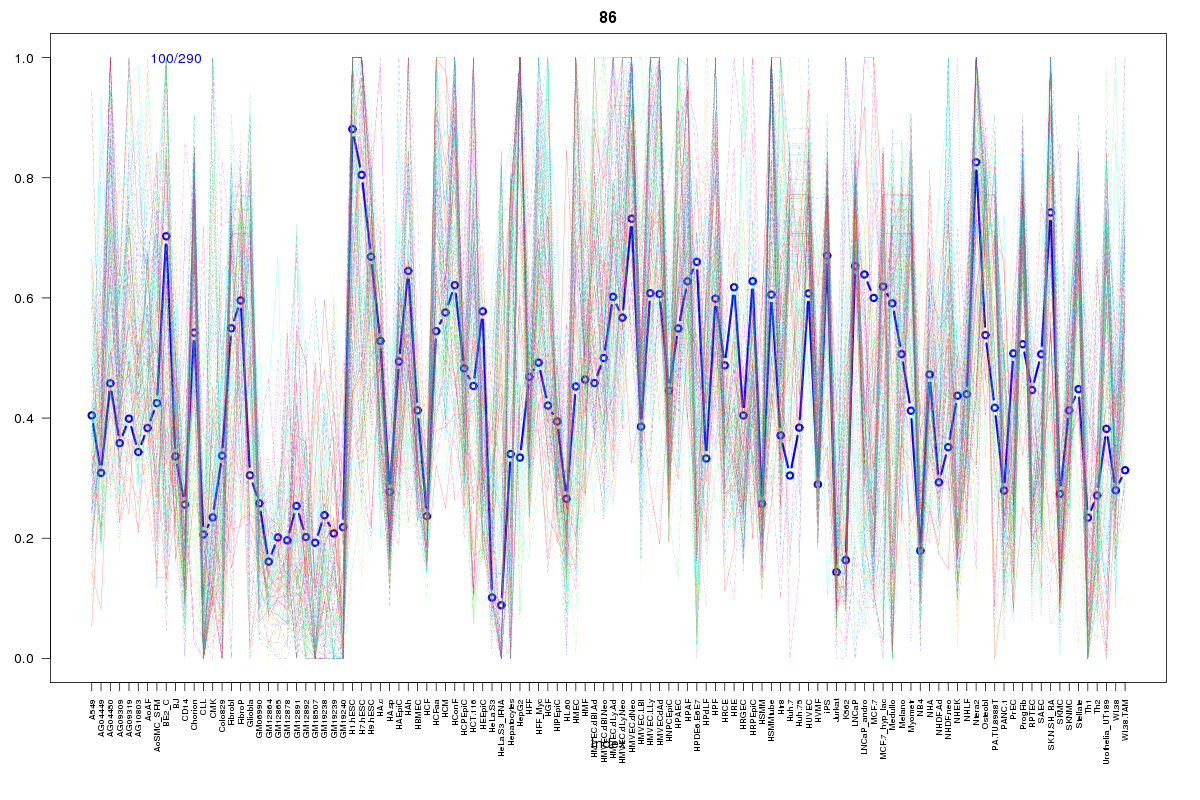 | 86 | 1 |
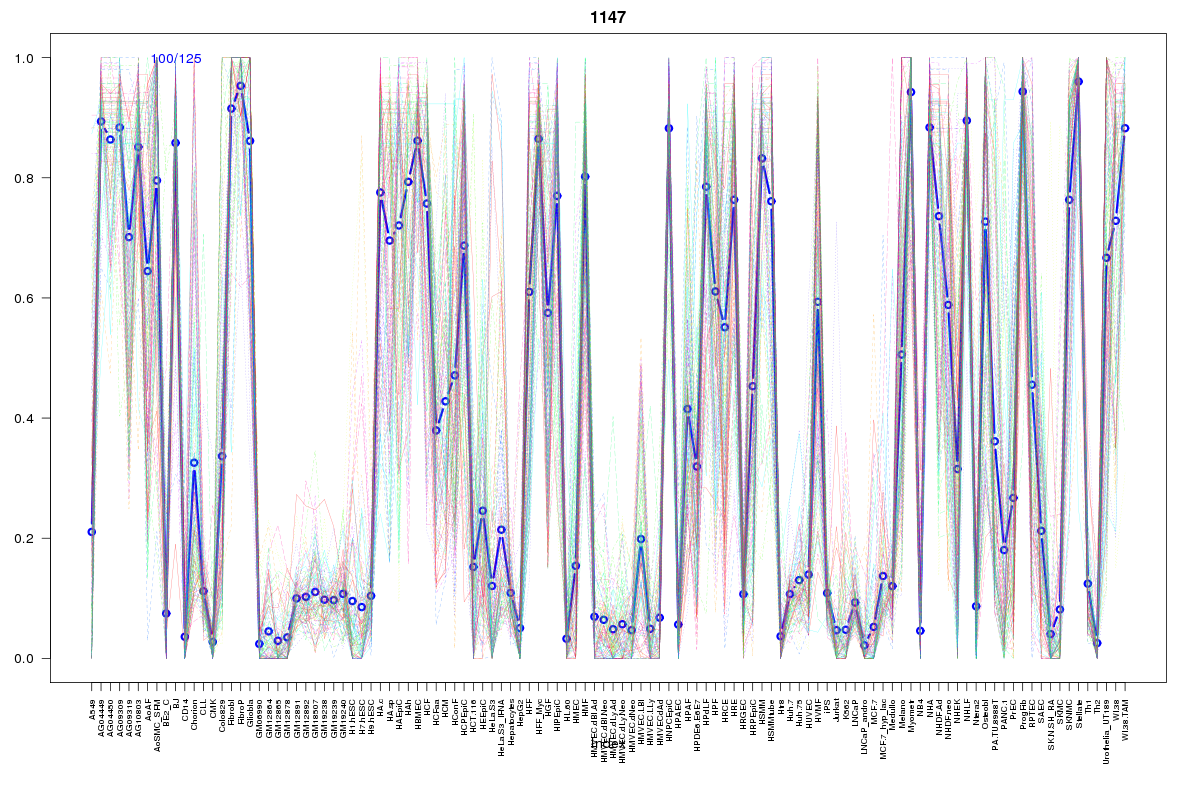 | 1147 | 1 |
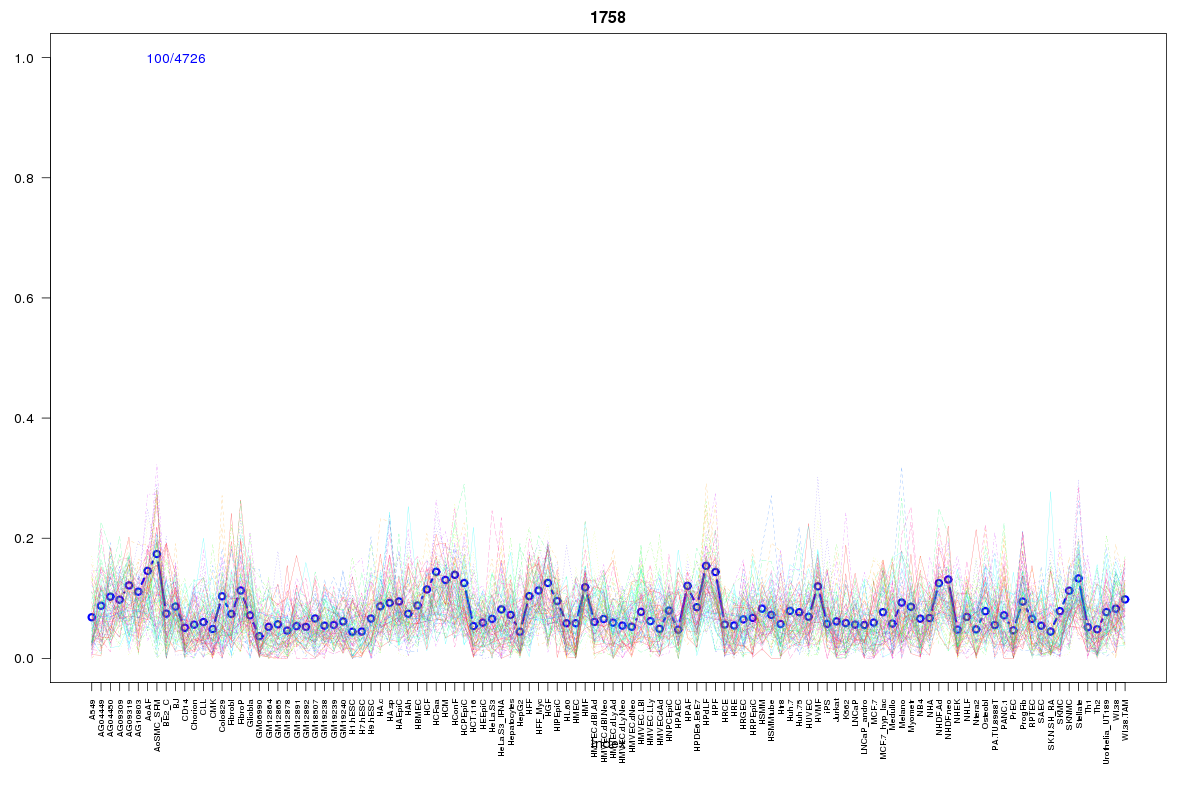 | 1758 | 1 |
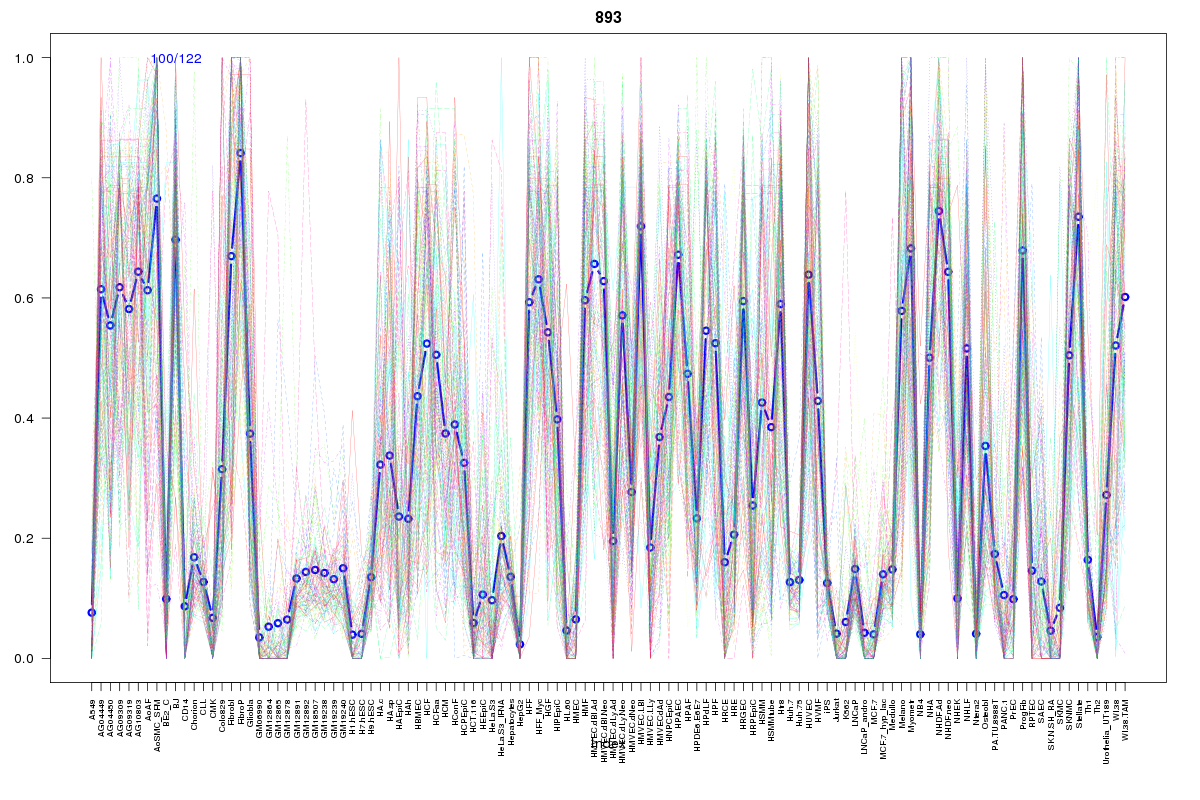 | 893 | 1 |
 | 2133 | 1 |
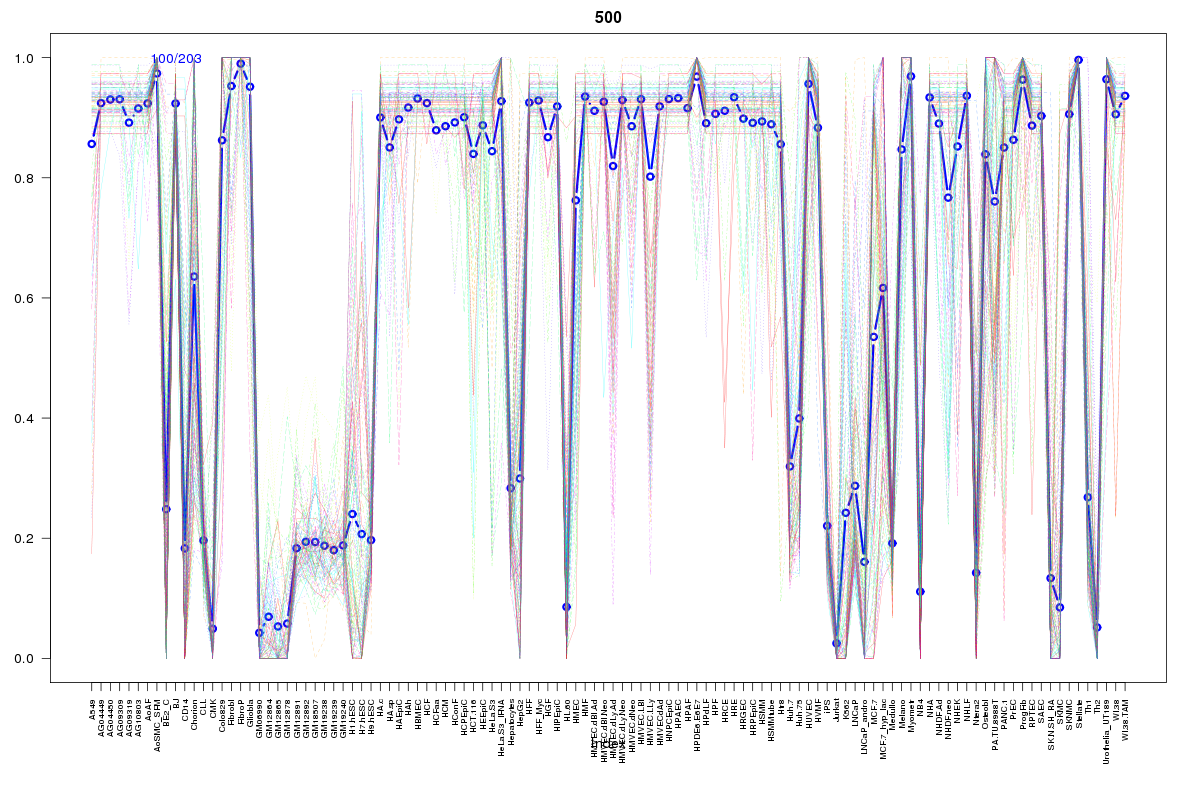 | 500 | 1 |
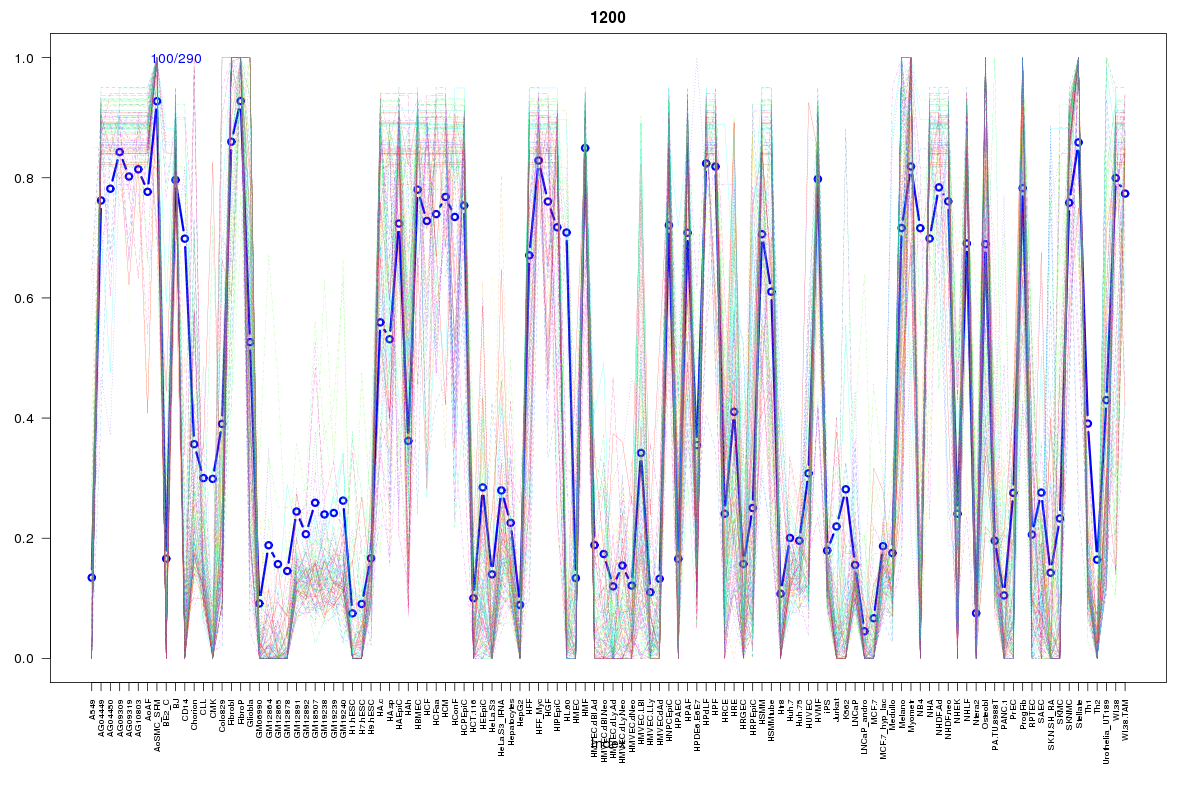 | 1200 | 1 |
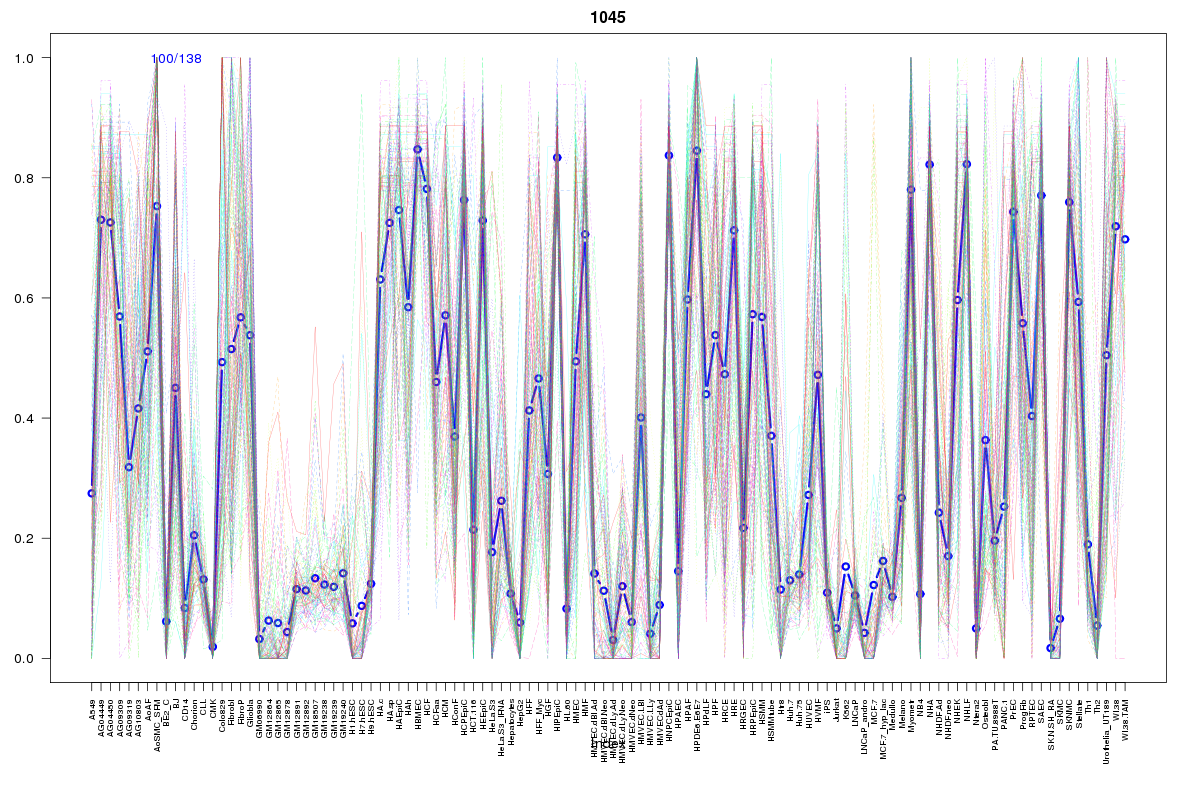 | 1045 | 1 |
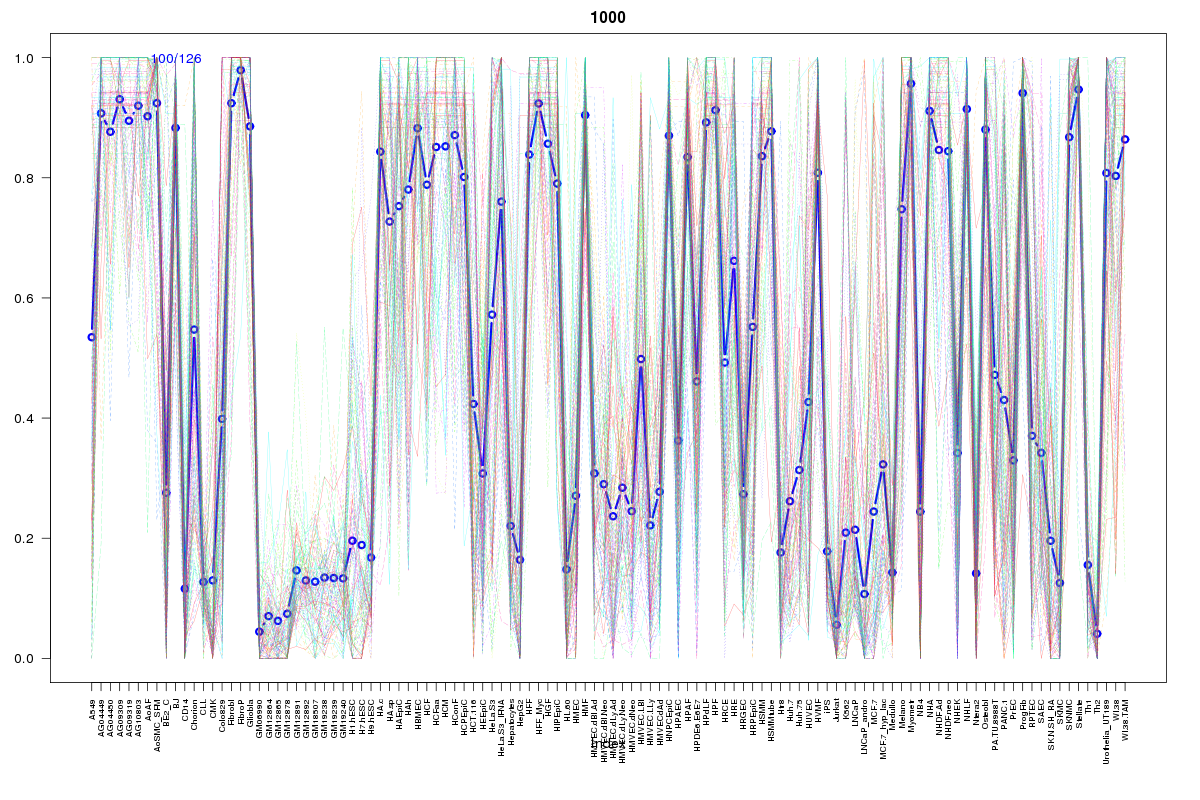 | 1000 | 1 |
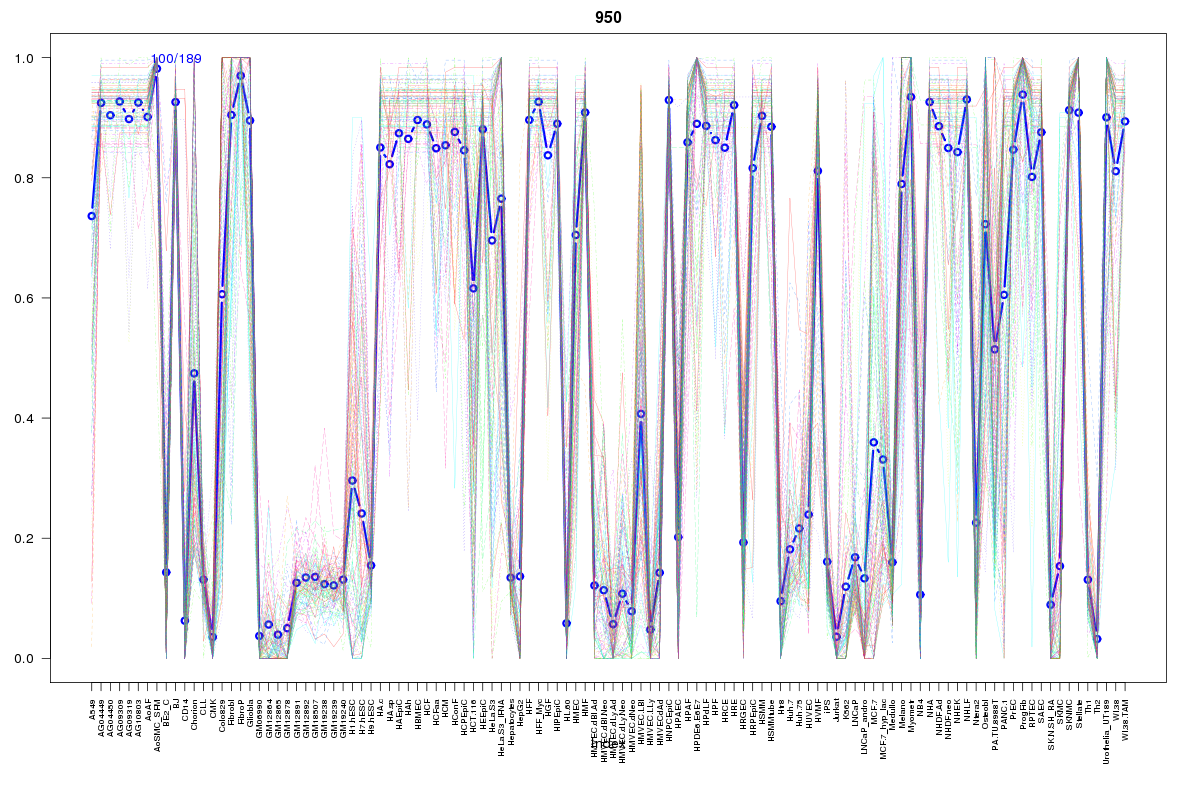 | 950 | 1 |
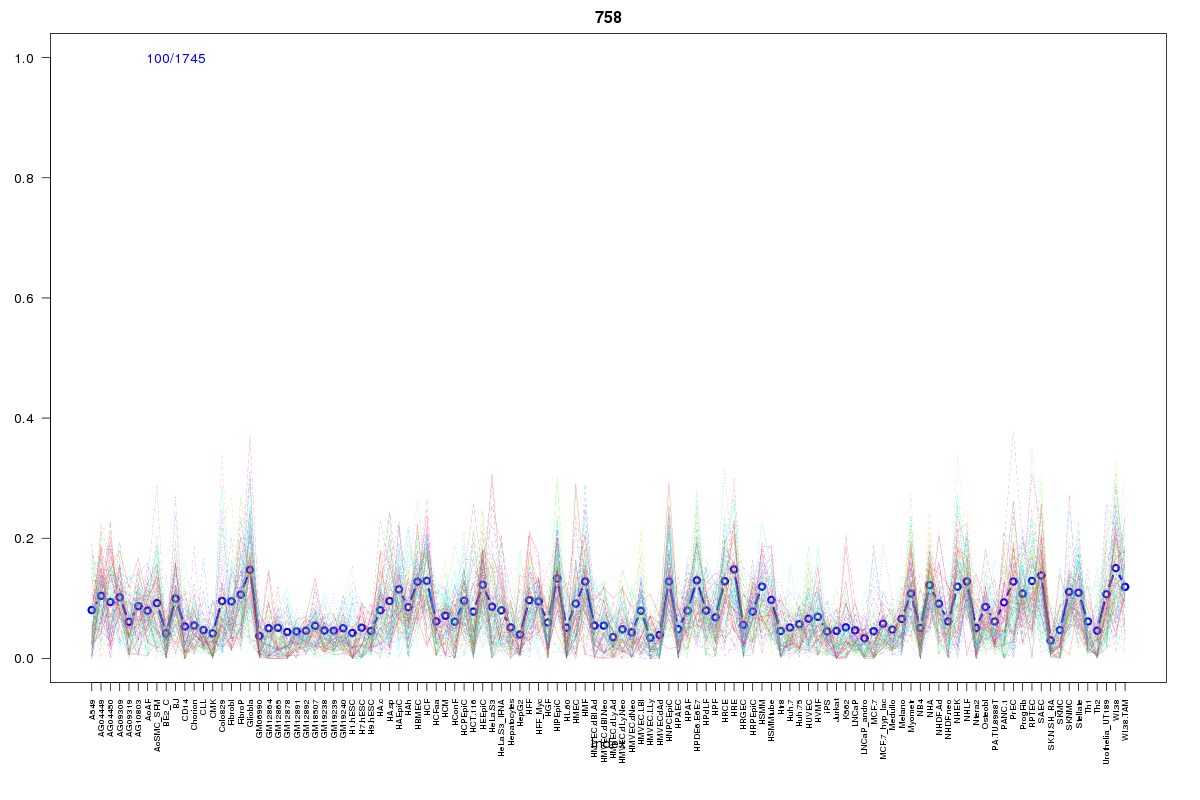 | 758 | 1 |
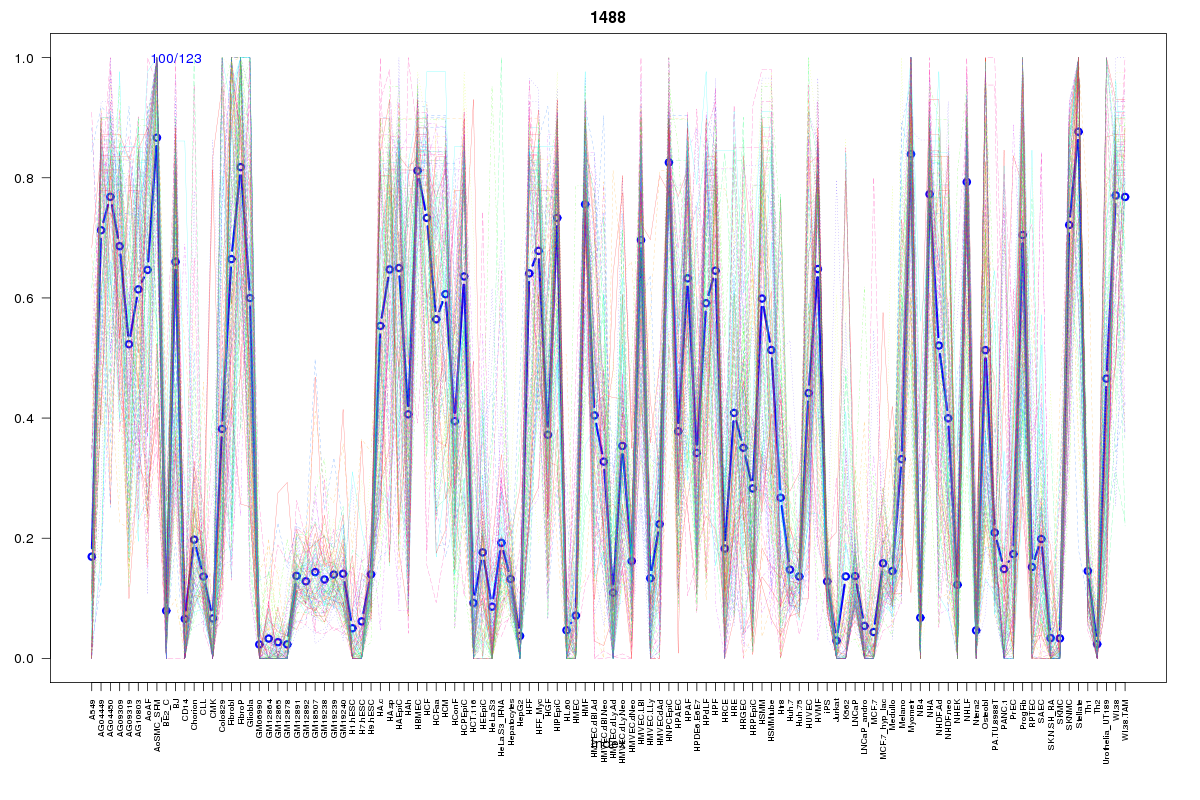 | 1488 | 1 |
 | 1386 | 1 |
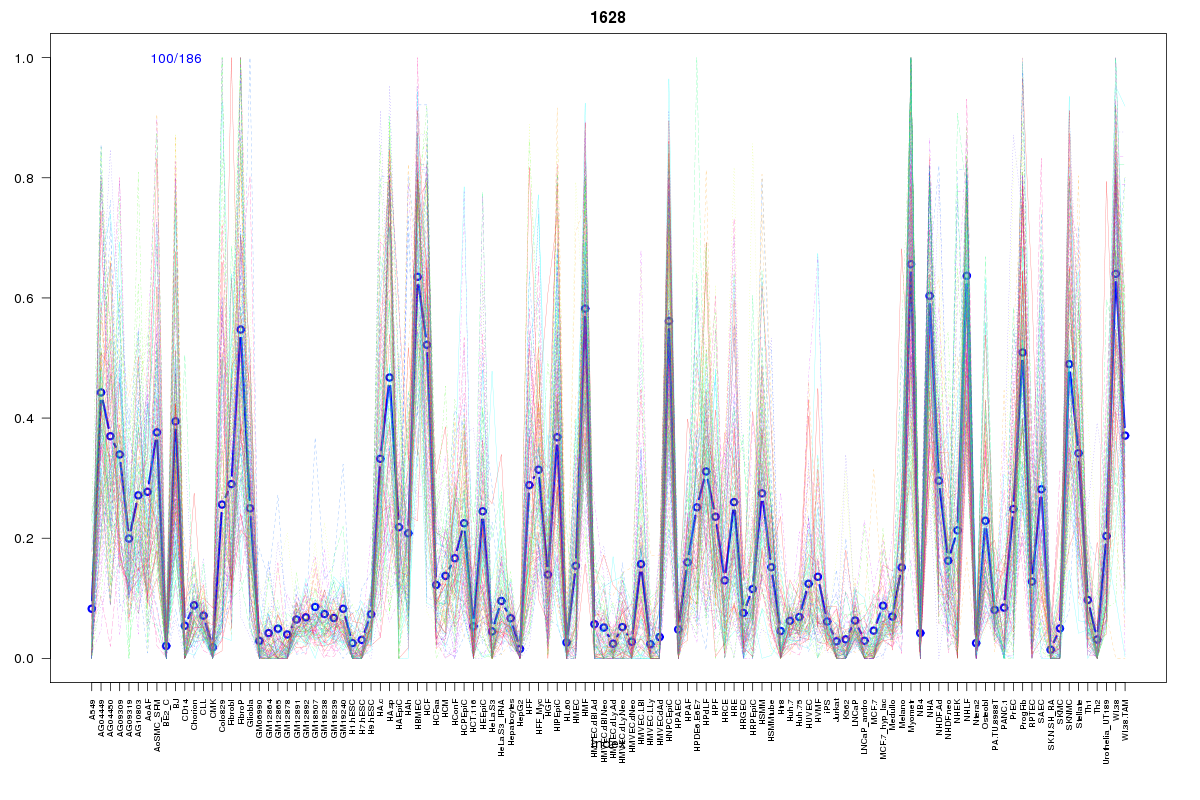 | 1628 | 1 |
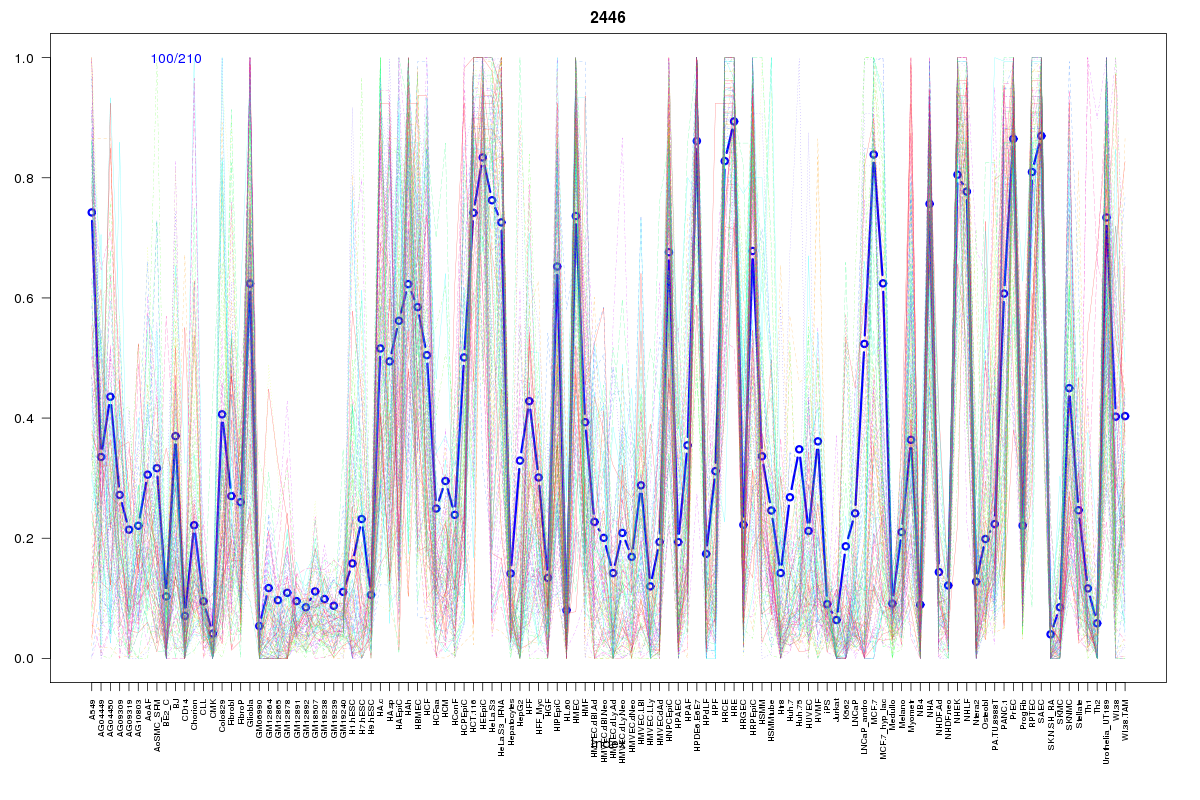 | 2446 | 1 |
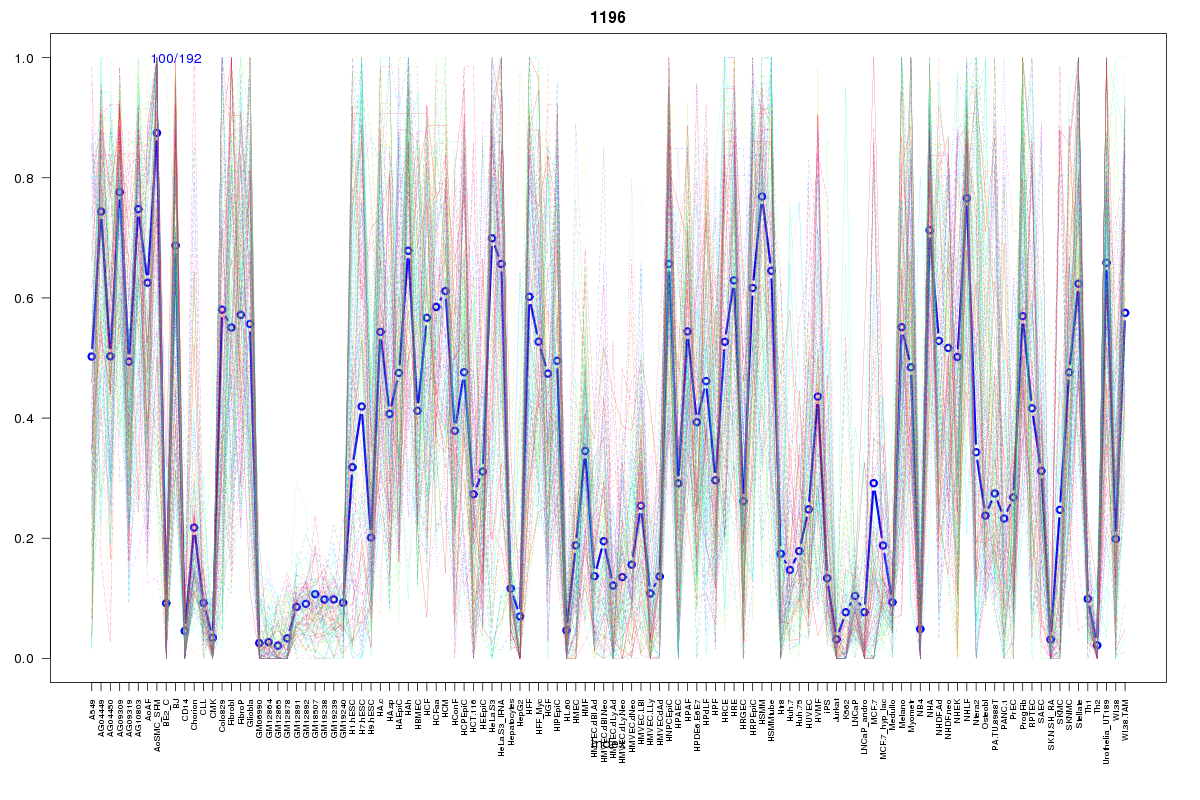 | 1196 | 1 |
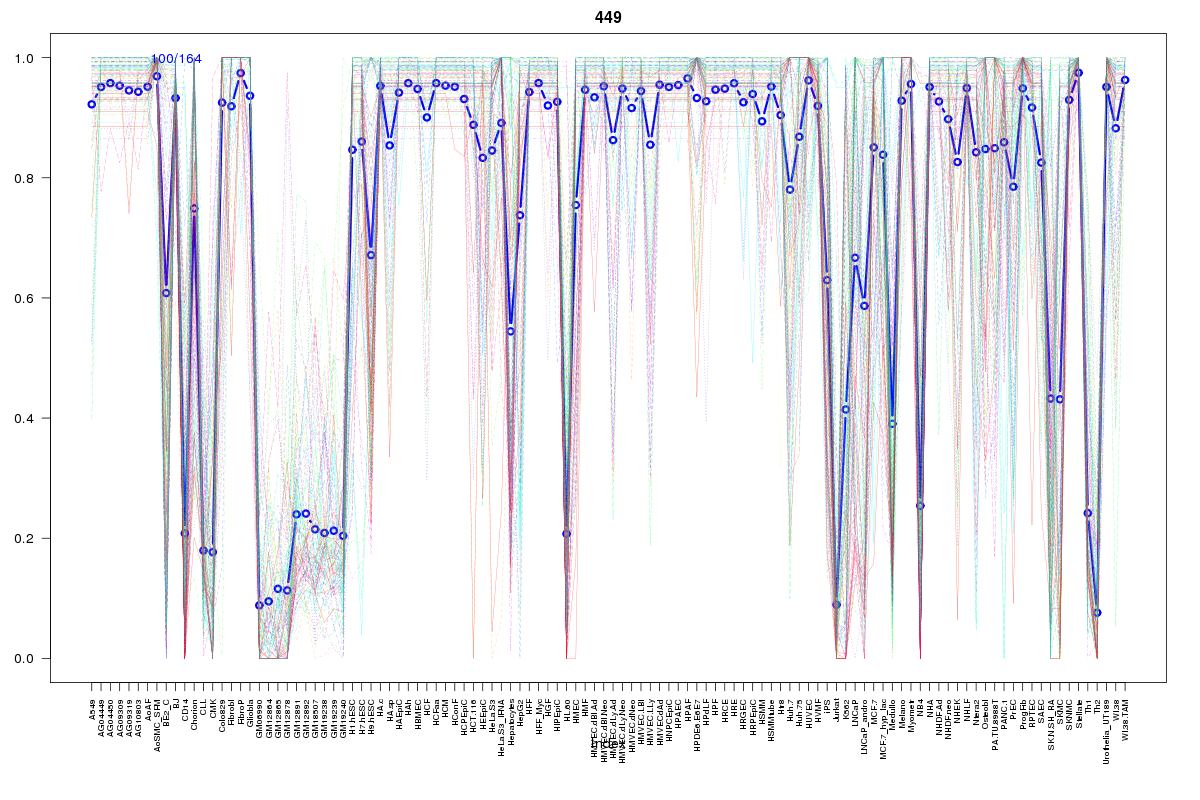 | 449 | 1 |
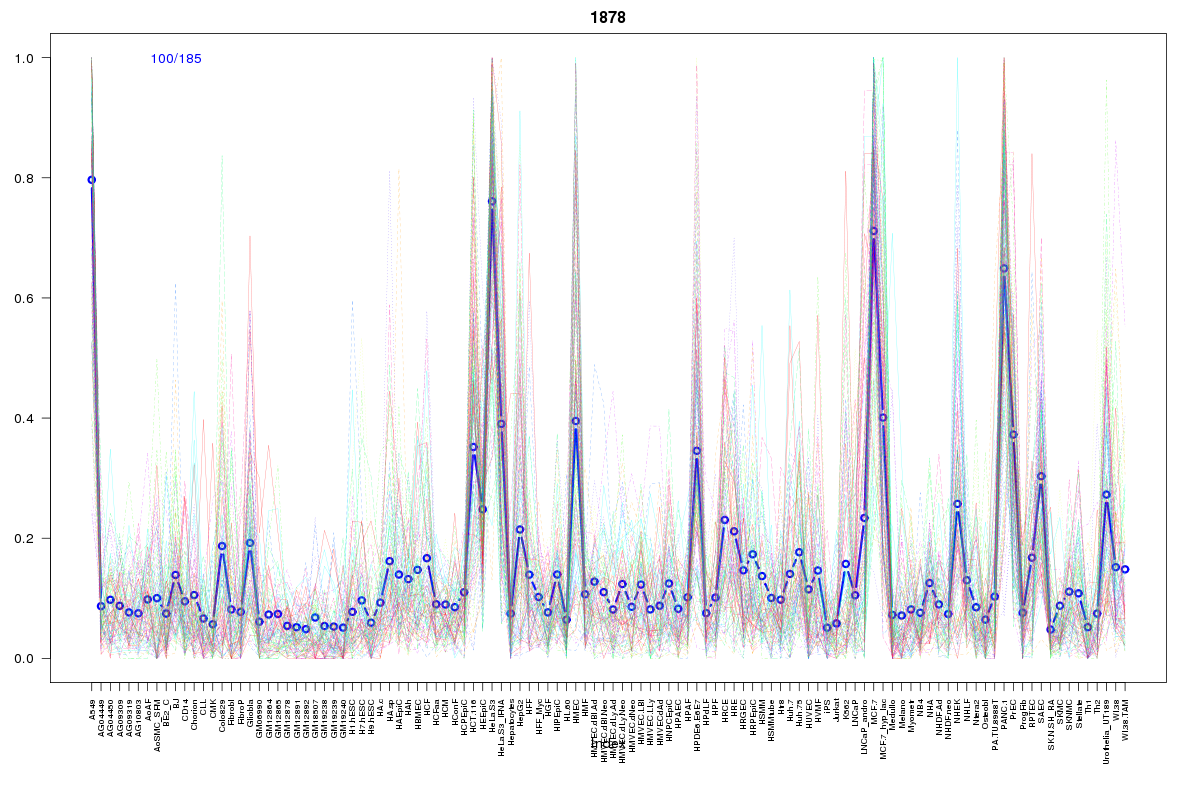 | 1878 | 1 |
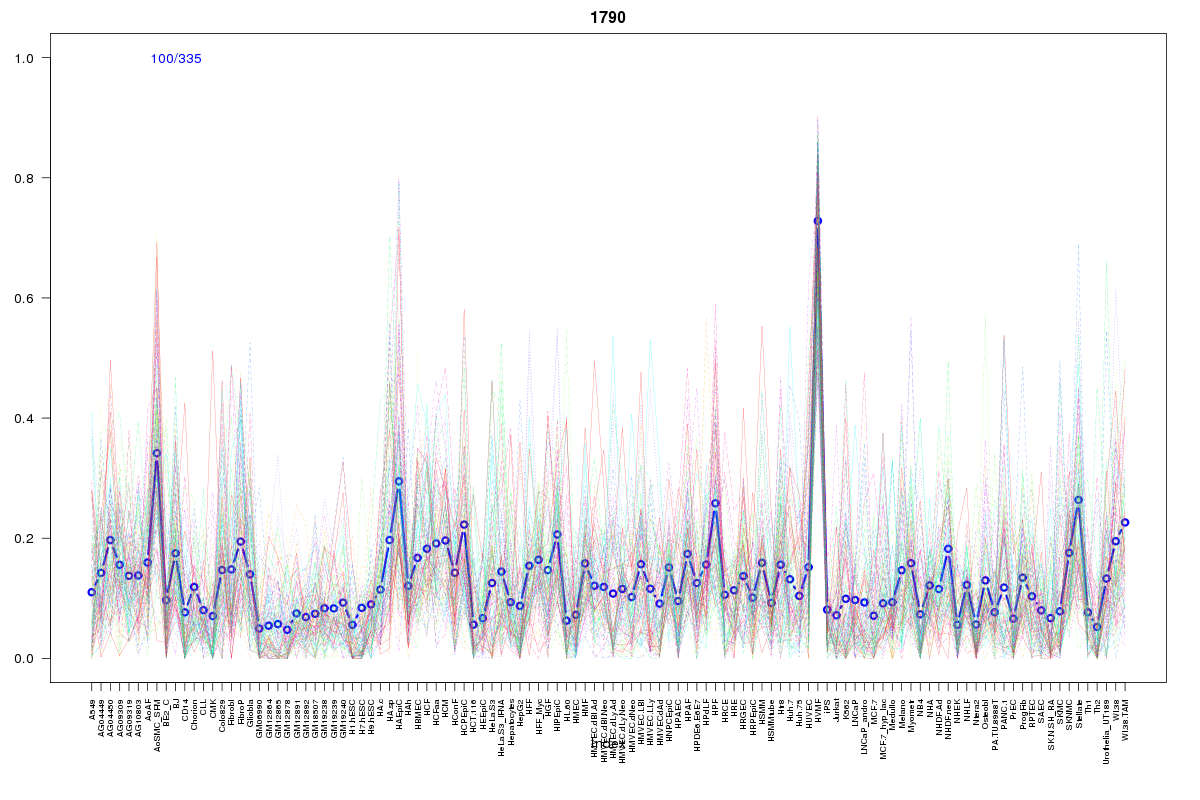 | 1790 | 1 |
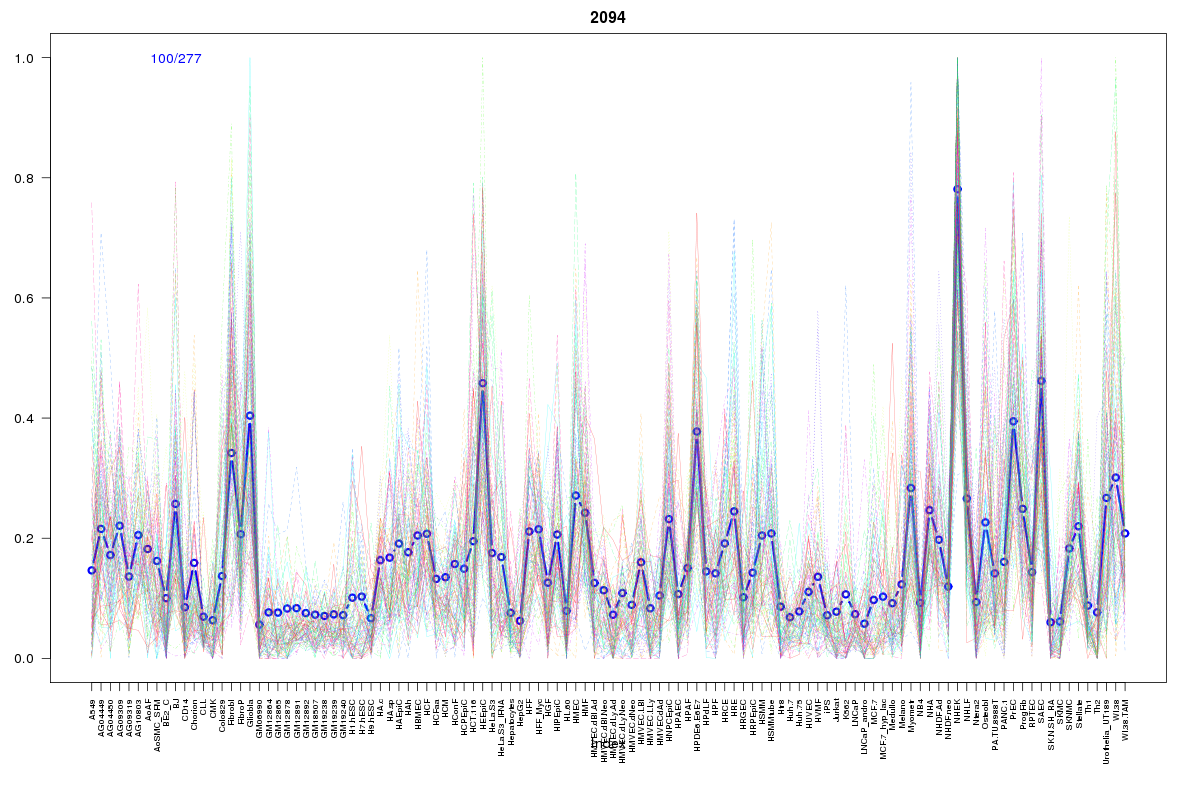 | 2094 | 1 |
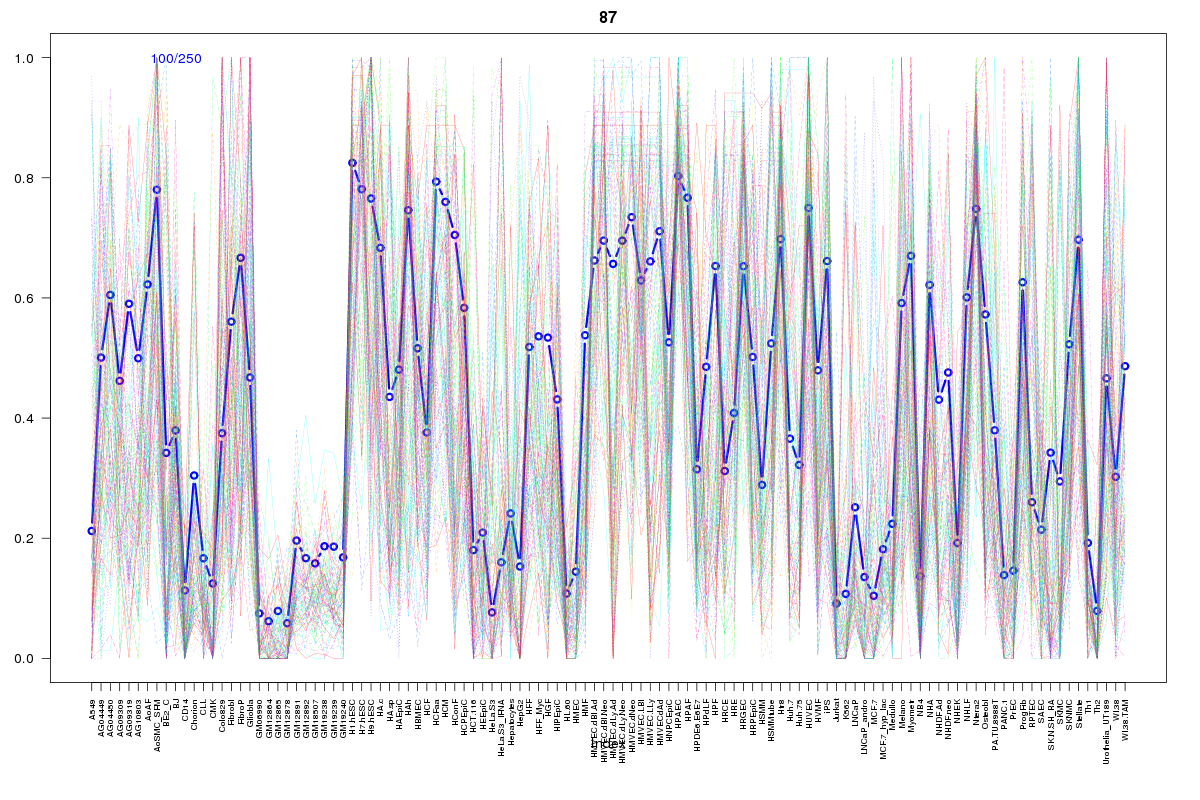 | 87 | 1 |
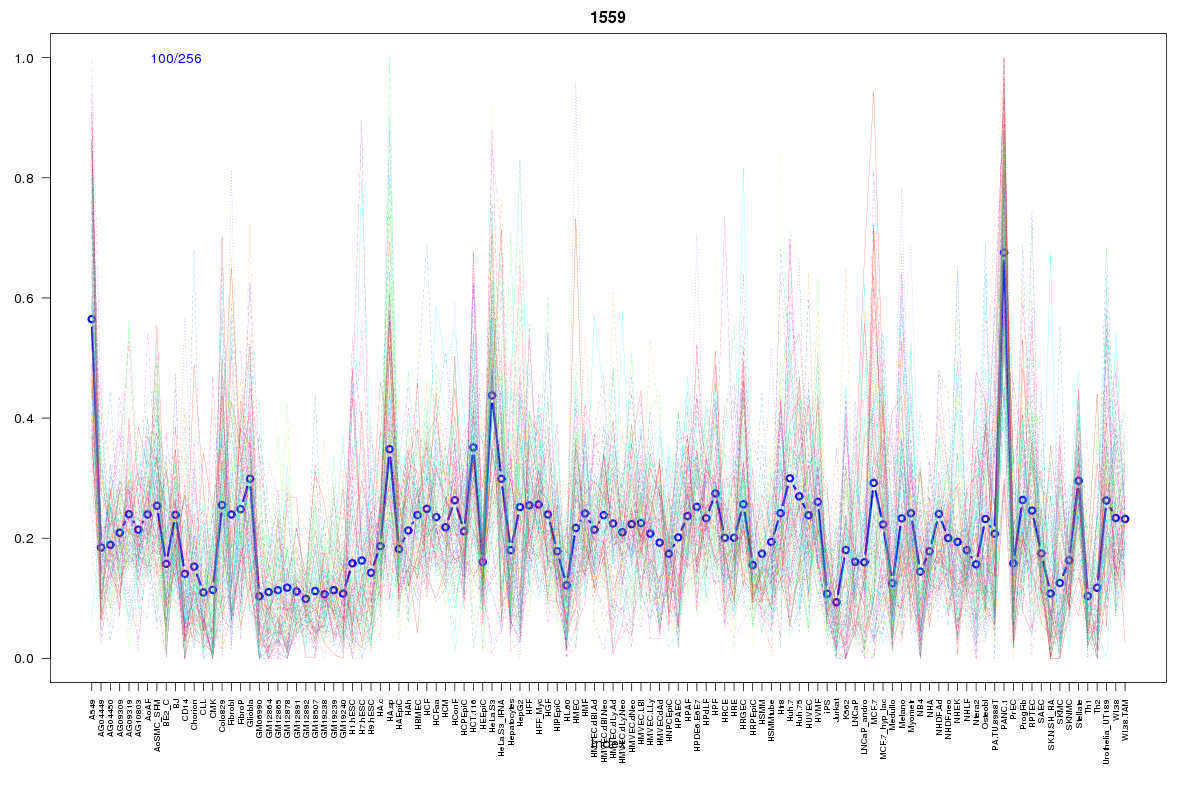 | 1559 | 1 |
 | 2062 | 1 |
Resources
BED file downloads
Connects to 39 DHS sitesTop 10 Correlated DHS Sites
p-values indiciate significant higher or lower correlation| Location | Cluster | P-value |
|---|---|---|
| chr1:201472700-201472850 | 449 | 0 |
| chr1:201431120-201431270 | 650 | 0 |
| chr1:201430400-201430550 | 650 | 0 |
| chr1:201353360-201353510 | 1147 | 0.001 |
| chr1:201458565-201458715 | 1000 | 0.001 |
| chr1:201426140-201426290 | 950 | 0.001 |
| chr1:201458400-201458550 | 500 | 0.003 |
| chr1:201505800-201505950 | 1244 | 0.003 |
| chr1:201531460-201531610 | 1200 | 0.003 |
| chr1:201425660-201425810 | 1045 | 0.003 |
| chr1:201531980-201532130 | 1488 | 0.003 |
External Databases
UCSCEnsembl (ENSG00000174307)