Gene: GOLT1A
chr1: 204167287-204183220Expression Profile
(log scale)
Graphical Connections
Distribution of linked clusters:
You may find it interesting if many of the connected DHS sites belong to the same cluster.| Cluster Profile | Cluster ID | Number of DHS sites in this cluster |
|---|---|---|
 | 927 | 2 |
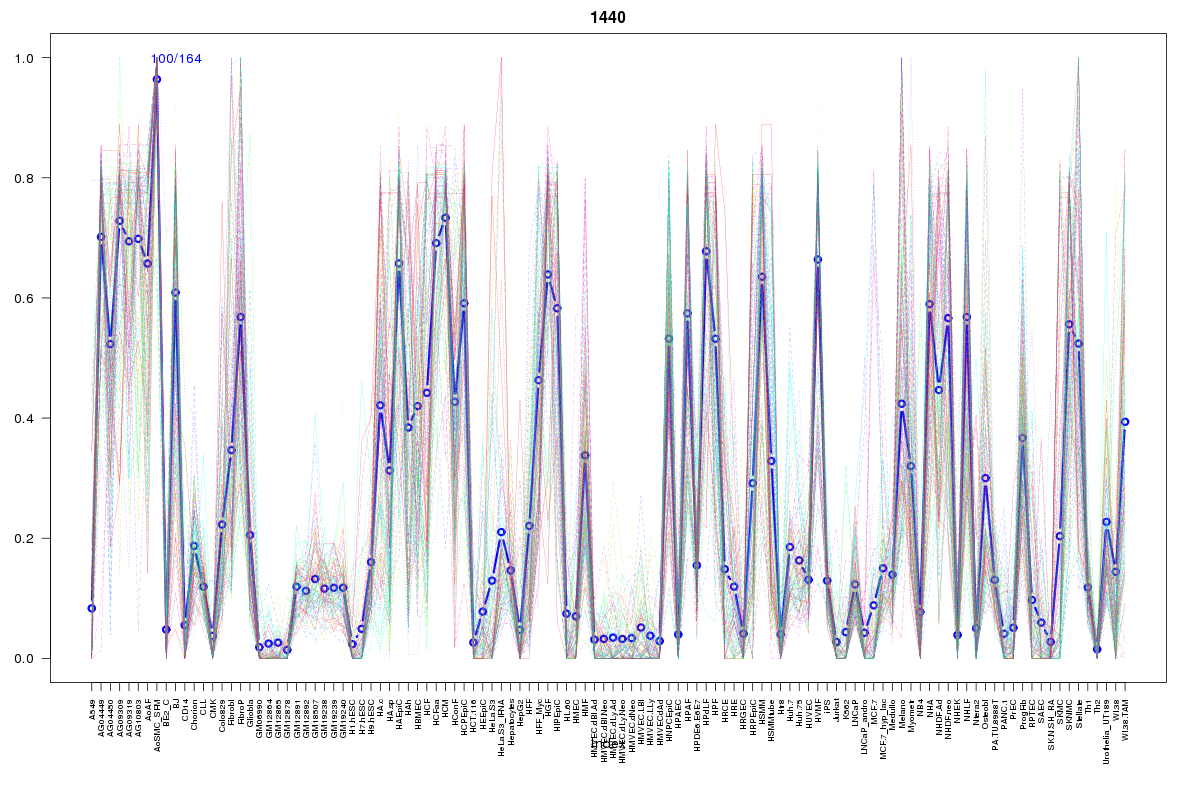 | 1440 | 2 |
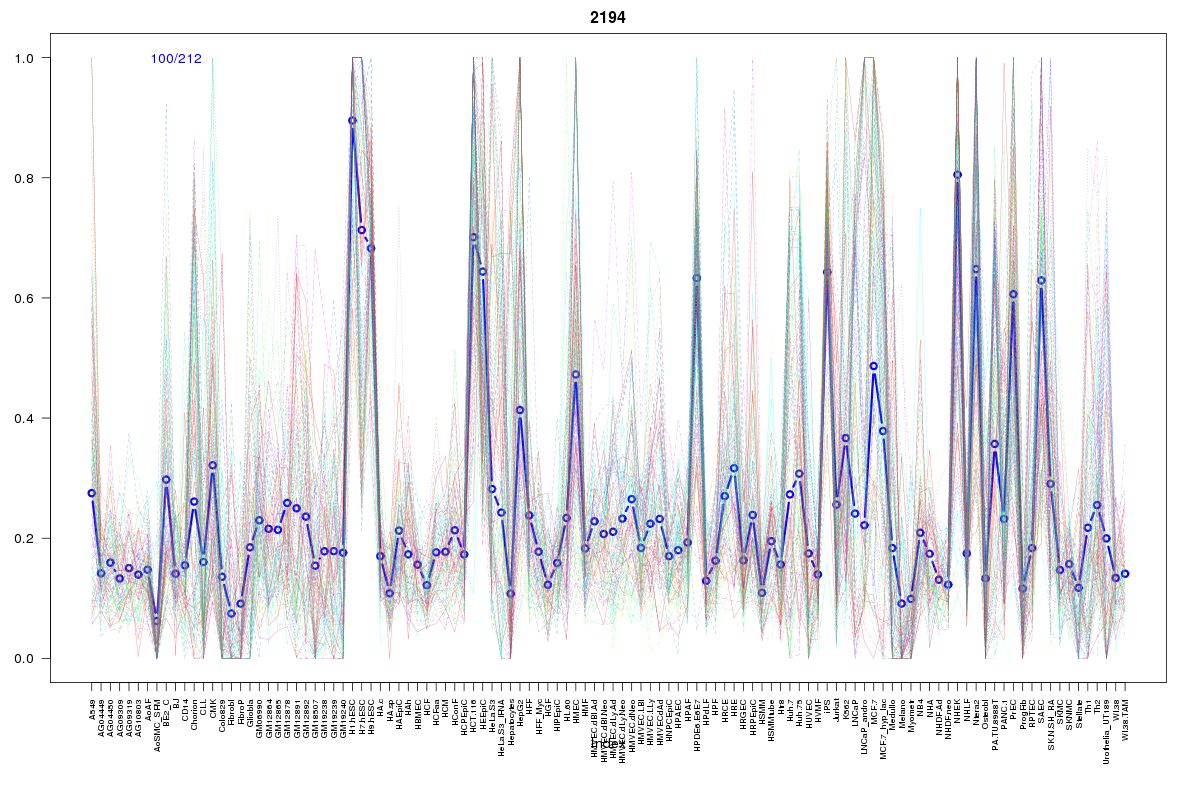 | 2194 | 2 |
 | 1420 | 1 |
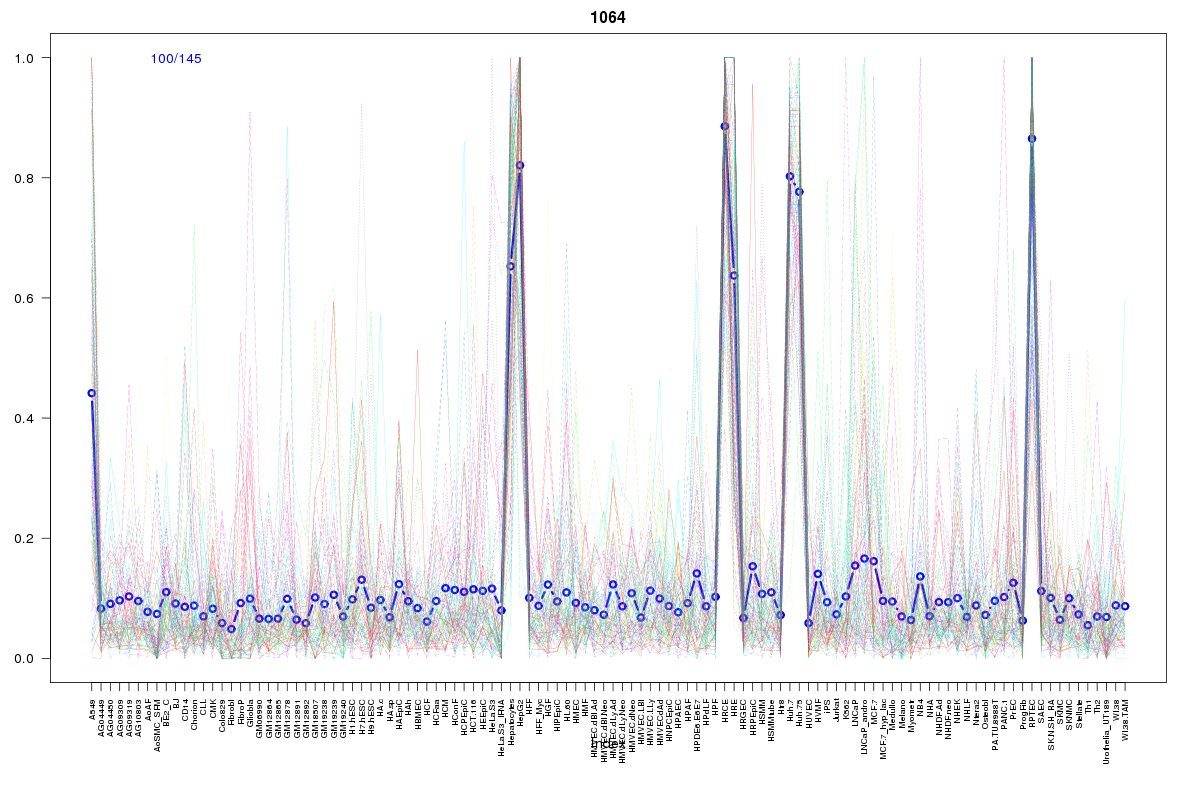 | 1064 | 1 |
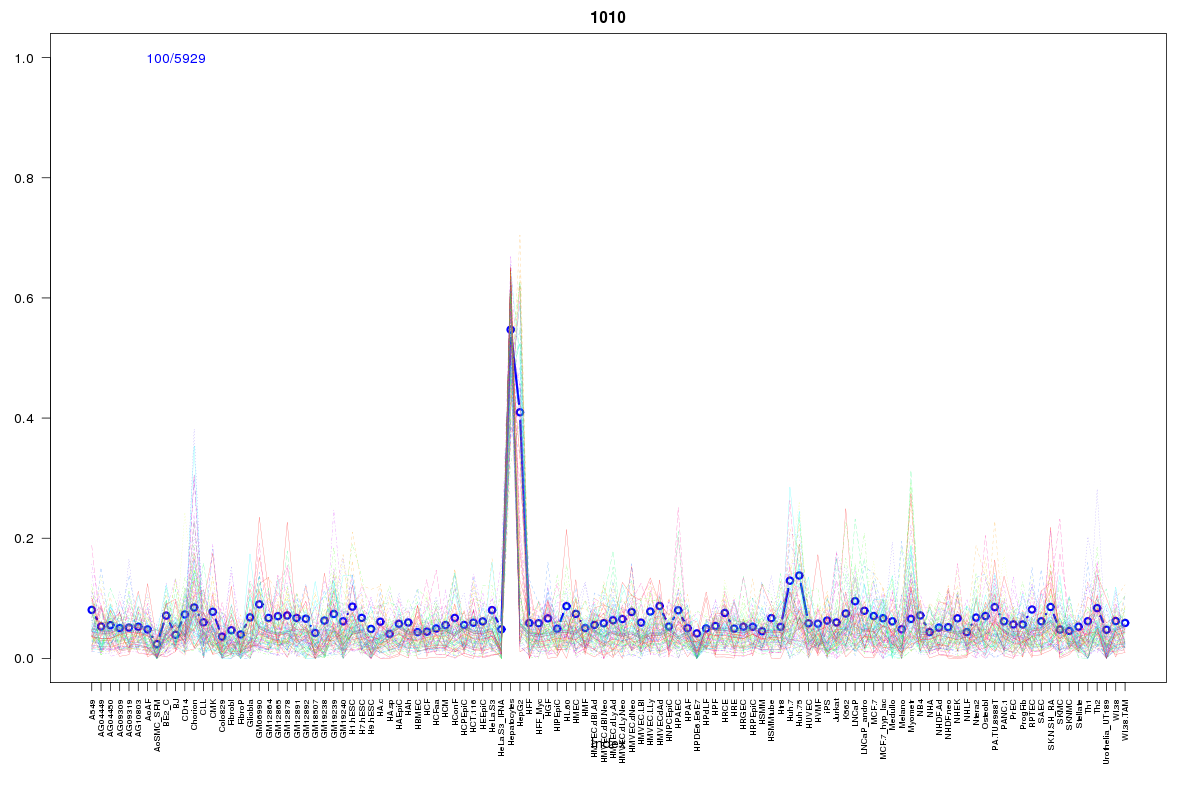 | 1010 | 1 |
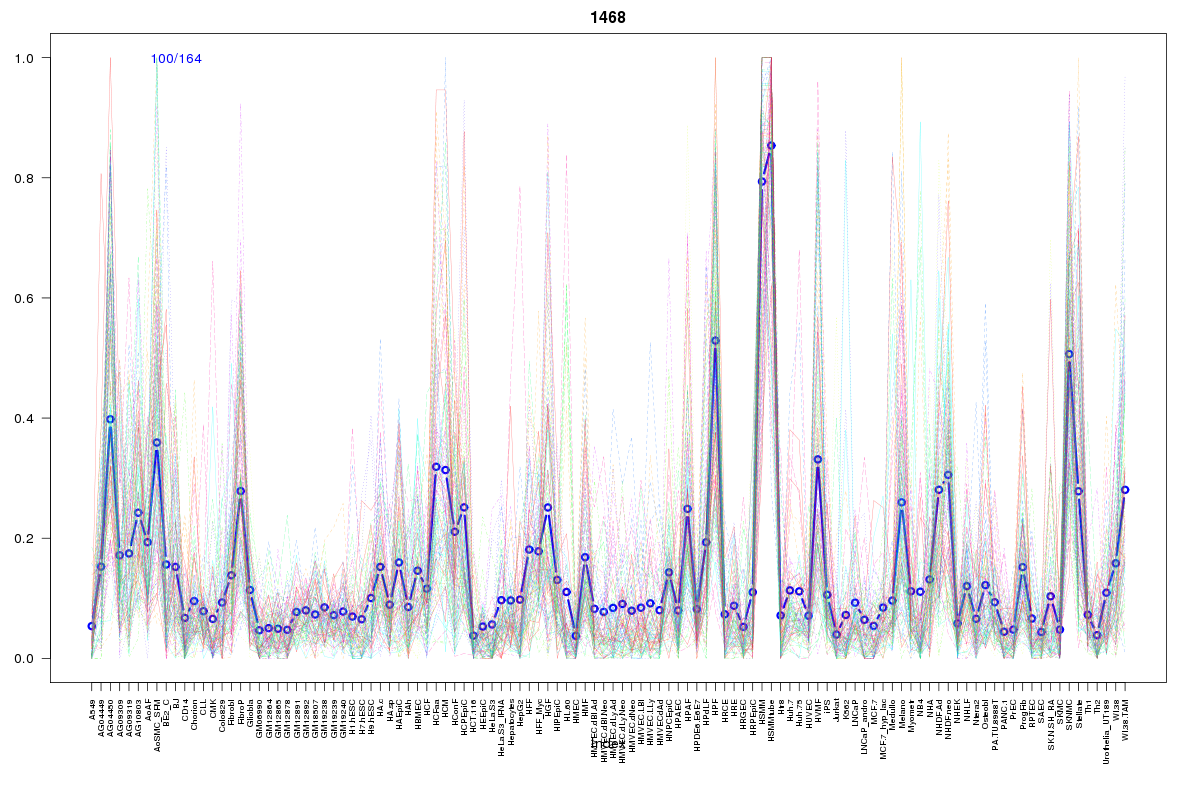 | 1468 | 1 |
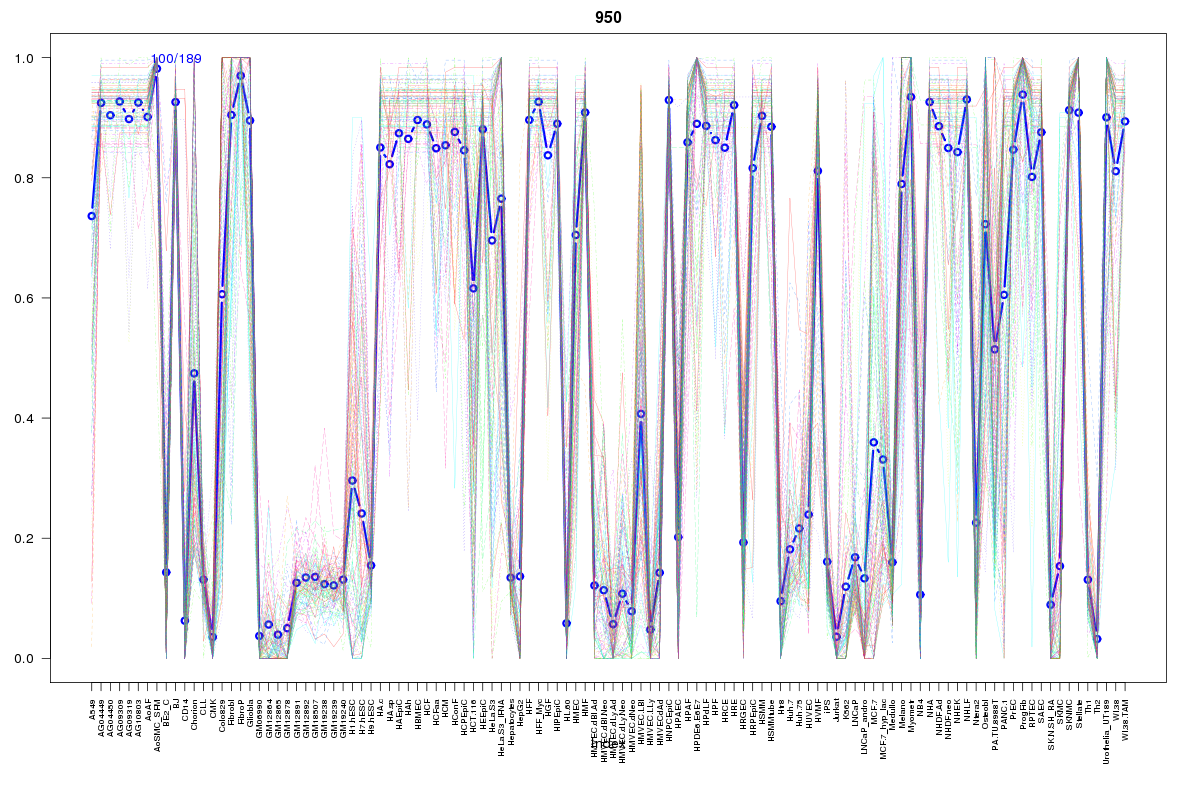 | 950 | 1 |
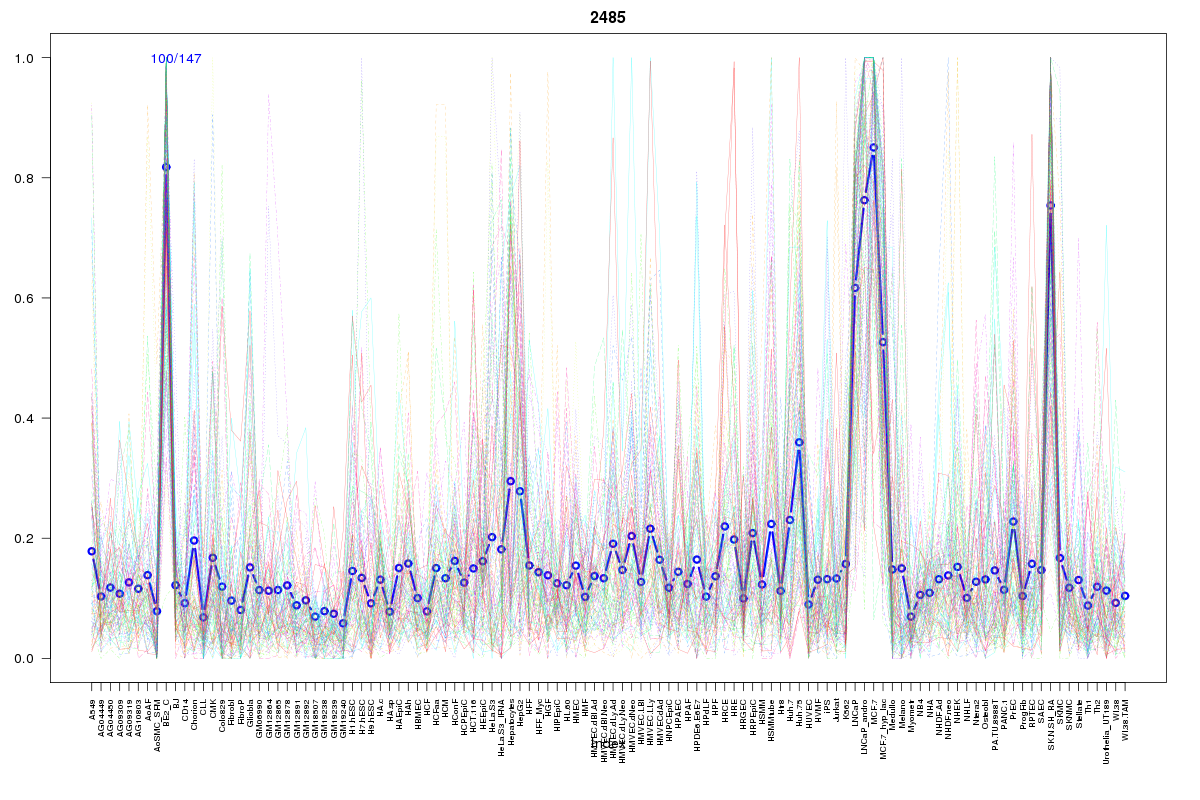 | 2485 | 1 |
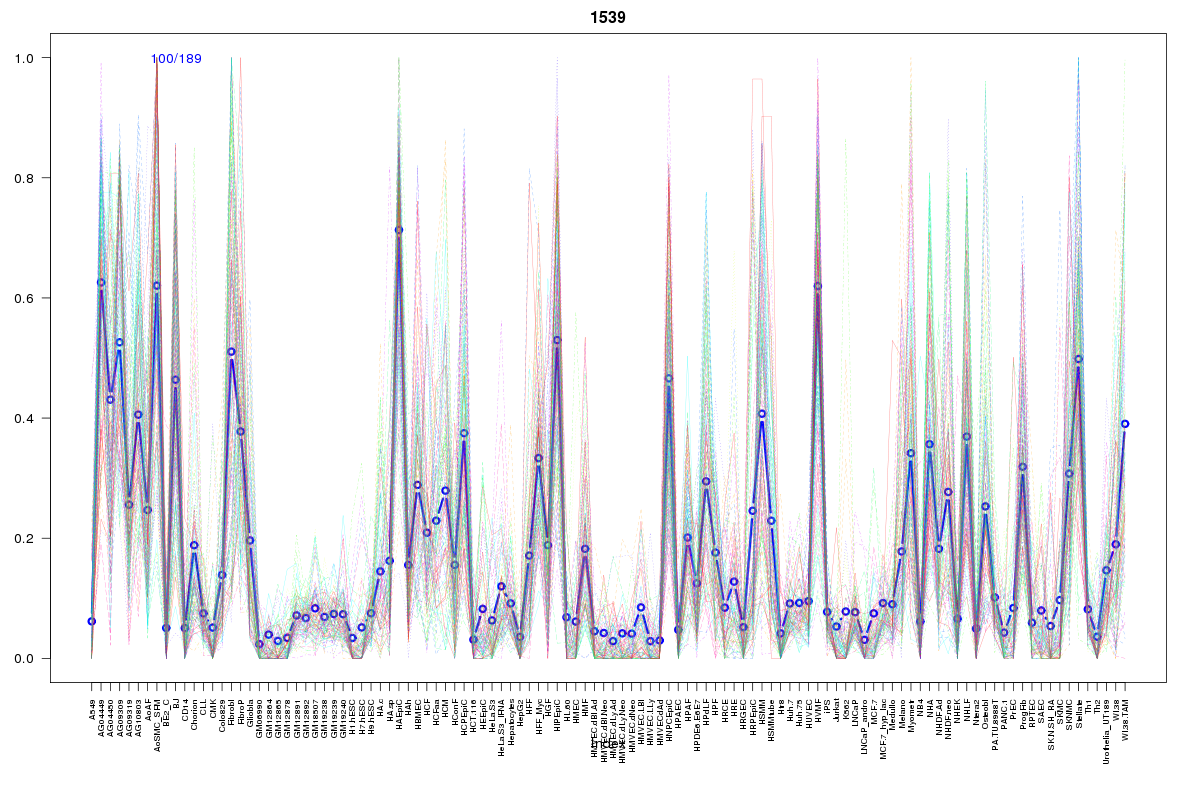 | 1539 | 1 |
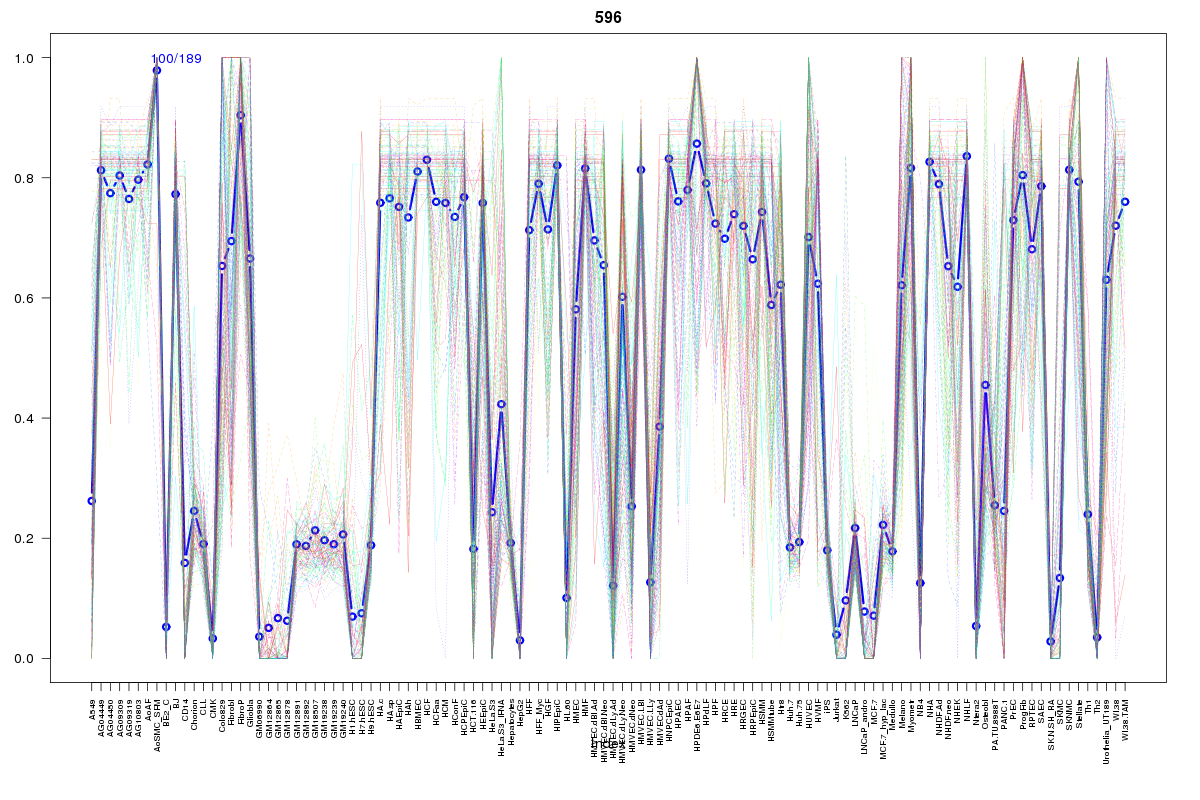 | 596 | 1 |
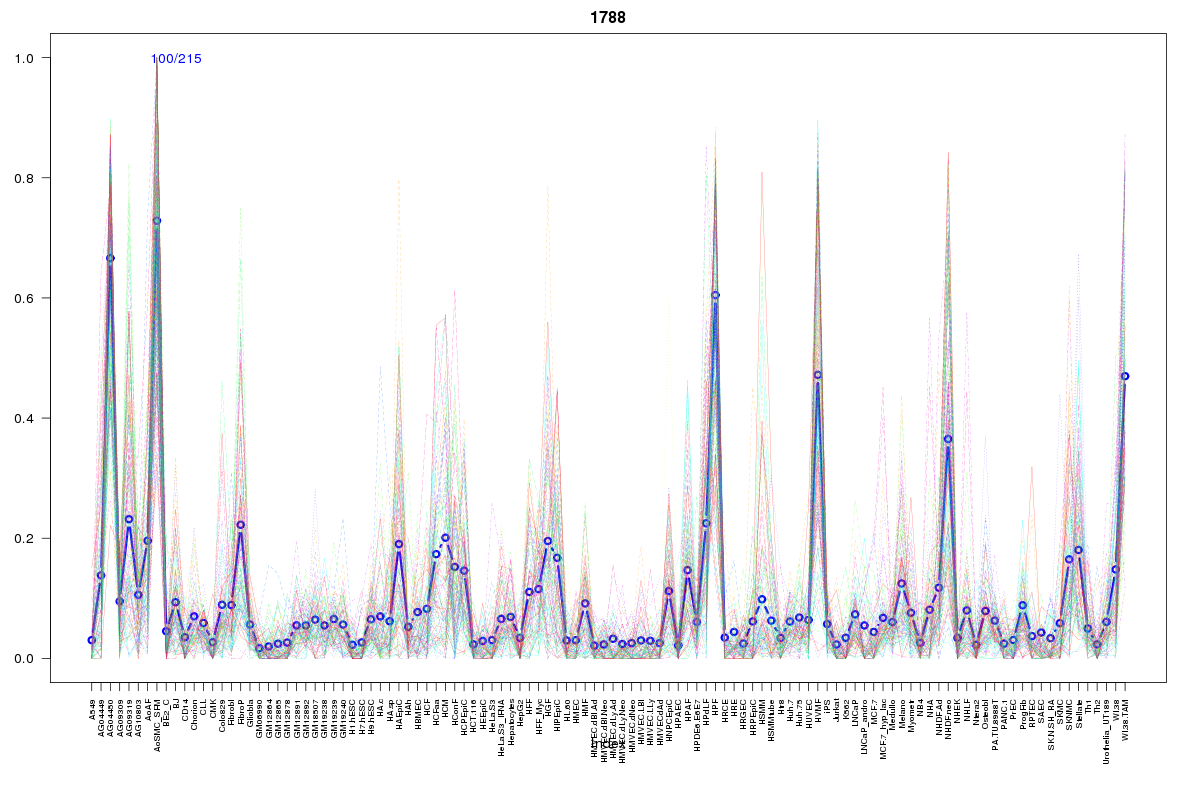 | 1788 | 1 |
 | 881 | 1 |
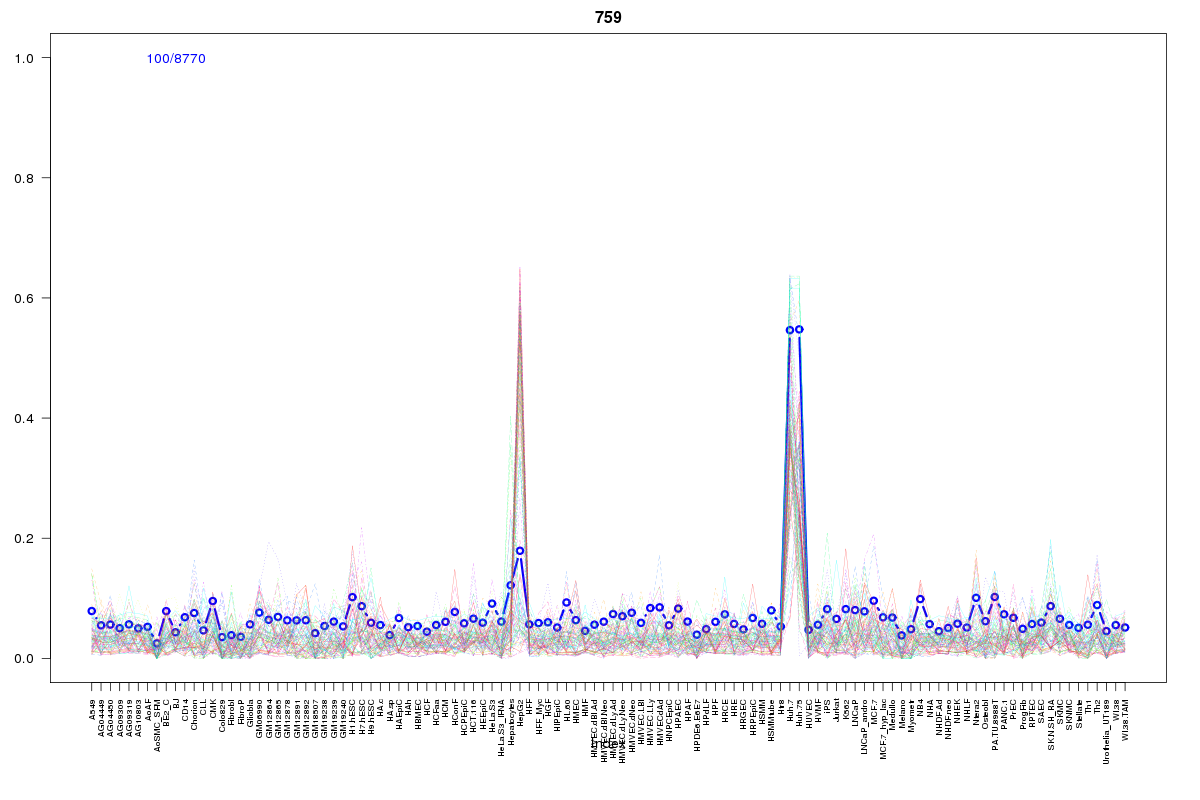 | 759 | 1 |
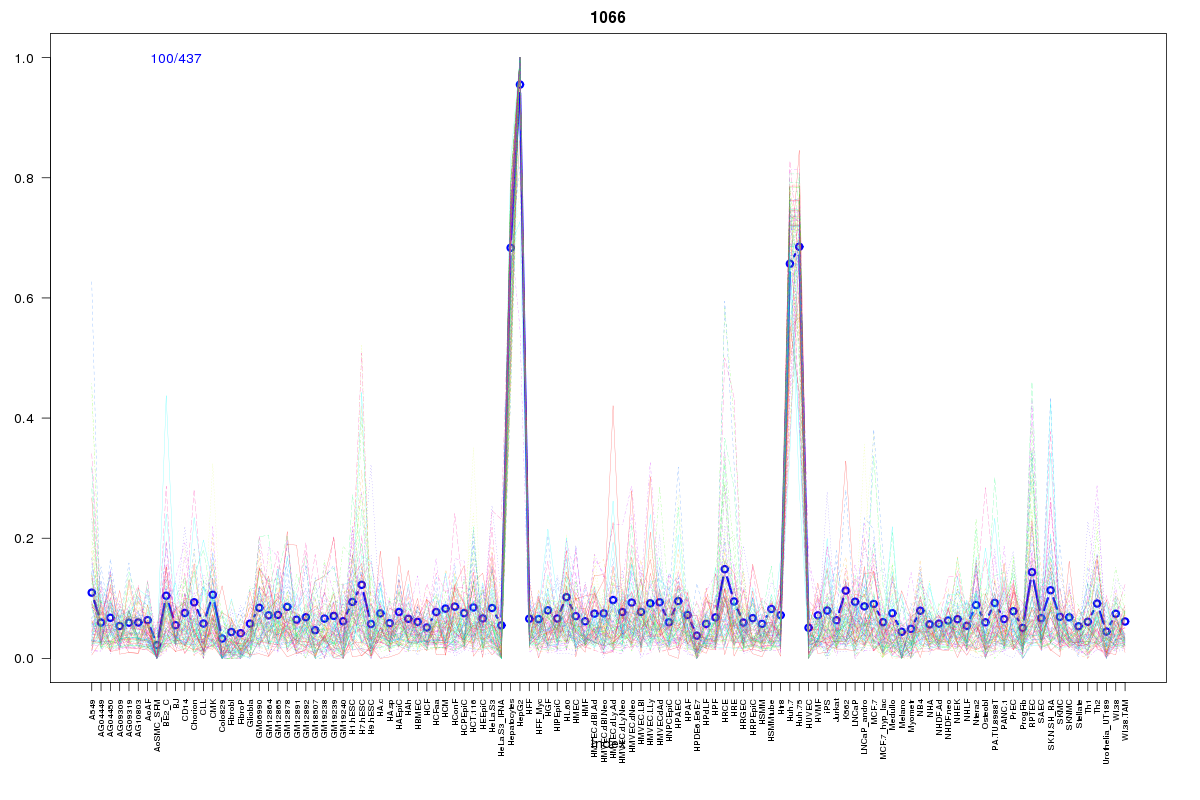 | 1066 | 1 |
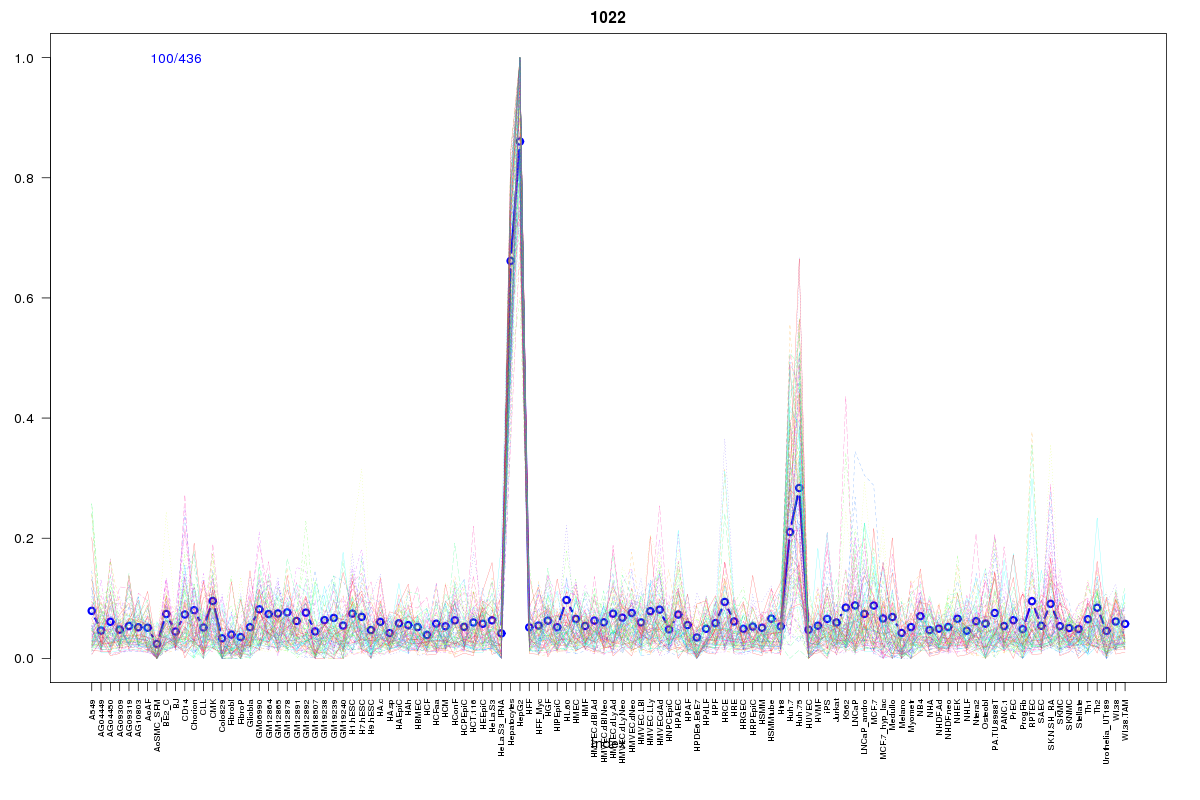 | 1022 | 1 |
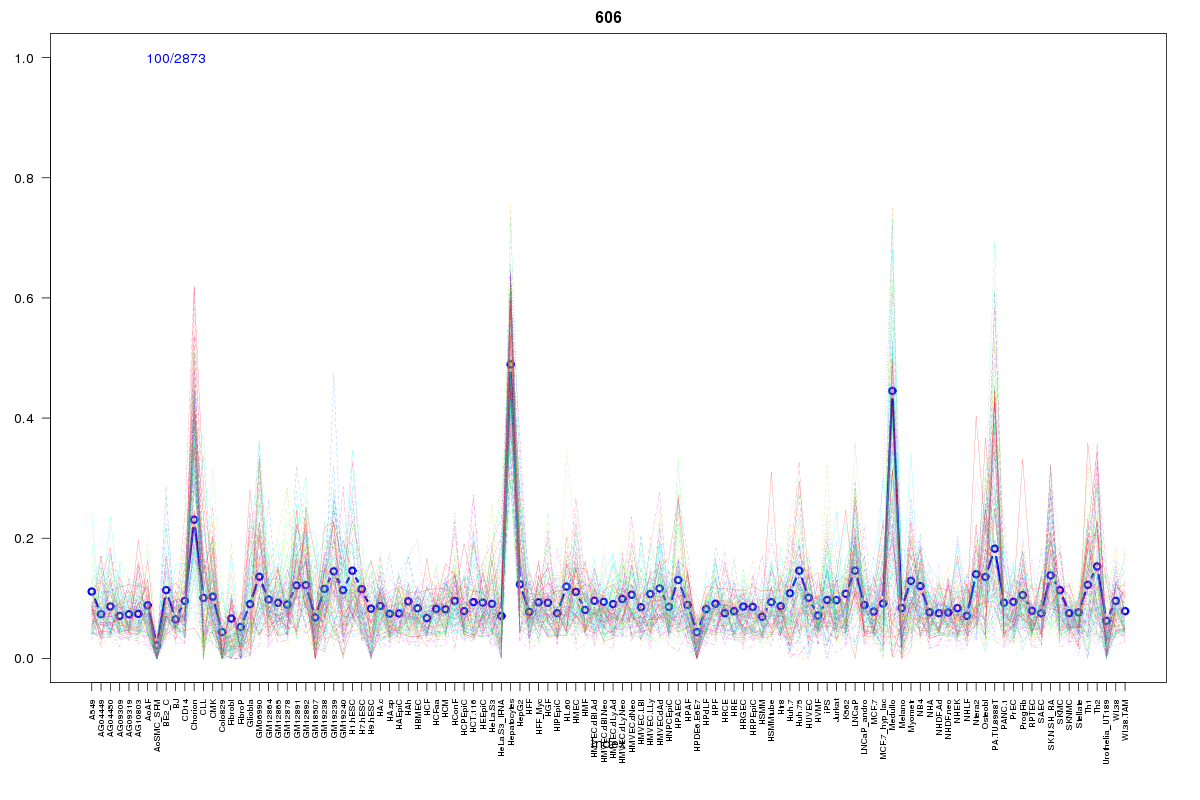 | 606 | 1 |
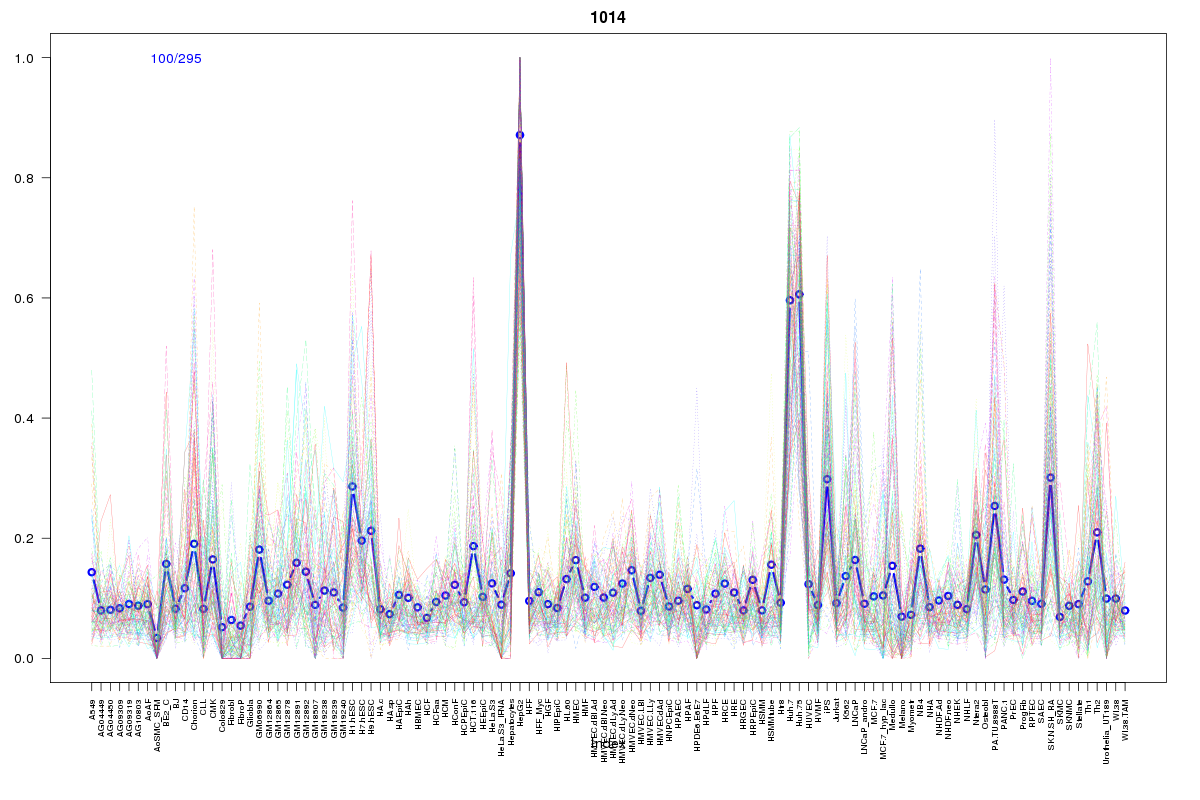 | 1014 | 1 |
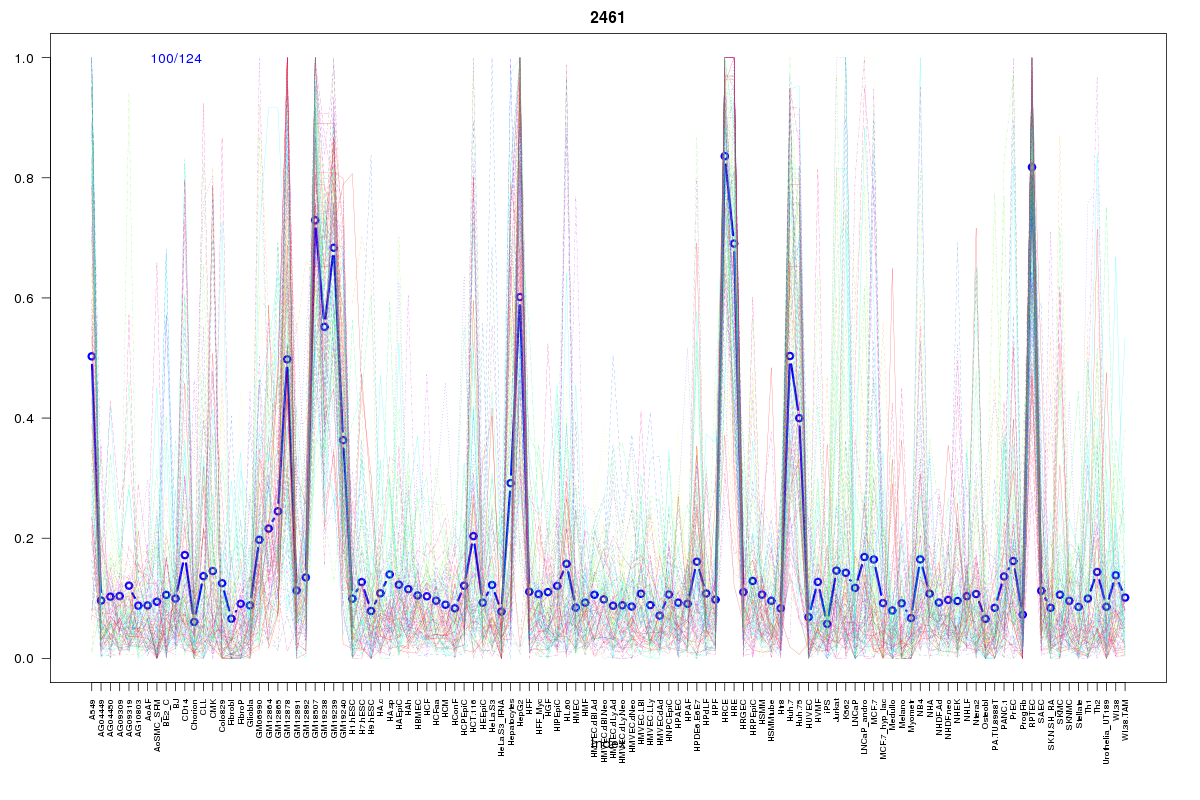 | 2461 | 1 |
Resources
BED file downloads
Connects to 22 DHS sitesTop 10 Correlated DHS Sites
p-values indiciate significant higher or lower correlation| Location | Cluster | P-value |
|---|---|---|
| chr1:204235725-204235875 | 1064 | 0.004 |
| chr1:204183200-204183350 | 2194 | 0.004 |
| chr1:204114280-204114430 | 1066 | 0.006 |
| chr1:204116160-204116310 | 1022 | 0.006 |
| chr1:204099460-204099610 | 2485 | 0.01 |
| chr1:204158005-204158155 | 927 | 0.01 |
| chr1:204131600-204131750 | 2194 | 0.011 |
| chr1:204120000-204120150 | 606 | 0.011 |
| chr1:204182825-204182975 | 1014 | 0.013 |
| chr1:204249285-204249575 | 1010 | 0.015 |
| chr1:204095545-204095695 | 927 | 0.016 |
External Databases
UCSCEnsembl (ENSG00000174567)