Gene: SLCO2A1
chr3: 133651539-133748920Expression Profile
(log scale)
Graphical Connections
Distribution of linked clusters:
You may find it interesting if many of the connected DHS sites belong to the same cluster.| Cluster Profile | Cluster ID | Number of DHS sites in this cluster |
|---|---|---|
 | 687 | 7 |
 | 979 | 5 |
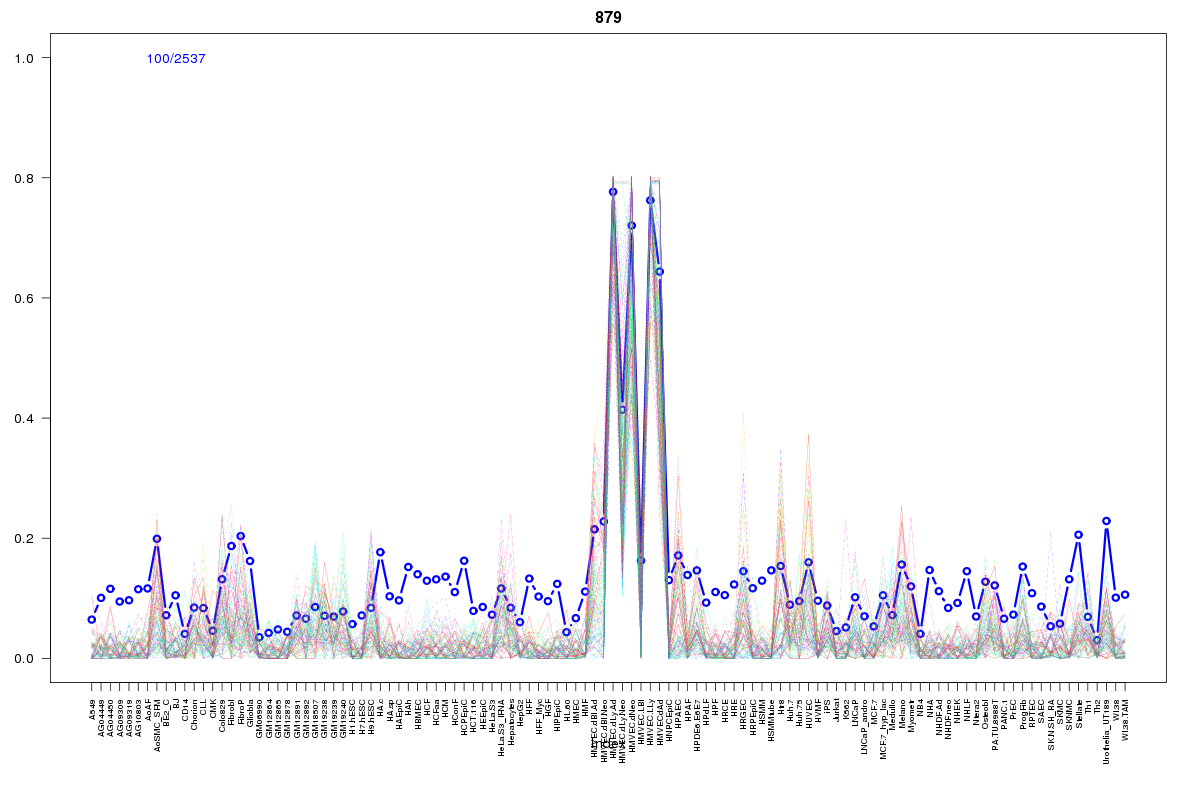 | 879 | 3 |
 | 934 | 2 |
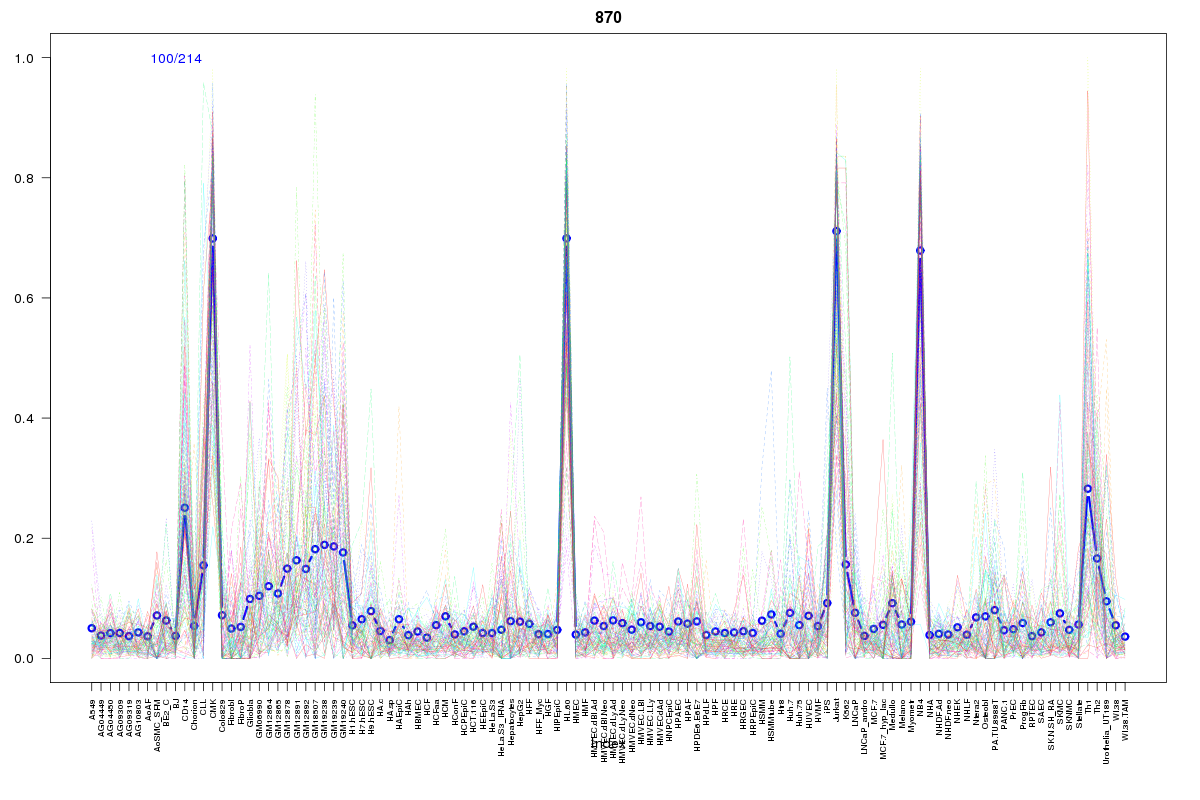 | 870 | 2 |
 | 935 | 2 |
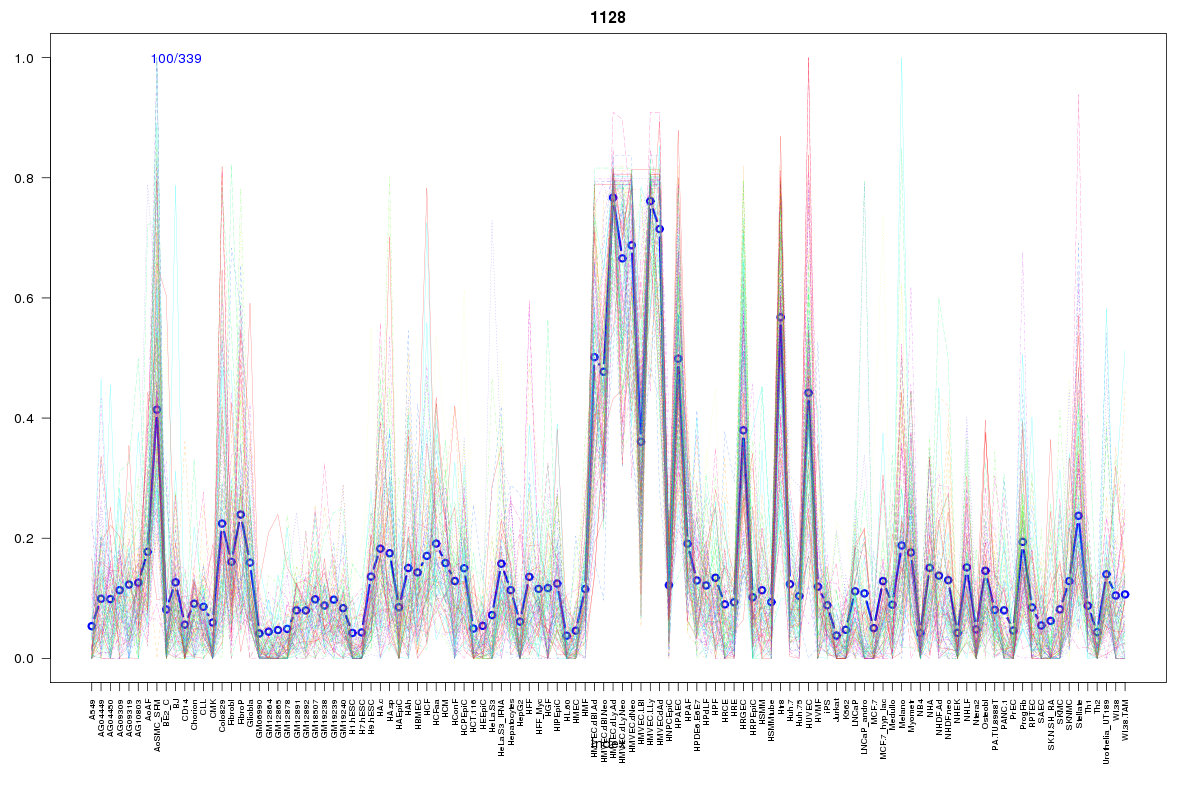 | 1128 | 1 |
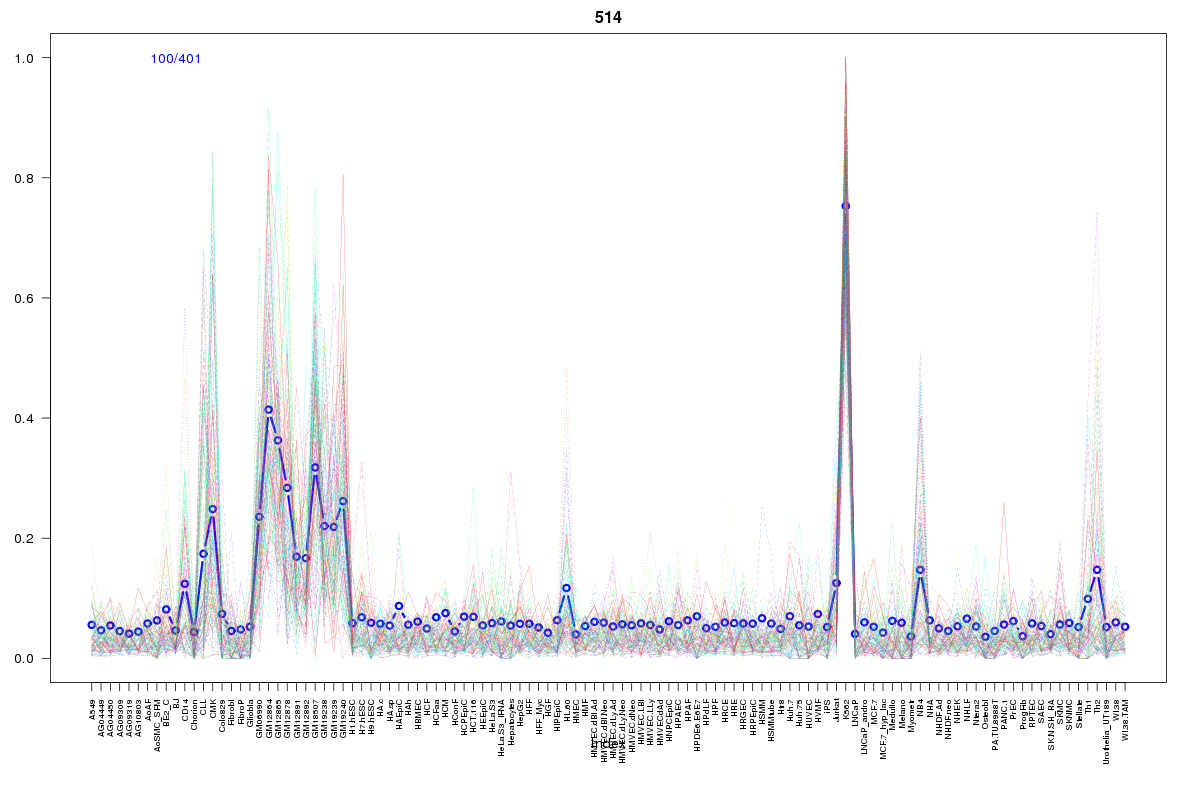 | 514 | 1 |
 | 739 | 1 |
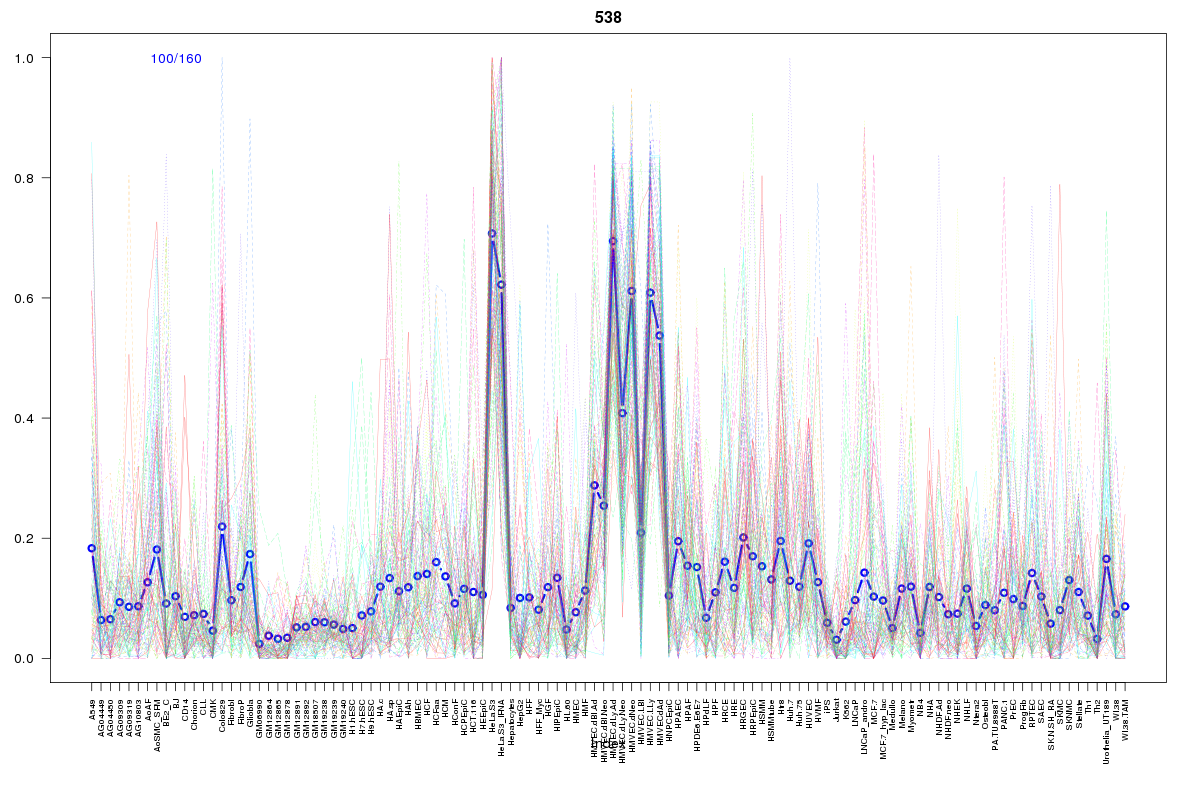 | 538 | 1 |
 | 1008 | 1 |
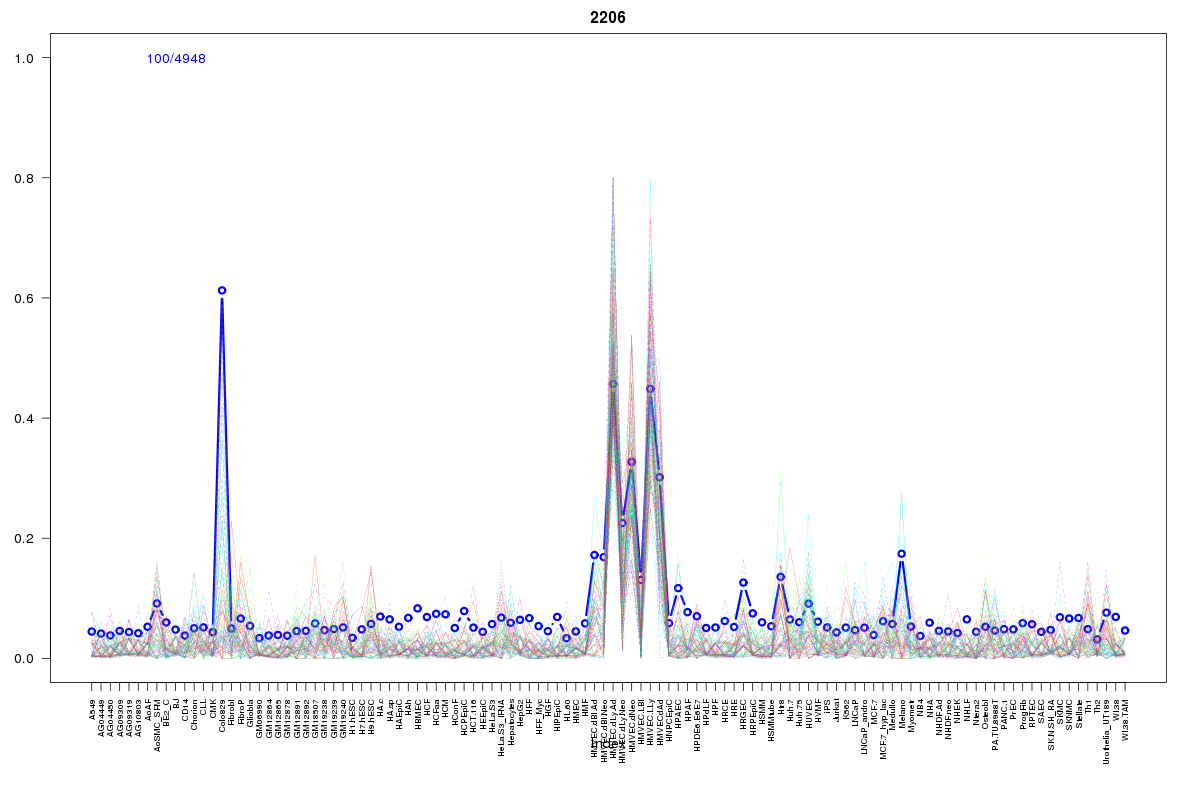 | 2206 | 1 |
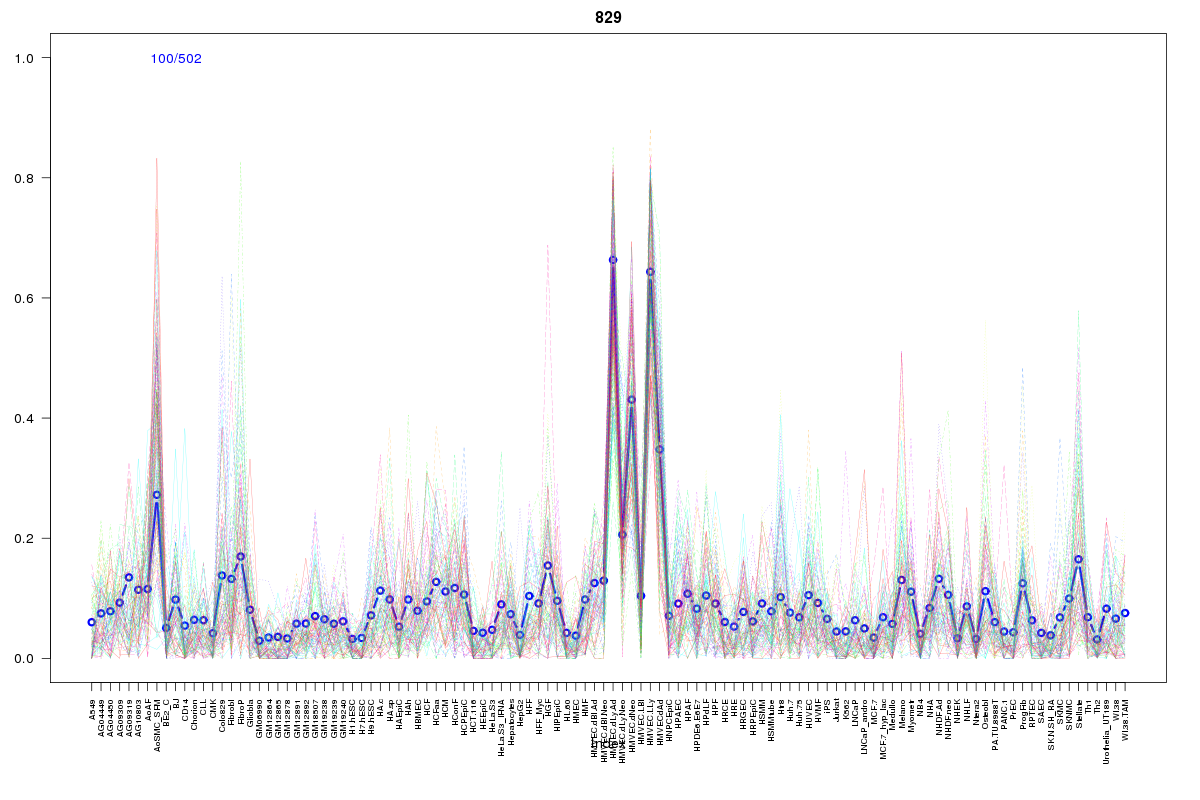 | 829 | 1 |
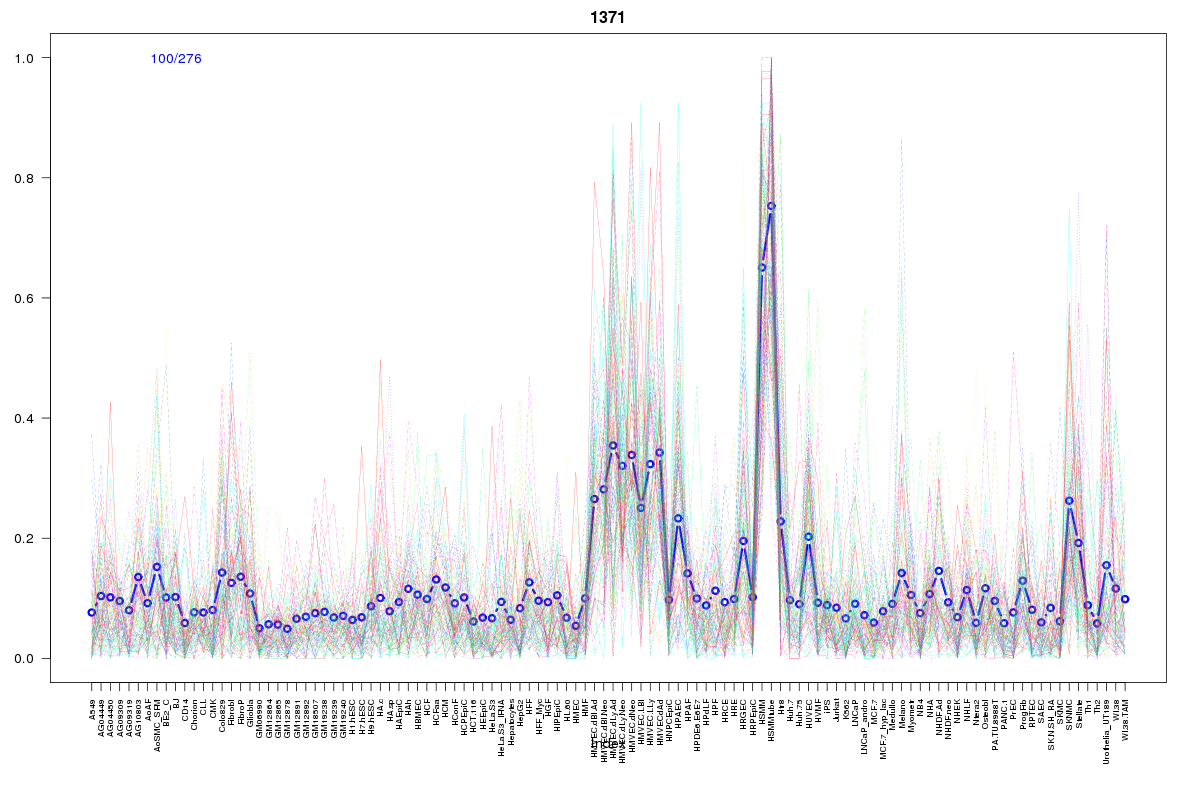 | 1371 | 1 |
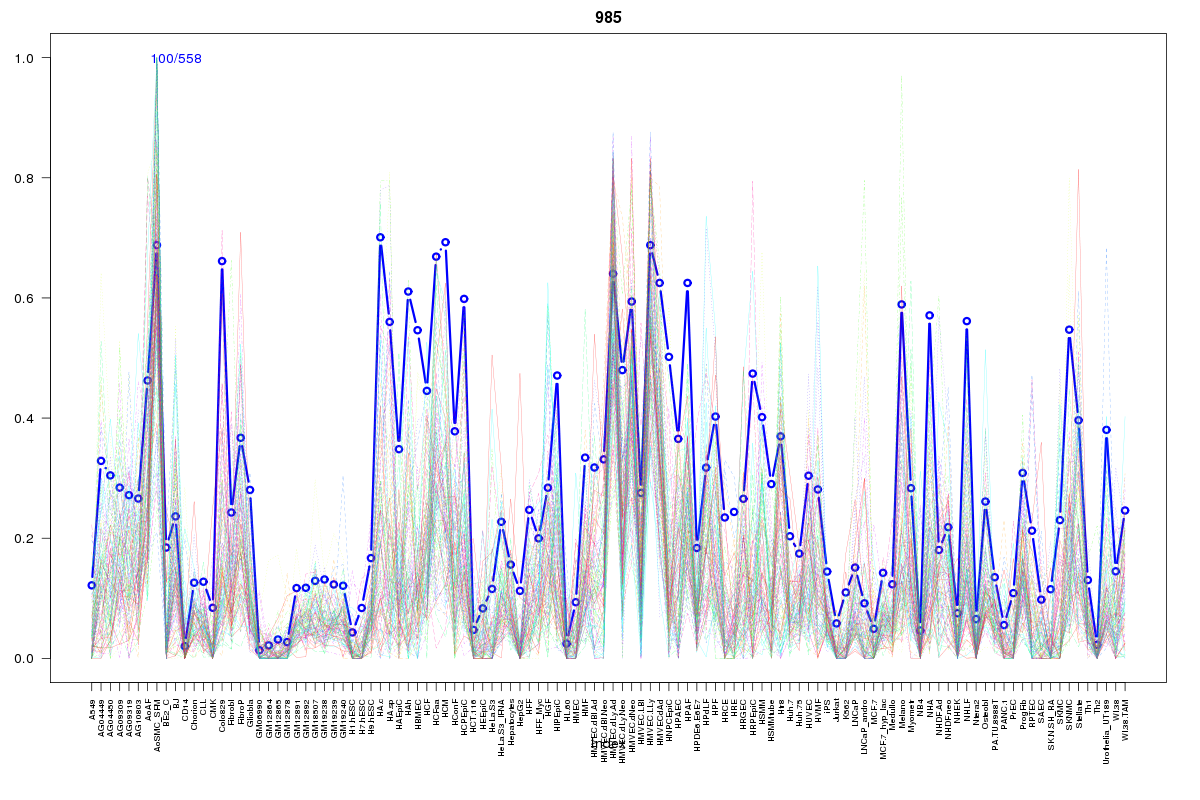 | 985 | 1 |
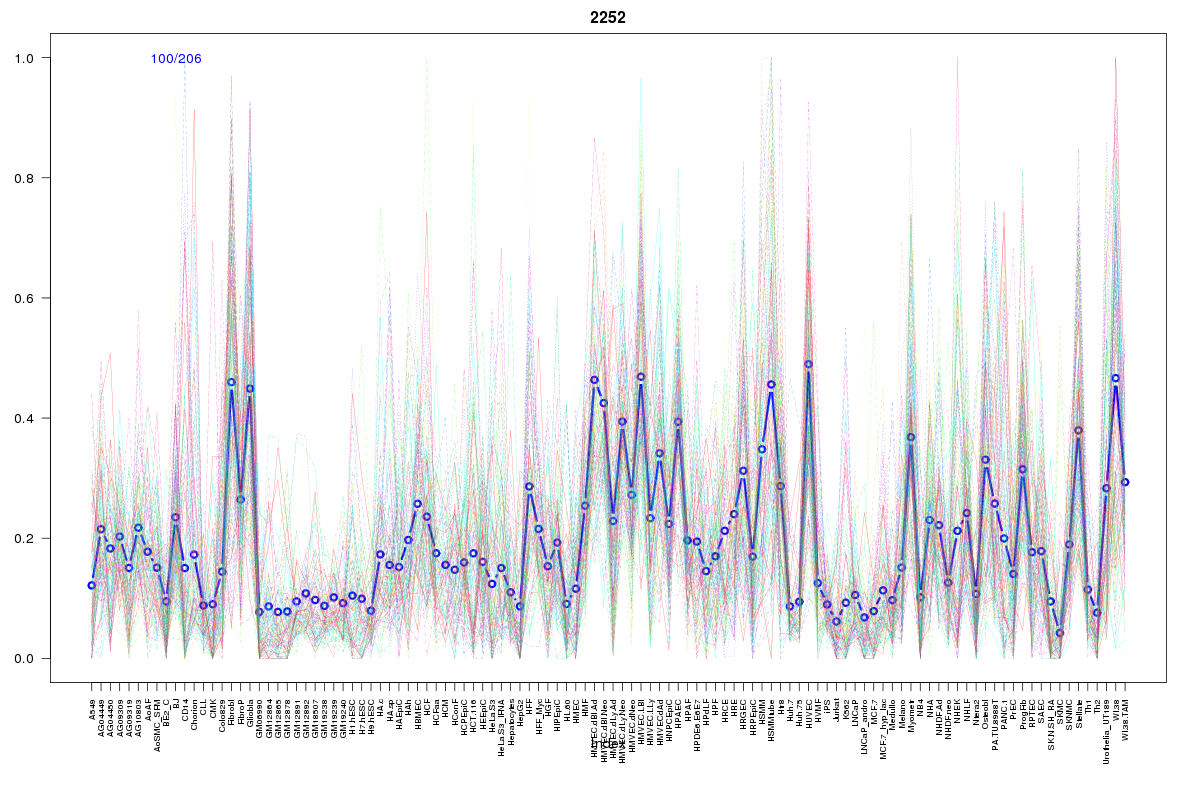 | 2252 | 1 |
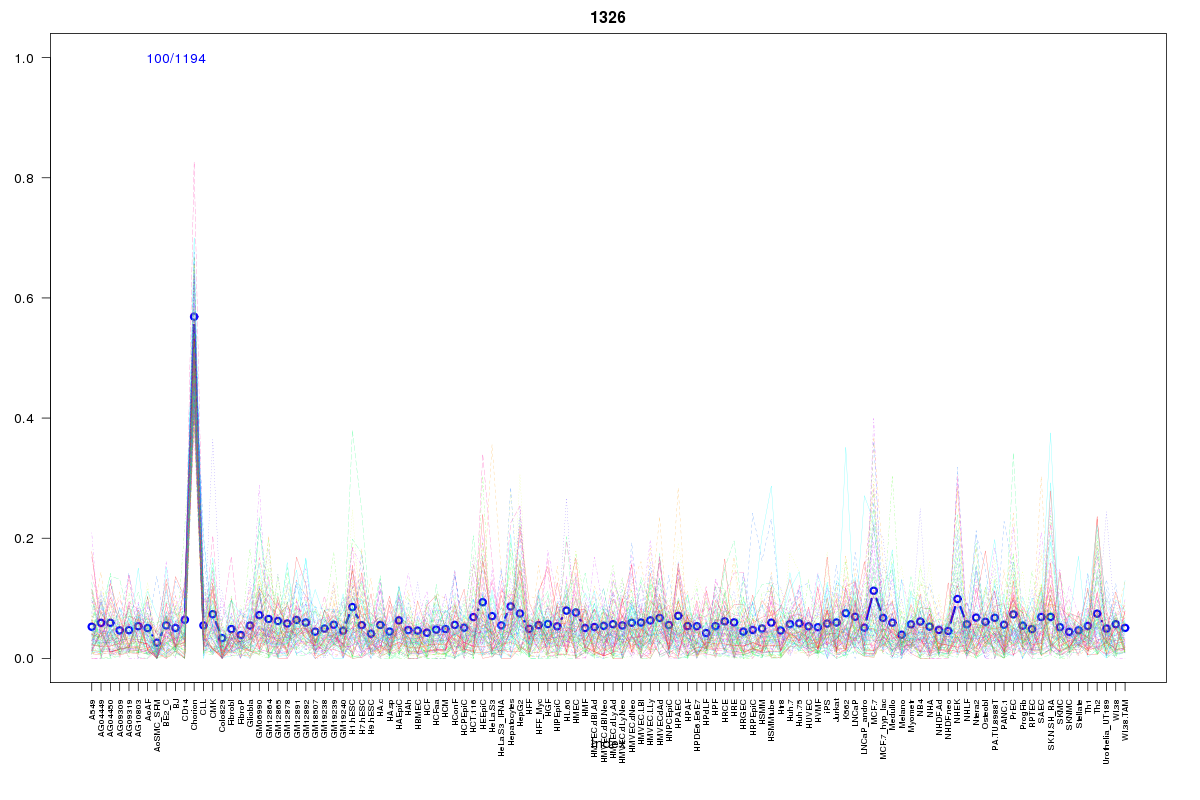 | 1326 | 1 |
 | 2164 | 1 |
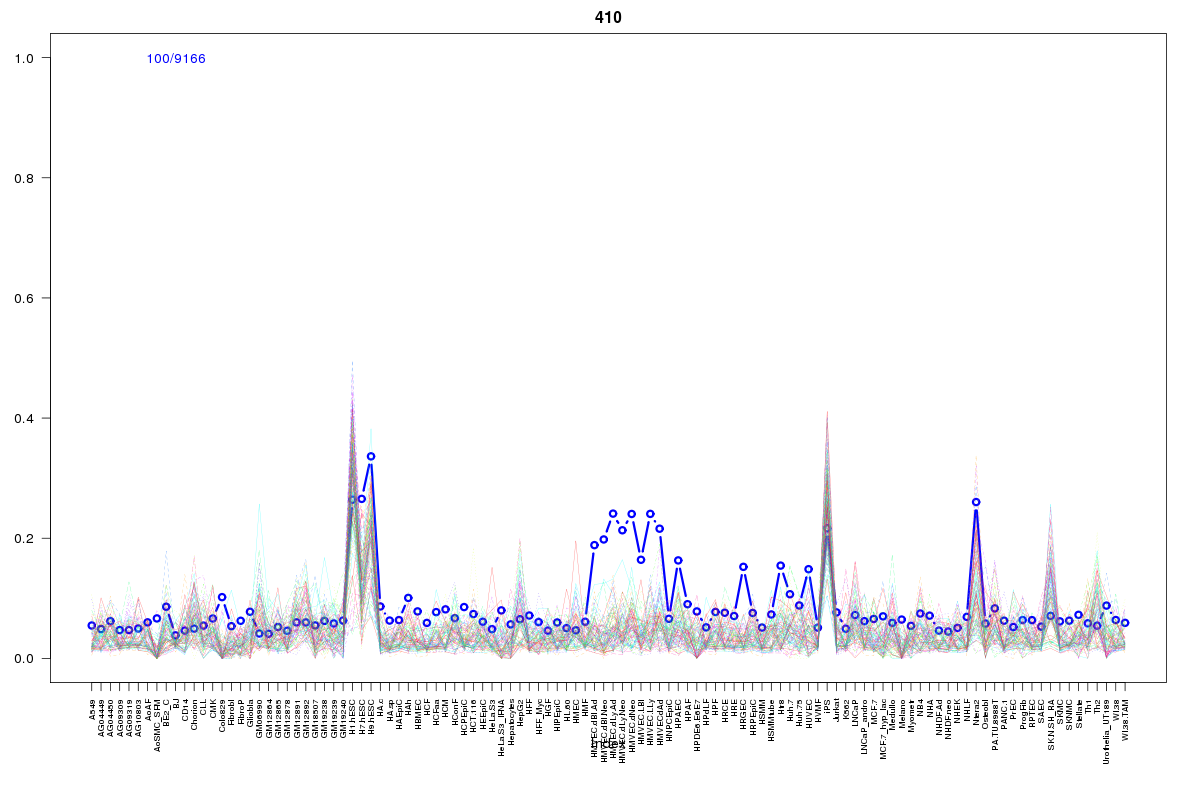 | 410 | 1 |
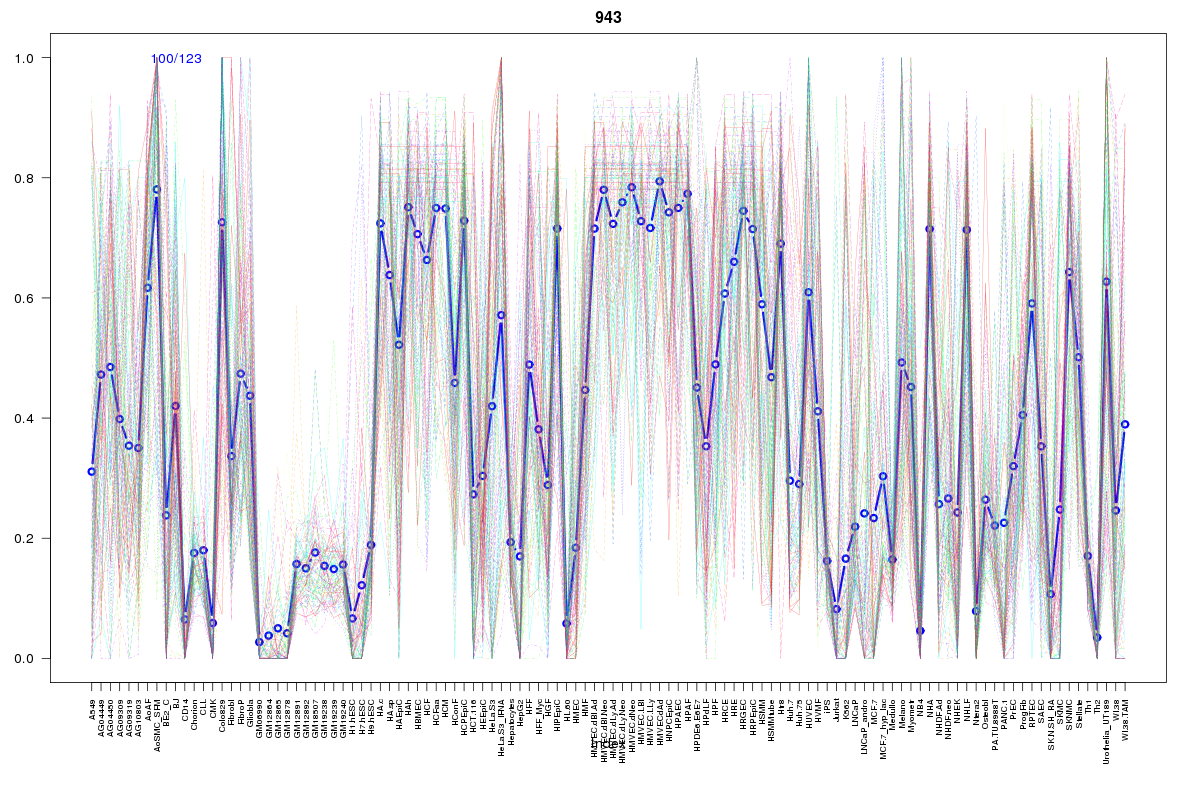 | 943 | 1 |
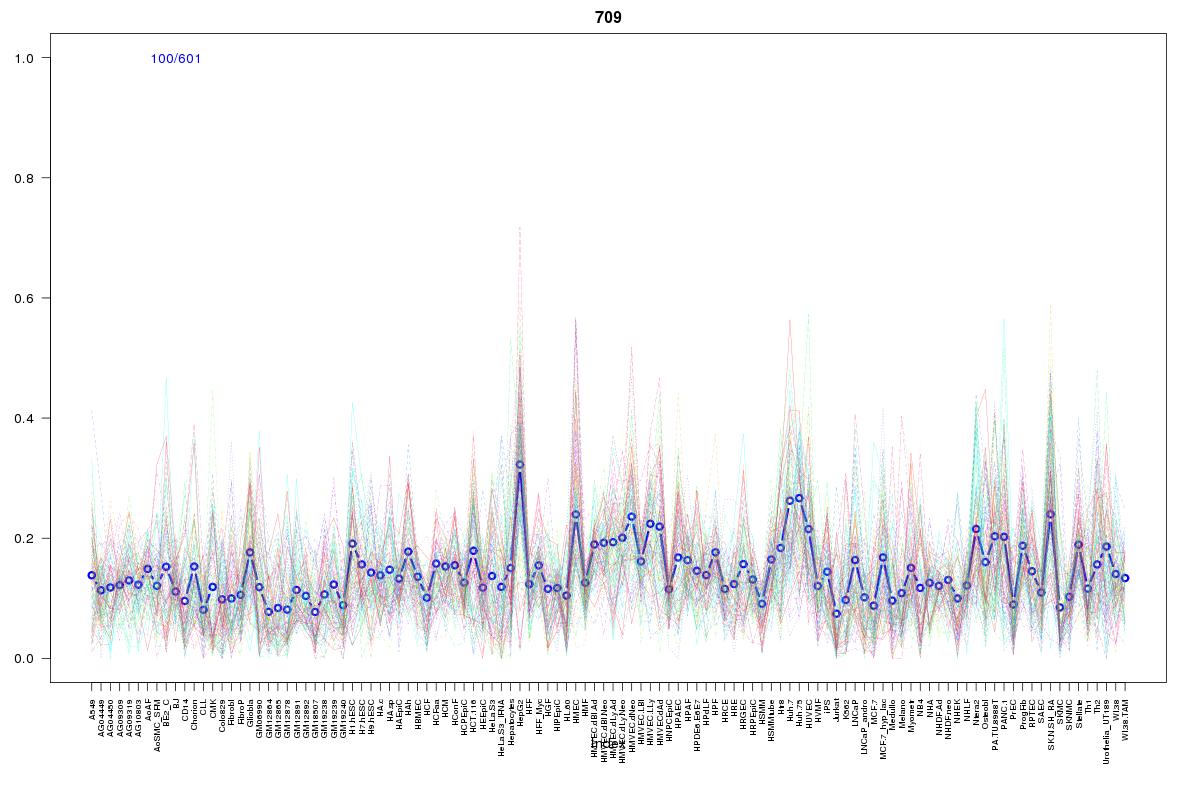 | 709 | 1 |
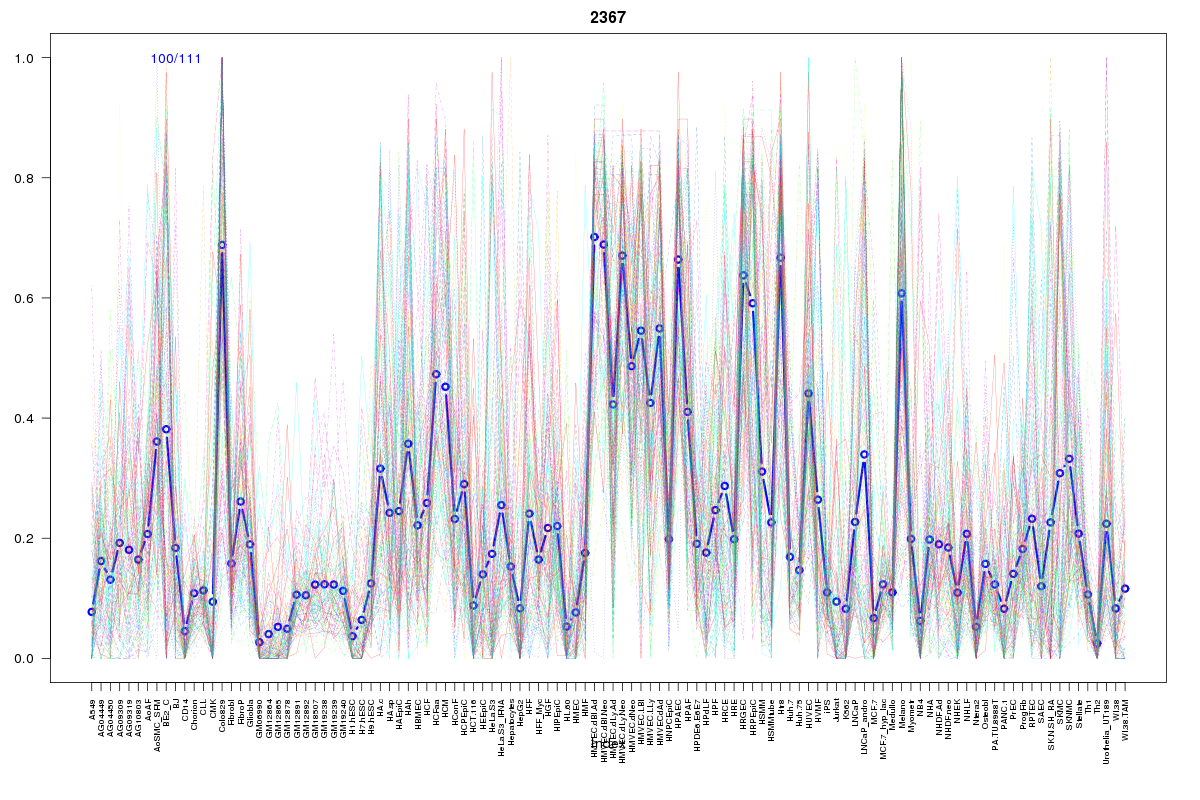 | 2367 | 1 |
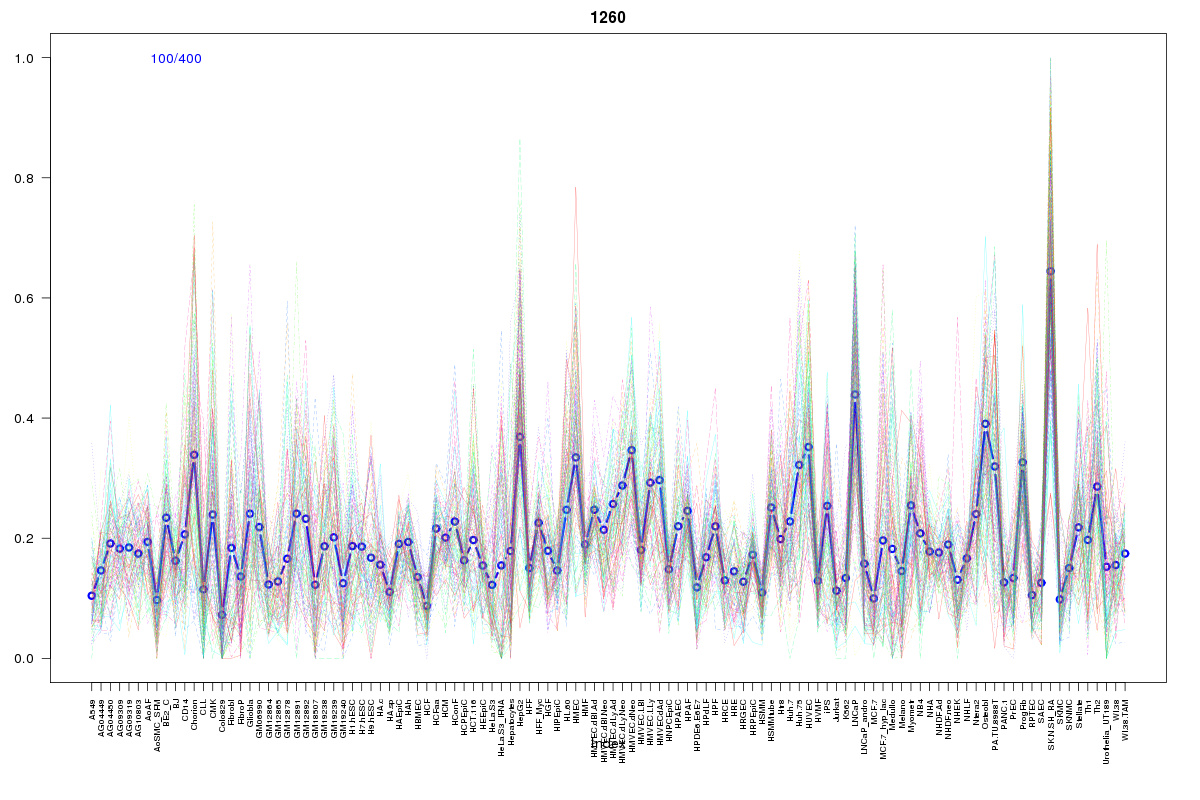 | 1260 | 1 |
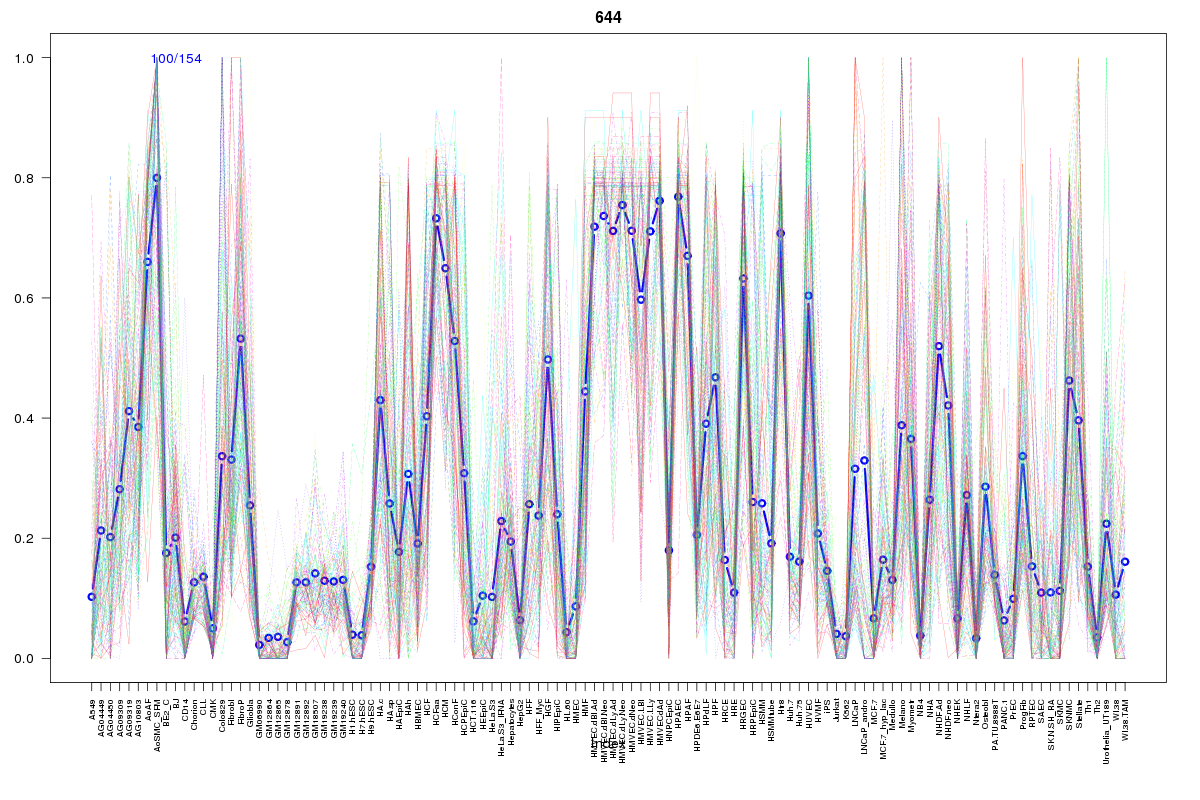 | 644 | 1 |
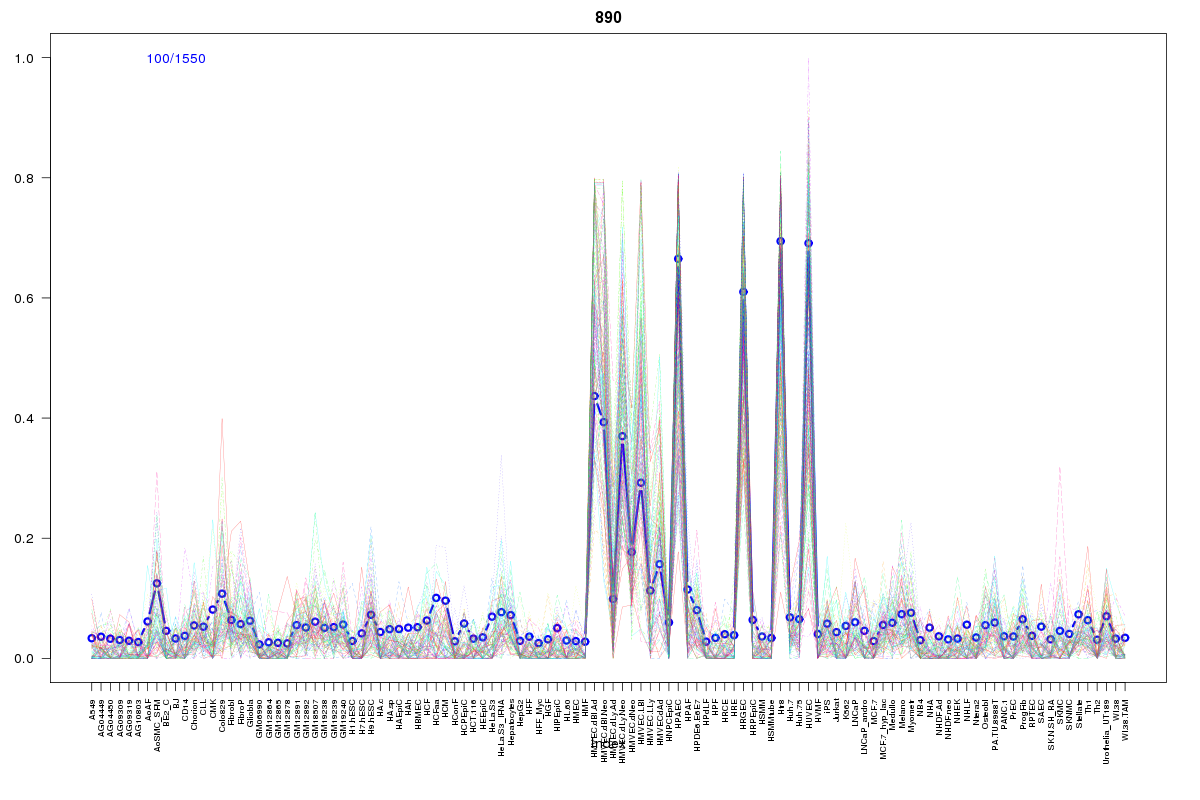 | 890 | 1 |
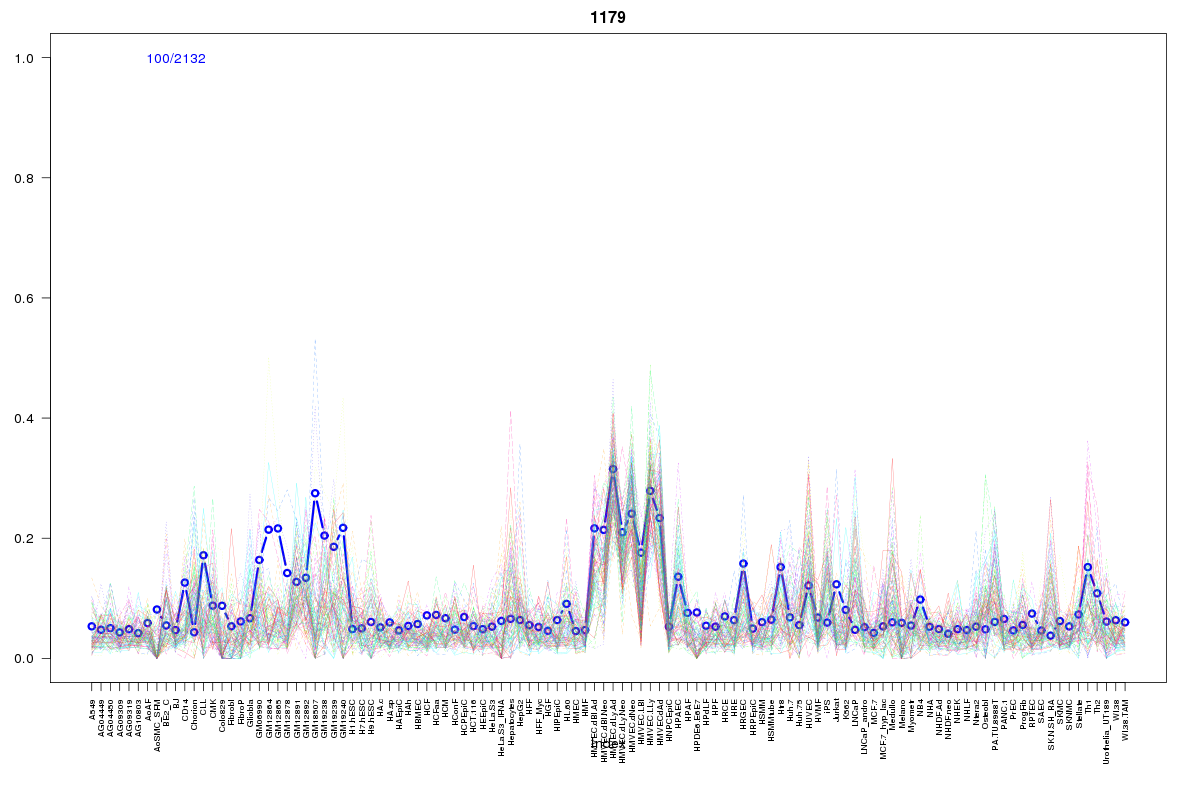 | 1179 | 1 |
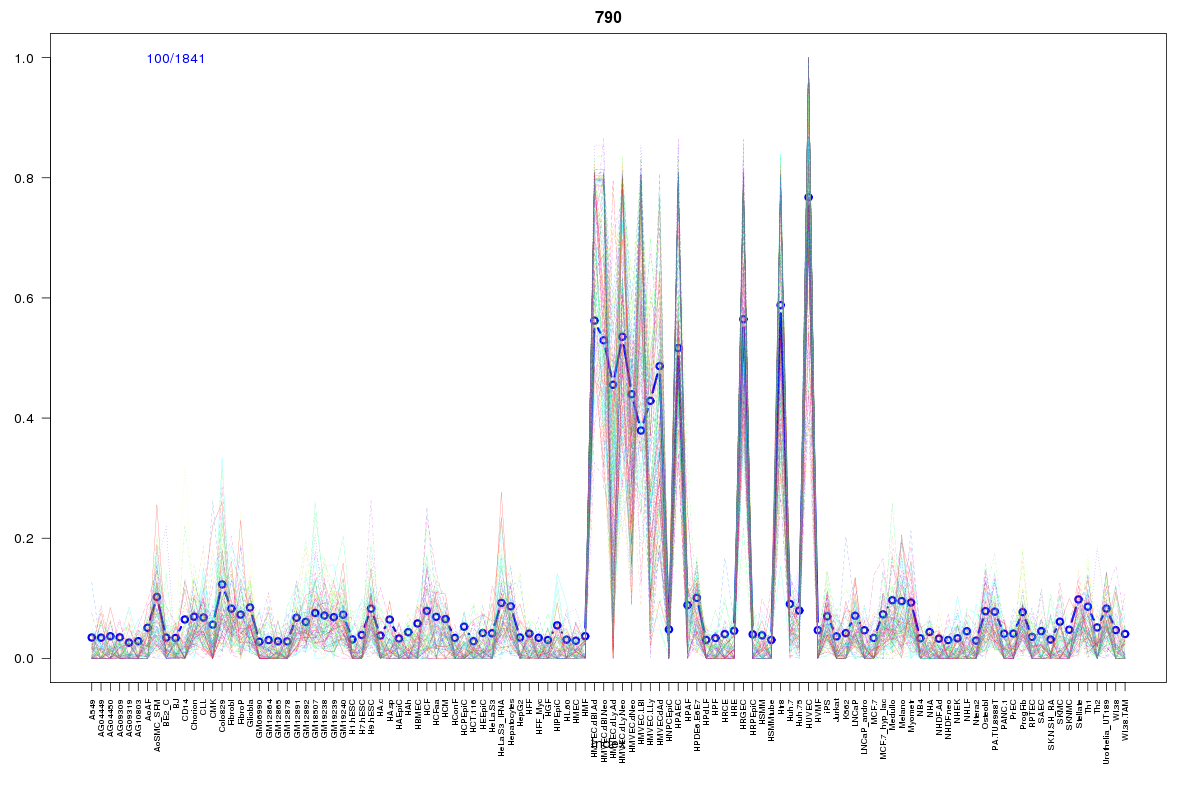 | 790 | 1 |
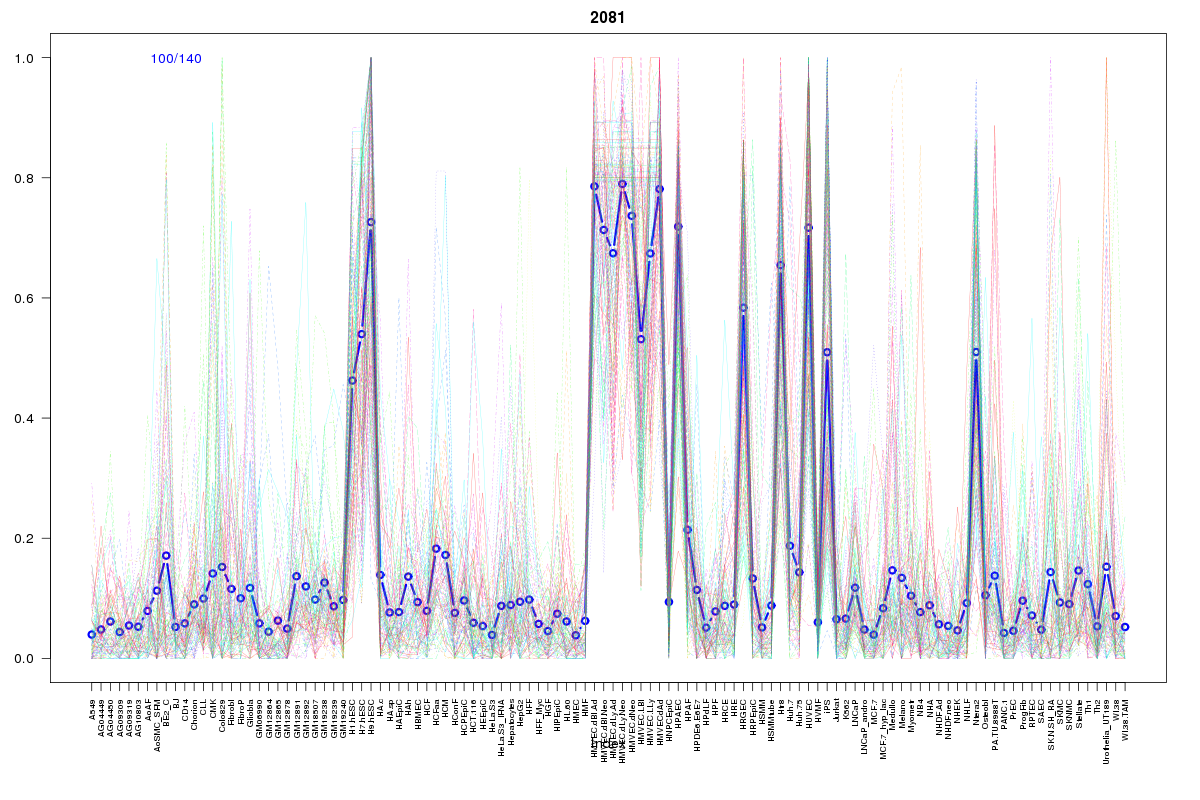 | 2081 | 1 |
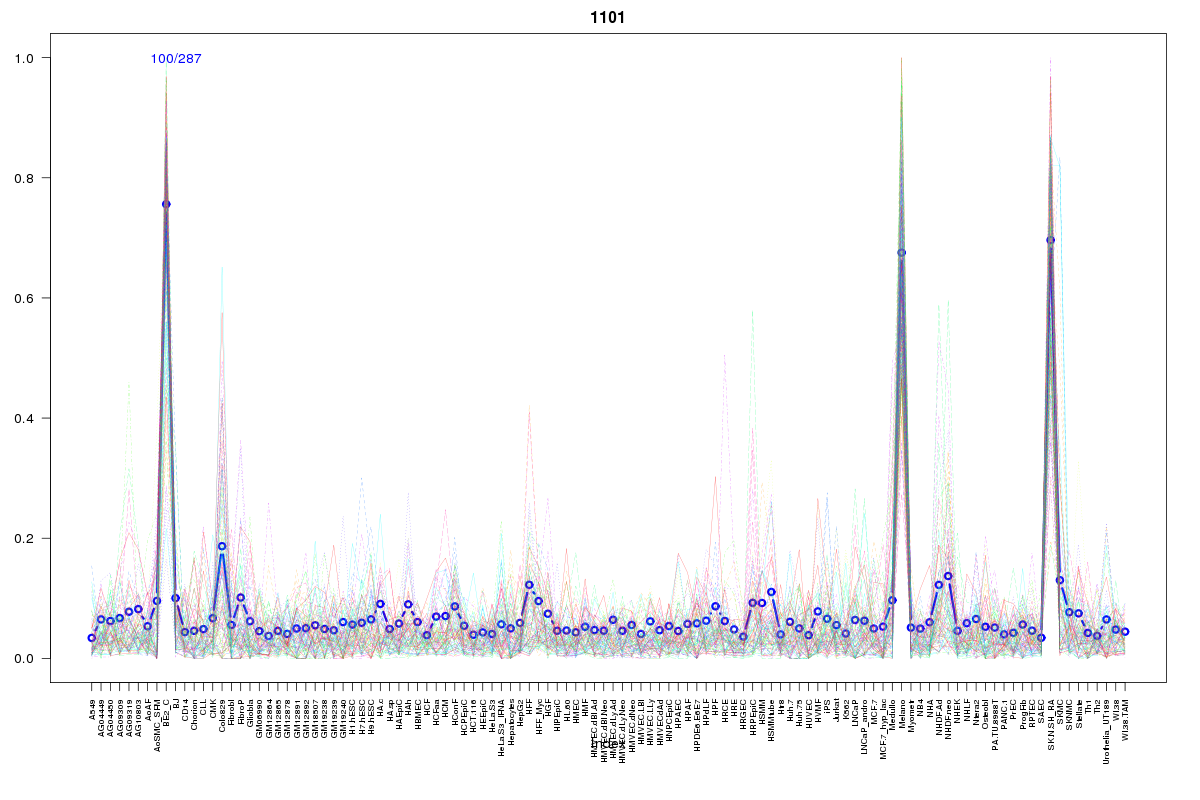 | 1101 | 1 |
Resources
BED file downloads
Connects to 44 DHS sitesTop 10 Correlated DHS Sites
p-values indiciate significant higher or lower correlation| Location | Cluster | P-value |
|---|---|---|
| chr3:133710180-133710330 | 538 | 0 |
| chr3:133698520-133698670 | 739 | 0 |
| chr3:133705720-133705870 | 687 | 0.001 |
| chr3:133696560-133696710 | 879 | 0.001 |
| chr3:133668480-133668630 | 2081 | 0.002 |
| chr3:133664305-133664455 | 1179 | 0.002 |
| chr3:133660265-133660415 | 829 | 0.002 |
| chr3:133664040-133664190 | 644 | 0.003 |
| chr3:133793620-133793770 | 935 | 0.005 |
| chr3:133663880-133664030 | 2367 | 0.005 |
| chr3:133712140-133712290 | 879 | 0.005 |
External Databases
UCSCEnsembl (ENSG00000174640)