Gene: BOLA1
chr1: 149859439-149872044Expression Profile
(log scale)
Graphical Connections
Distribution of linked clusters:
You may find it interesting if many of the connected DHS sites belong to the same cluster.| Cluster Profile | Cluster ID | Number of DHS sites in this cluster |
|---|---|---|
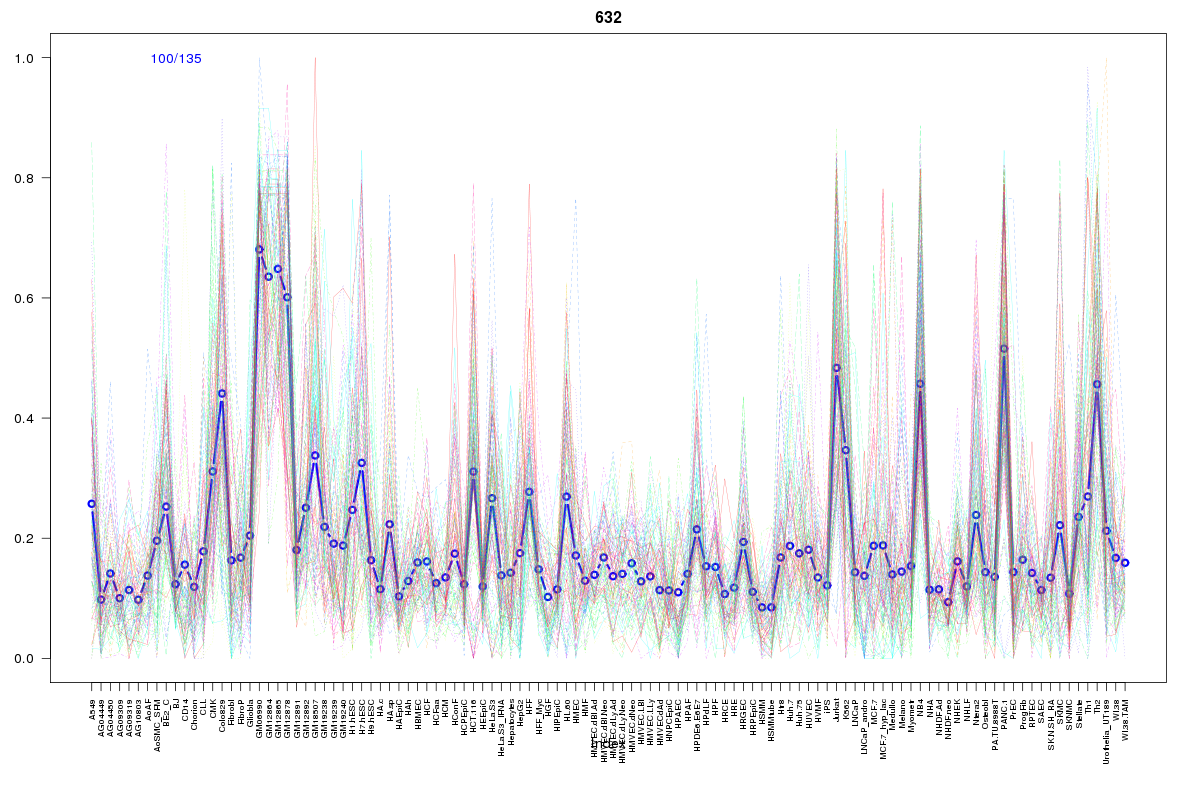 | 632 | 3 |
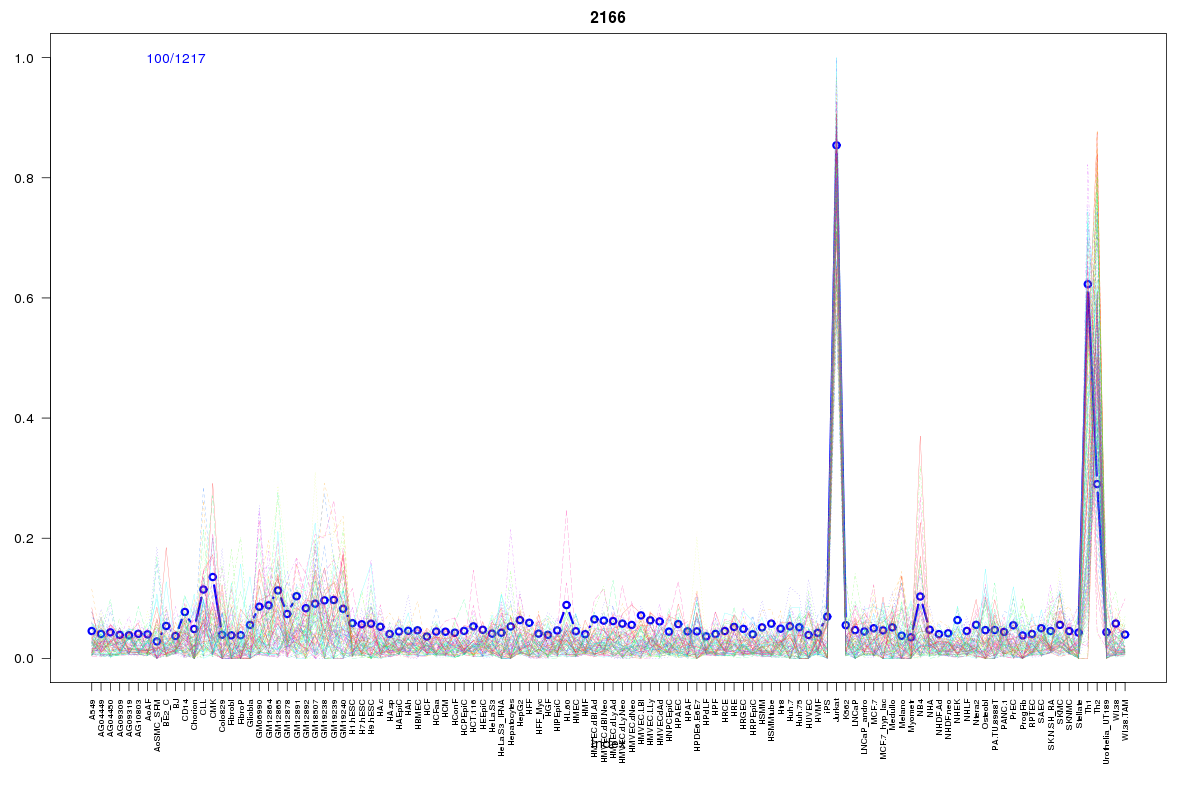 | 2166 | 1 |
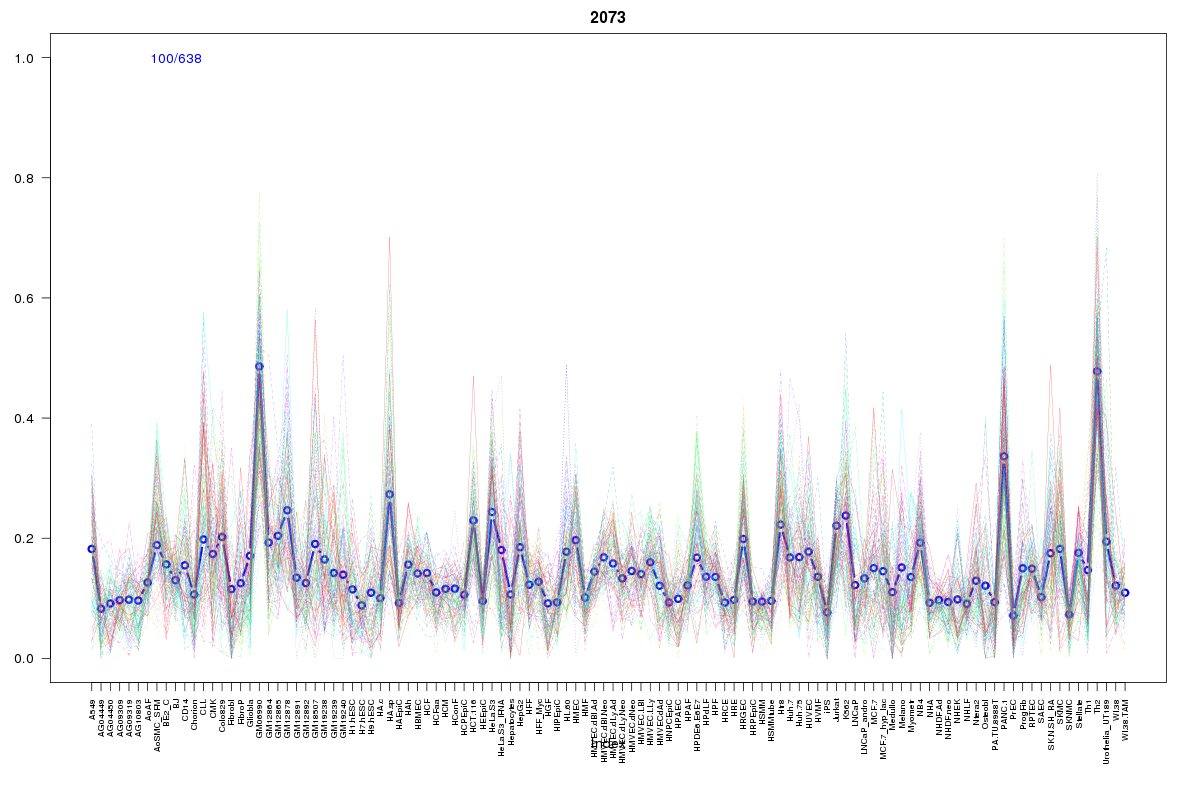 | 2073 | 1 |
 | 1269 | 1 |
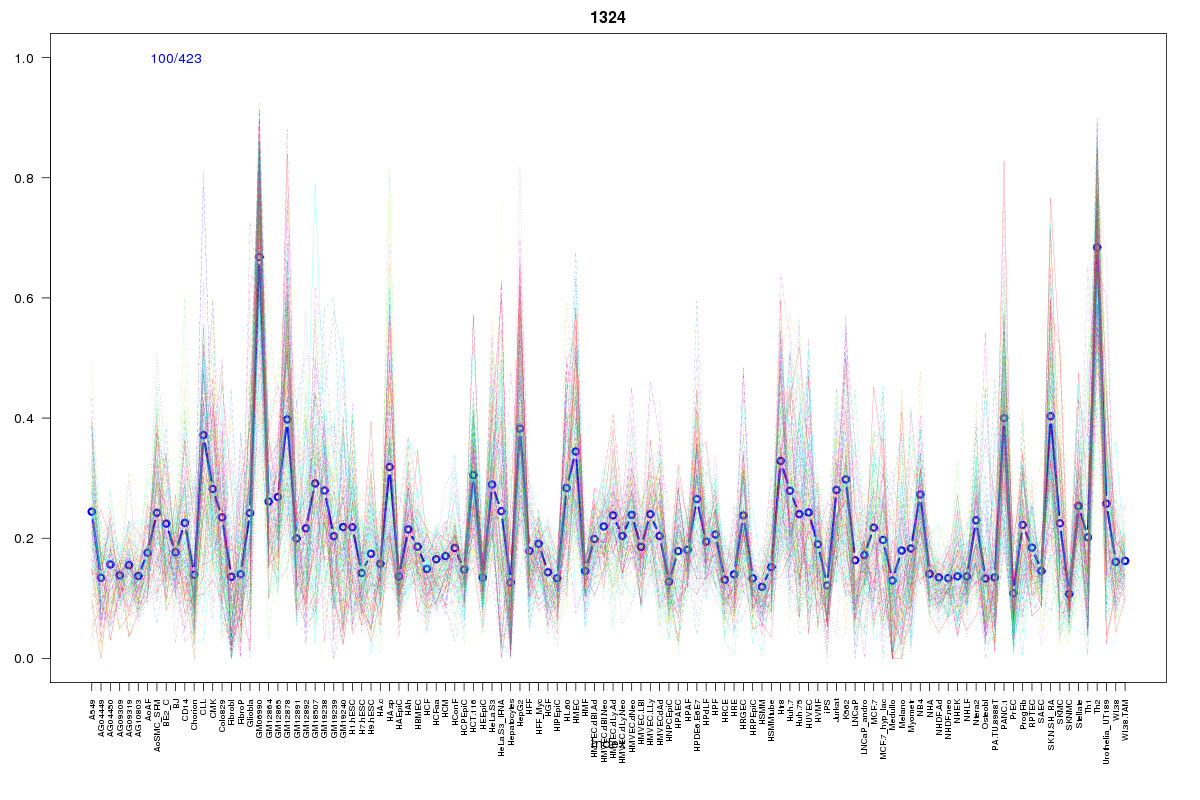 | 1324 | 1 |
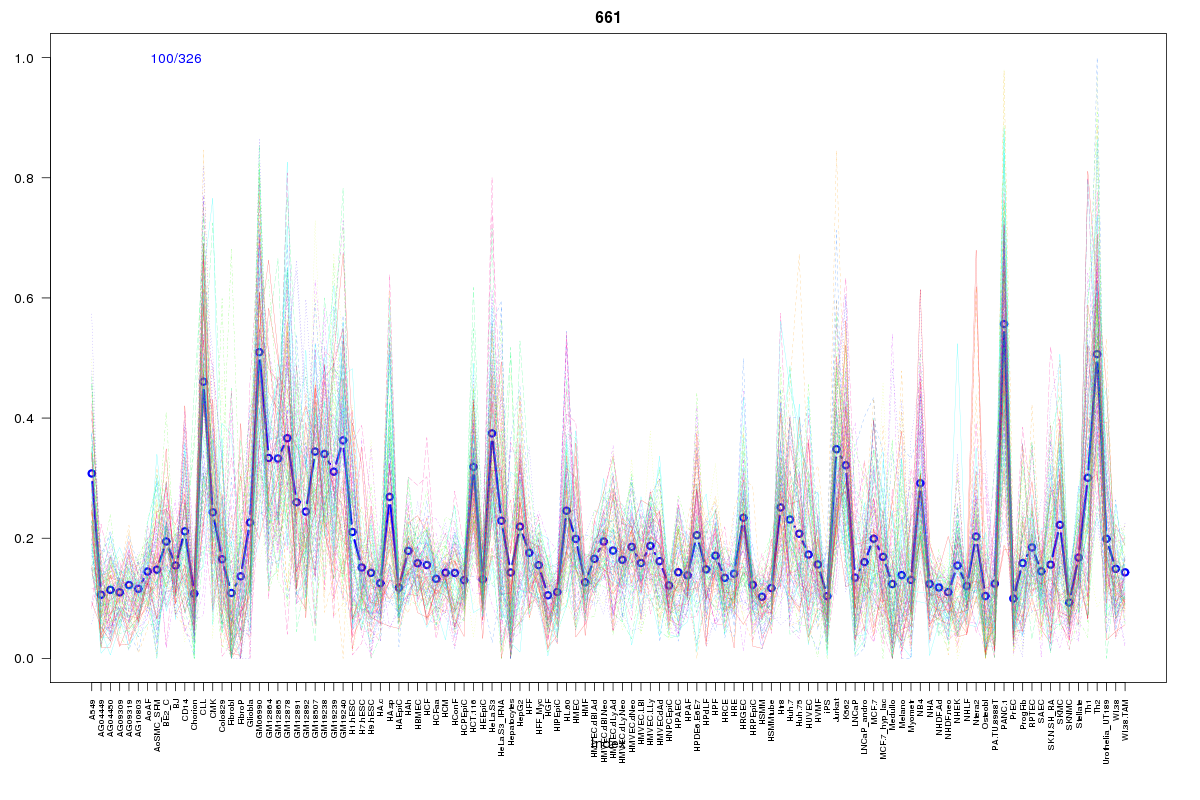 | 661 | 1 |
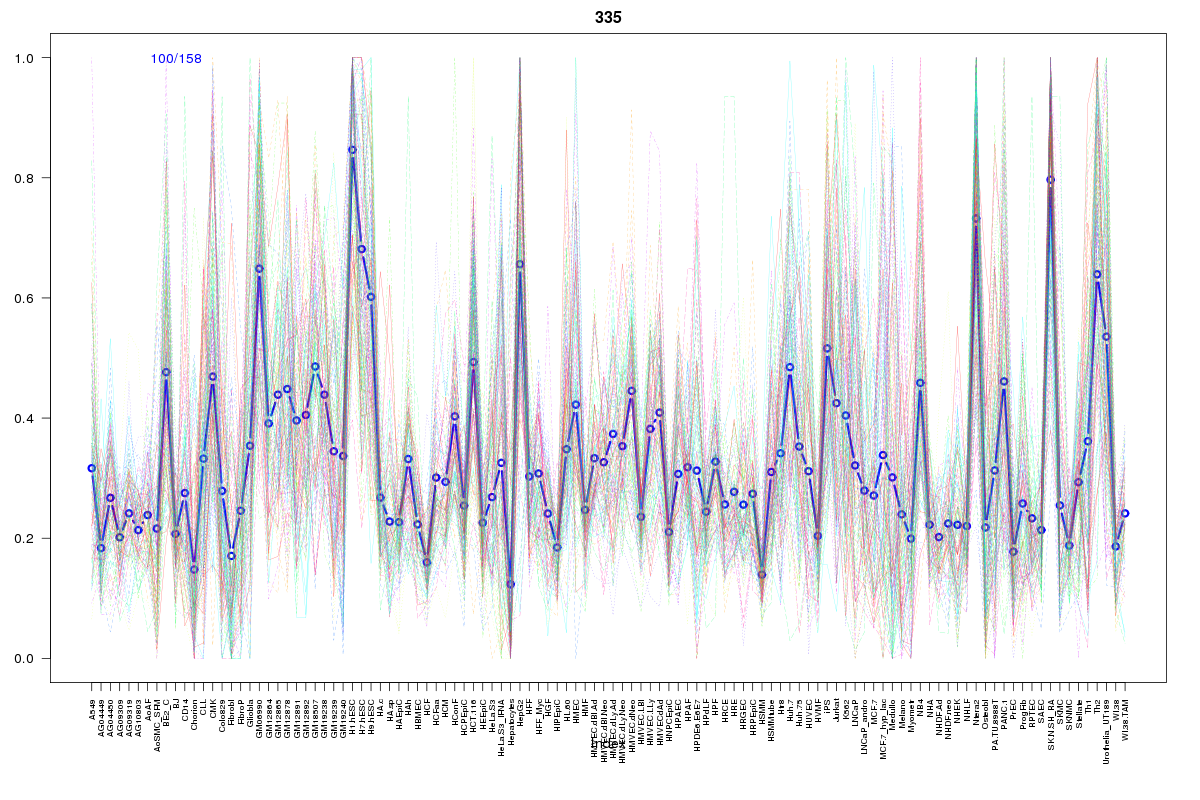 | 335 | 1 |
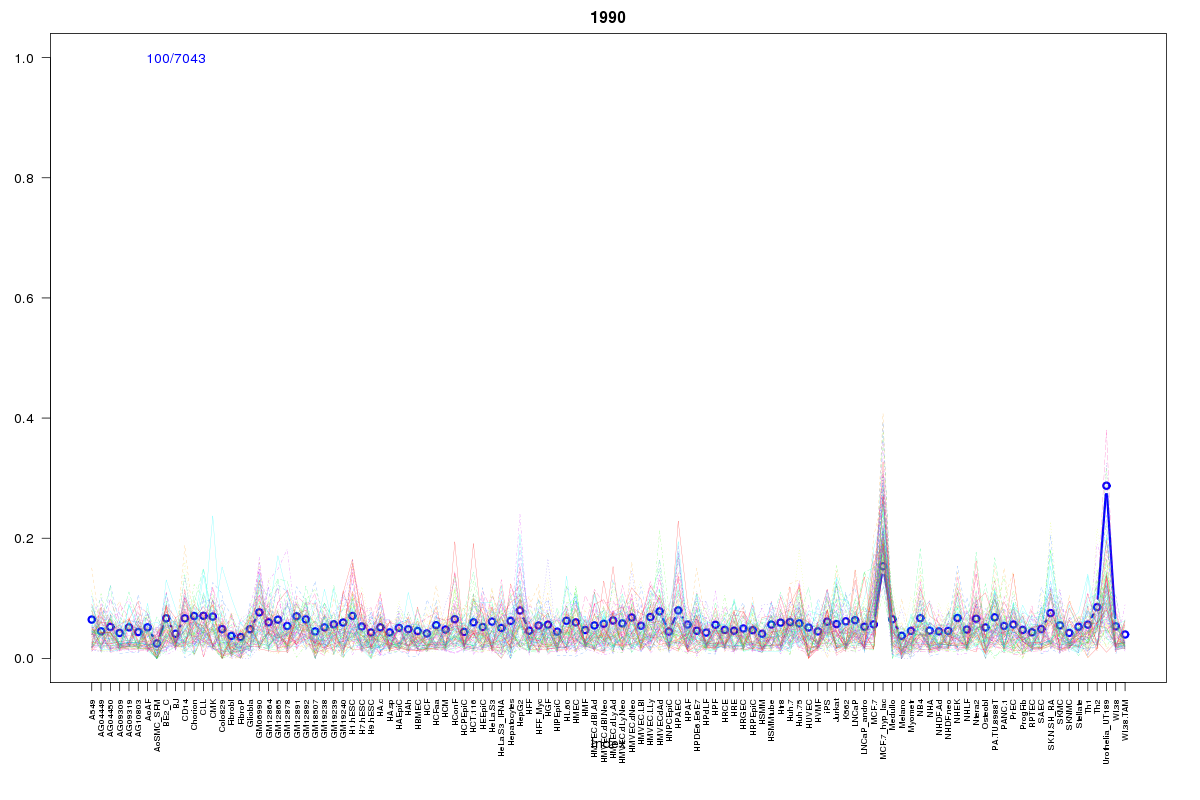 | 1990 | 1 |
 | 1721 | 1 |
 | 928 | 1 |
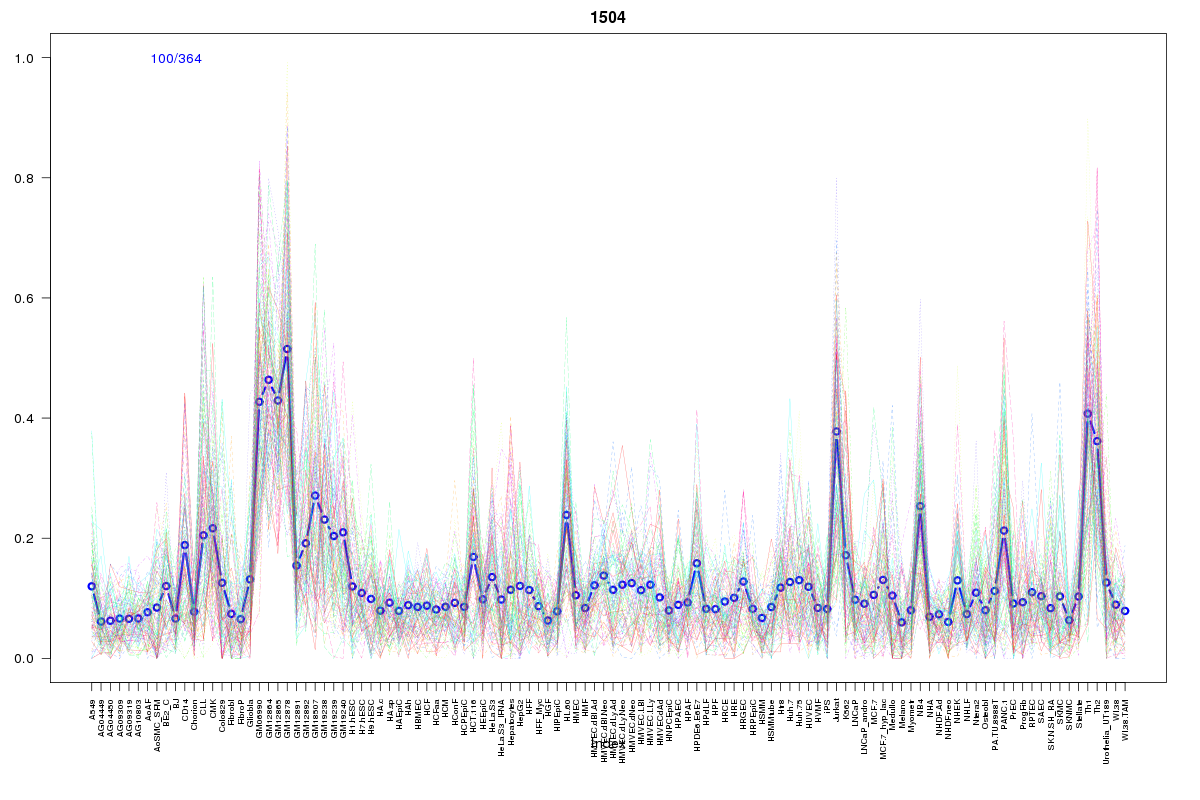 | 1504 | 1 |
 | 2186 | 1 |
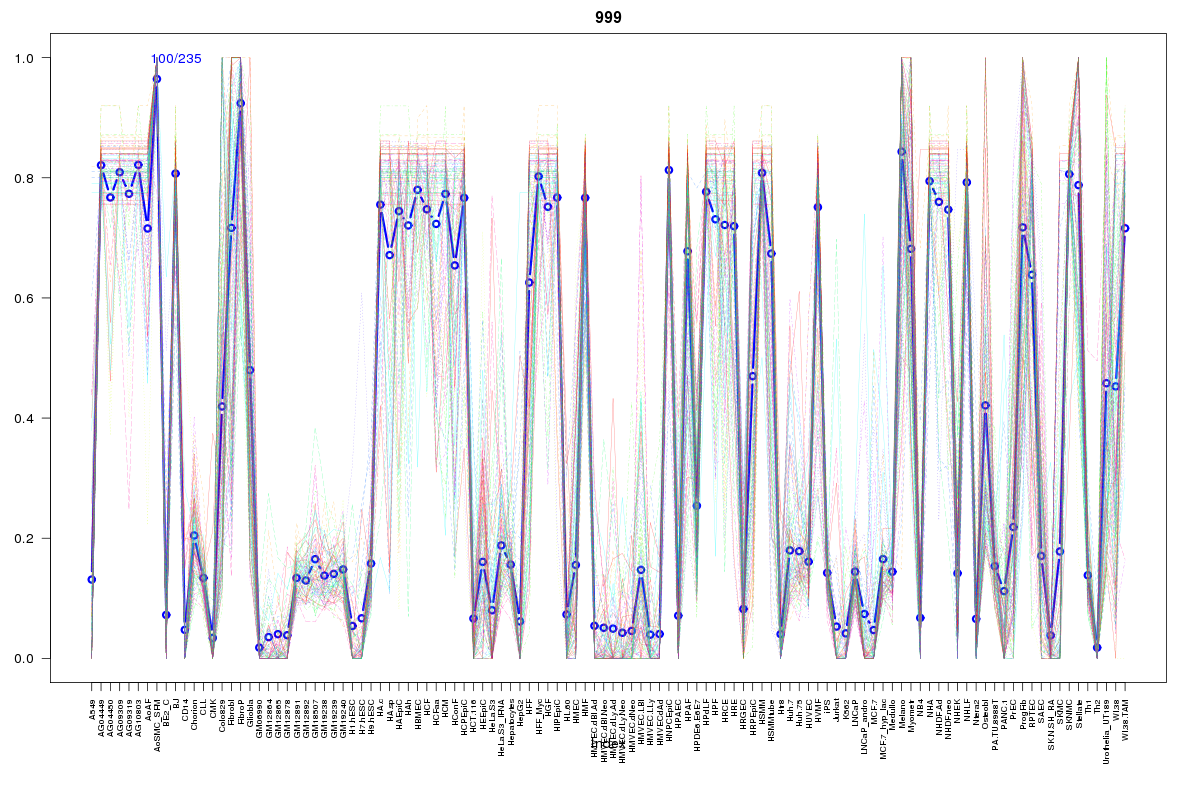 | 999 | 1 |
 | 2122 | 1 |
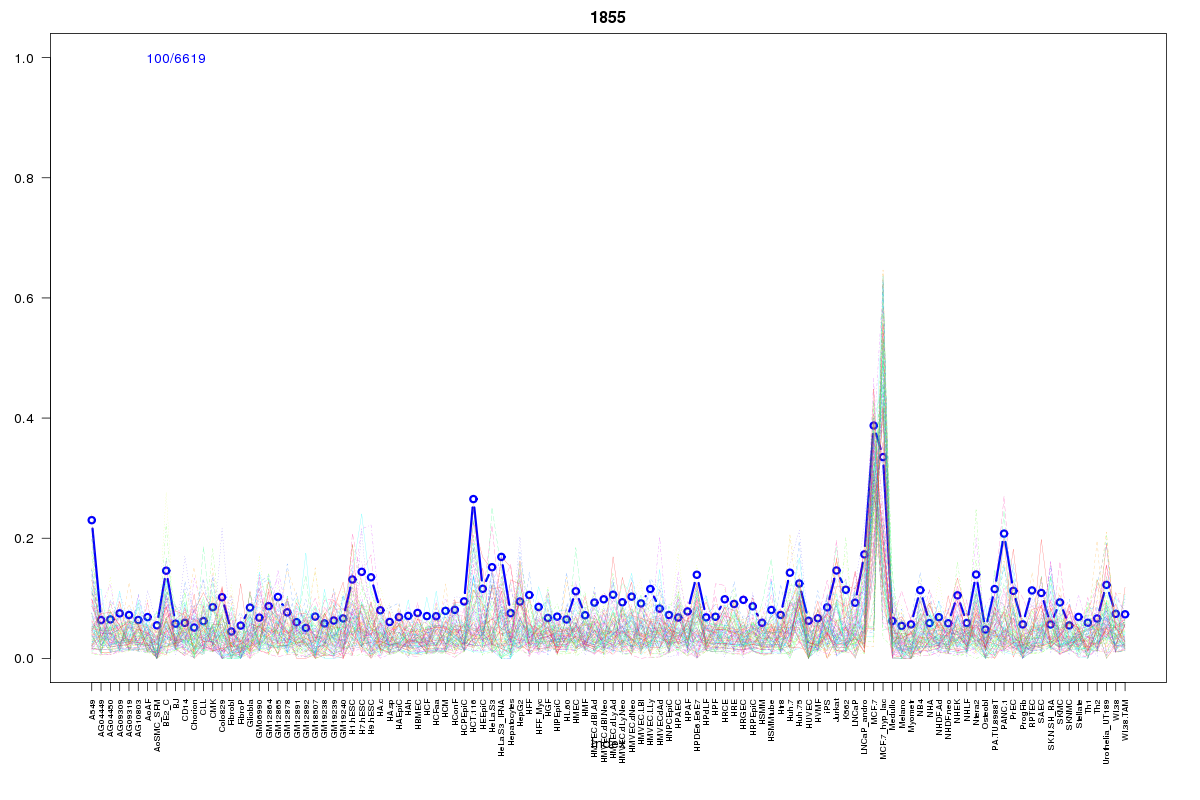 | 1855 | 1 |
 | 2017 | 1 |
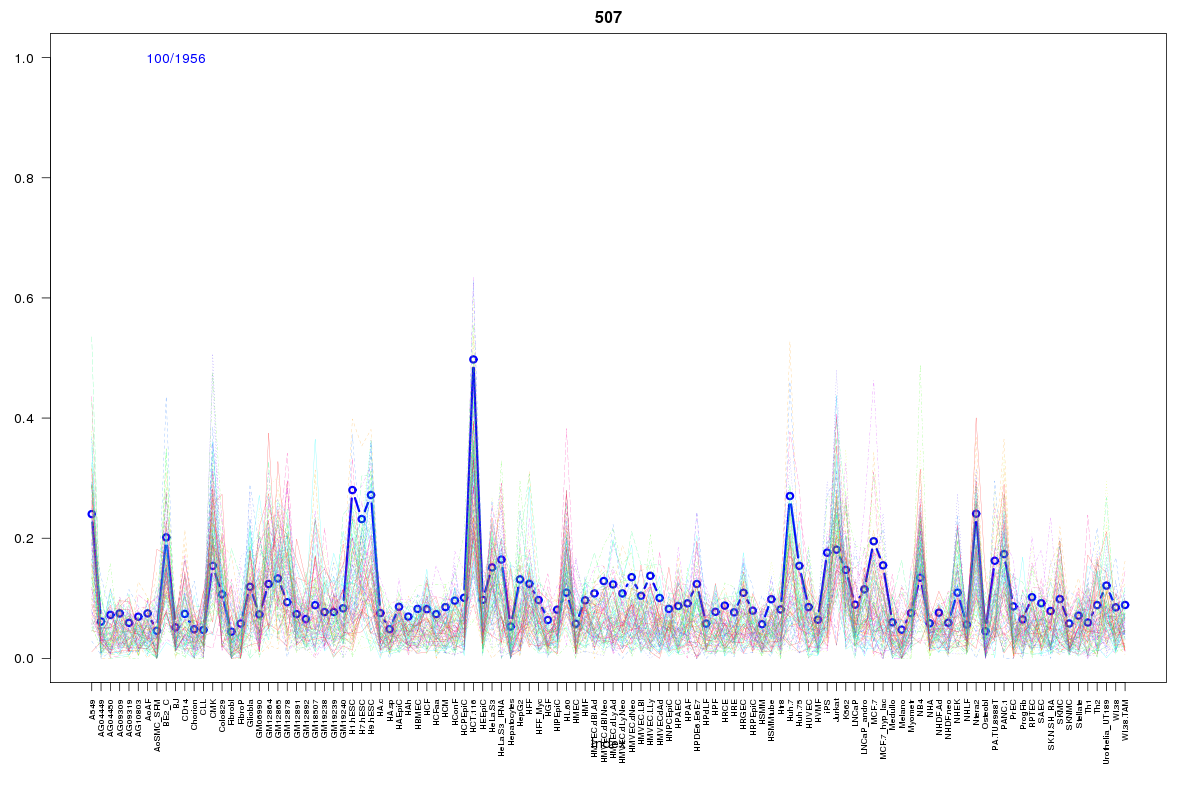 | 507 | 1 |
Resources
BED file downloads
Connects to 19 DHS sitesTop 10 Correlated DHS Sites
p-values indiciate significant higher or lower correlation| Location | Cluster | P-value |
|---|---|---|
| chr1:149783760-149783910 | 632 | 0.001 |
| chr1:149870880-149871030 | 661 | 0.001 |
| chr1:149860220-149860370 | 1324 | 0.001 |
| chr1:149815340-149815490 | 2017 | 0.001 |
| chr1:149909120-149909270 | 928 | 0.003 |
| chr1:149851240-149851390 | 2166 | 0.003 |
| chr1:149784720-149784870 | 2122 | 0.005 |
| chr1:149857640-149857790 | 2073 | 0.008 |
| chr1:149871200-149871350 | 335 | 0.011 |
| chr1:149858520-149858670 | 1269 | 0.011 |
| chr1:149858820-149858970 | 632 | 0.012 |
External Databases
UCSCEnsembl (ENSG00000178096)