Gene: SKIDA1
chr10: 21802406-21814611Expression Profile
(log scale)
Graphical Connections
Distribution of linked clusters:
You may find it interesting if many of the connected DHS sites belong to the same cluster.| Cluster Profile | Cluster ID | Number of DHS sites in this cluster |
|---|---|---|
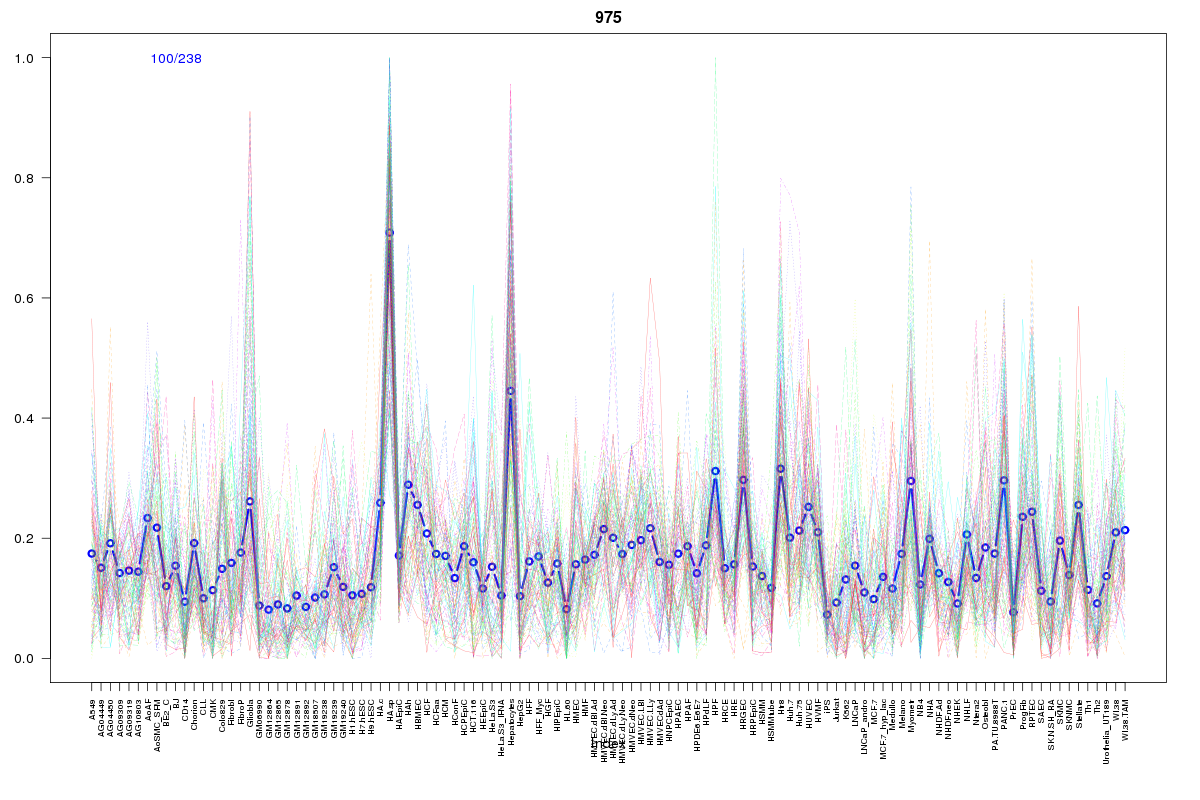 | 975 | 5 |
 | 927 | 3 |
 | 15 | 3 |
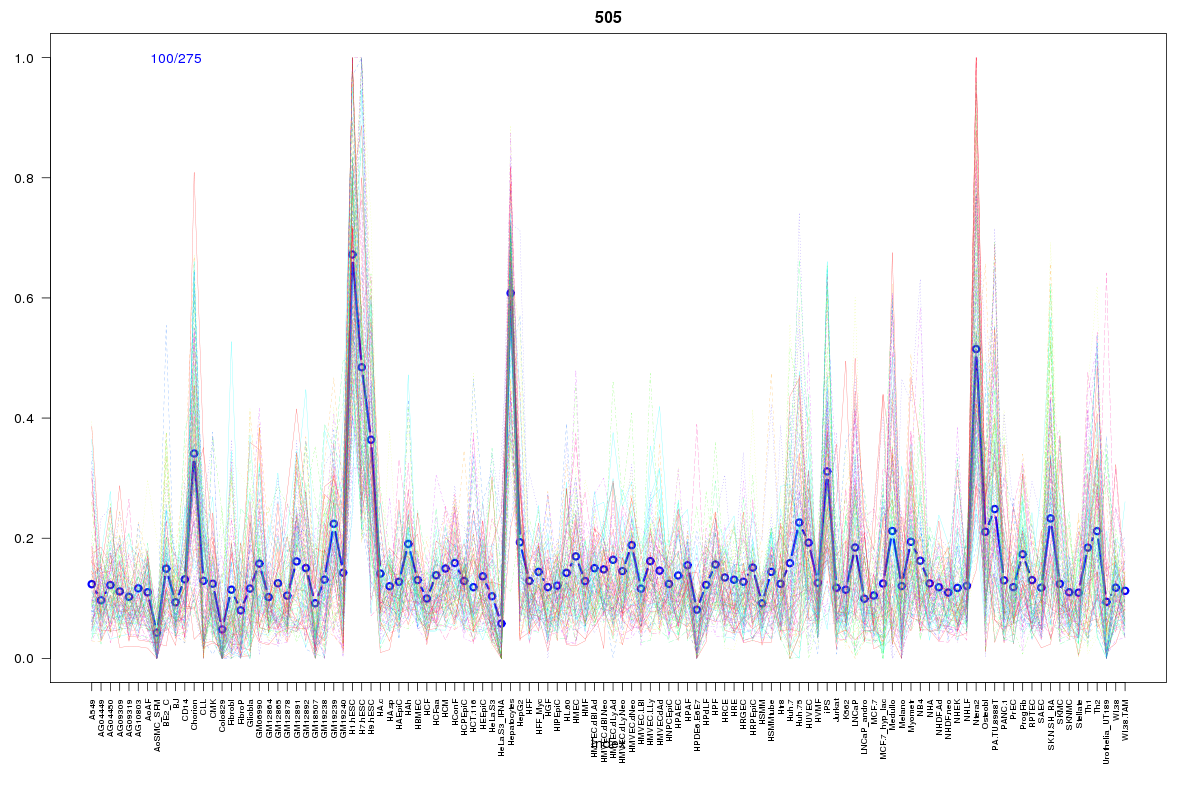 | 505 | 3 |
 | 412 | 2 |
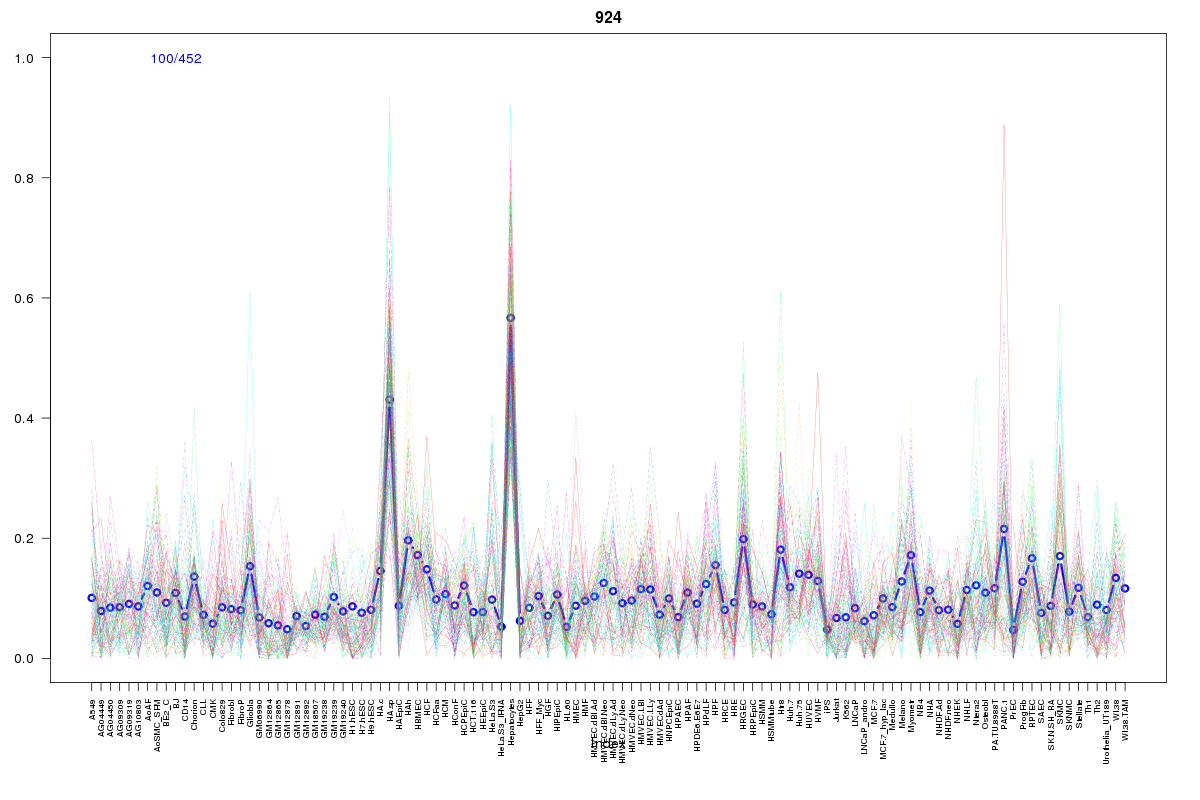 | 924 | 2 |
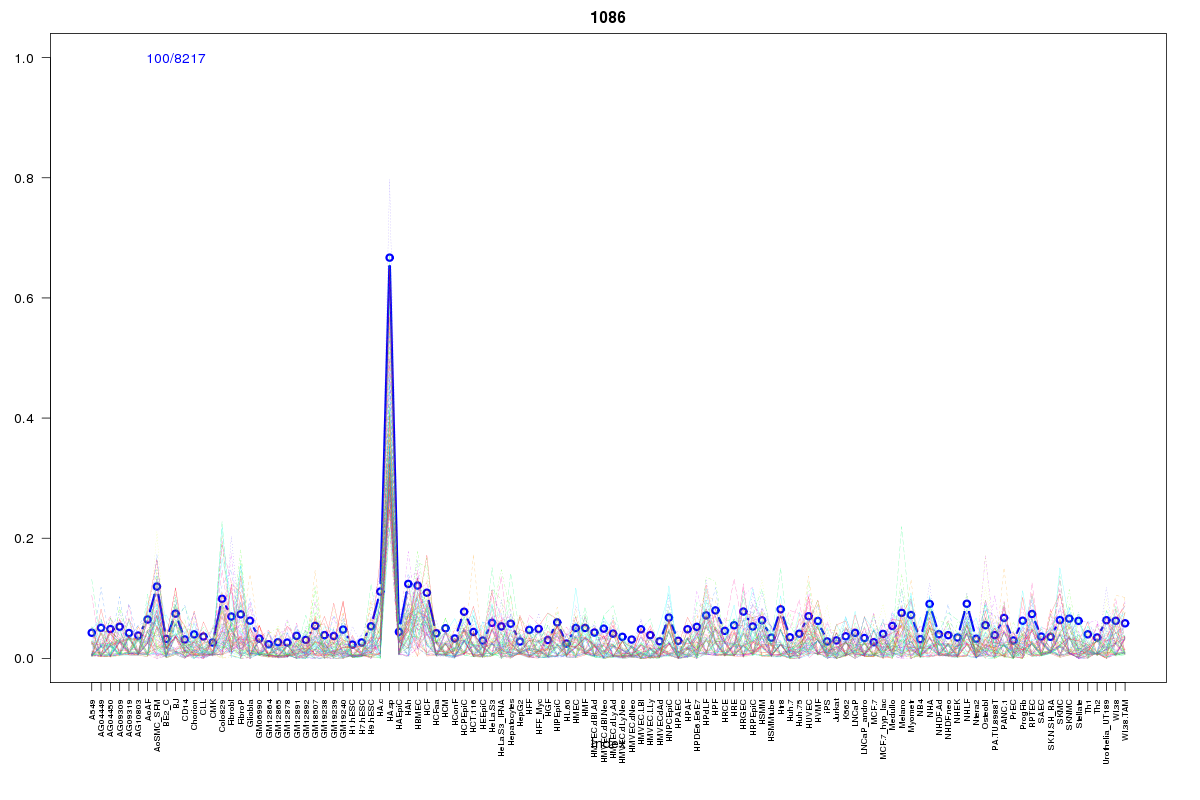 | 1086 | 2 |
 | 687 | 2 |
 | 862 | 2 |
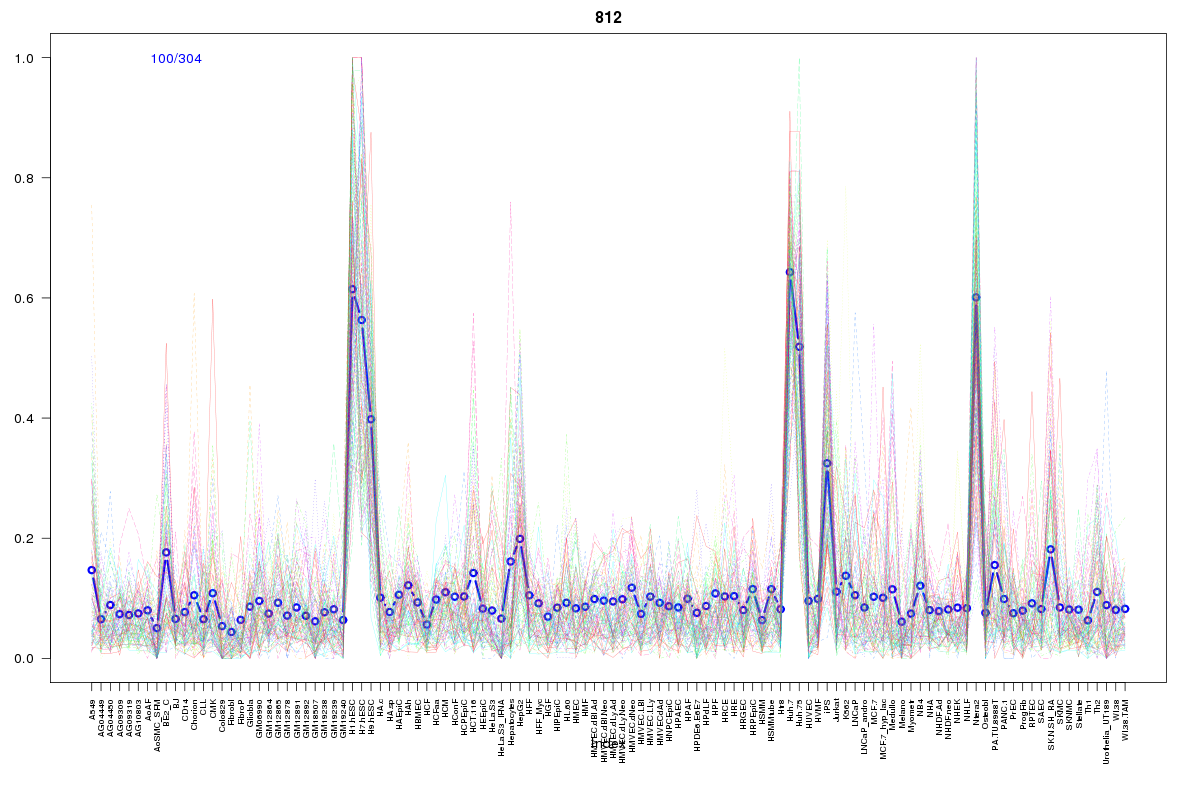 | 812 | 2 |
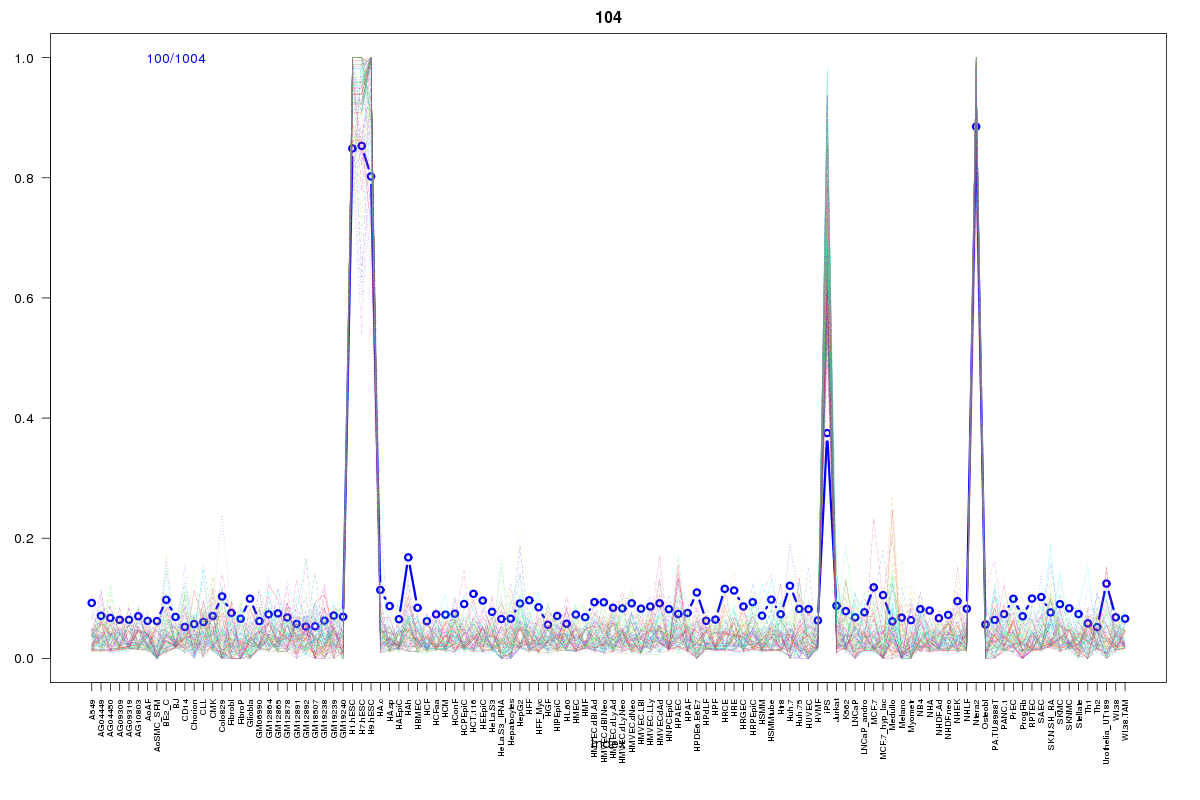 | 104 | 1 |
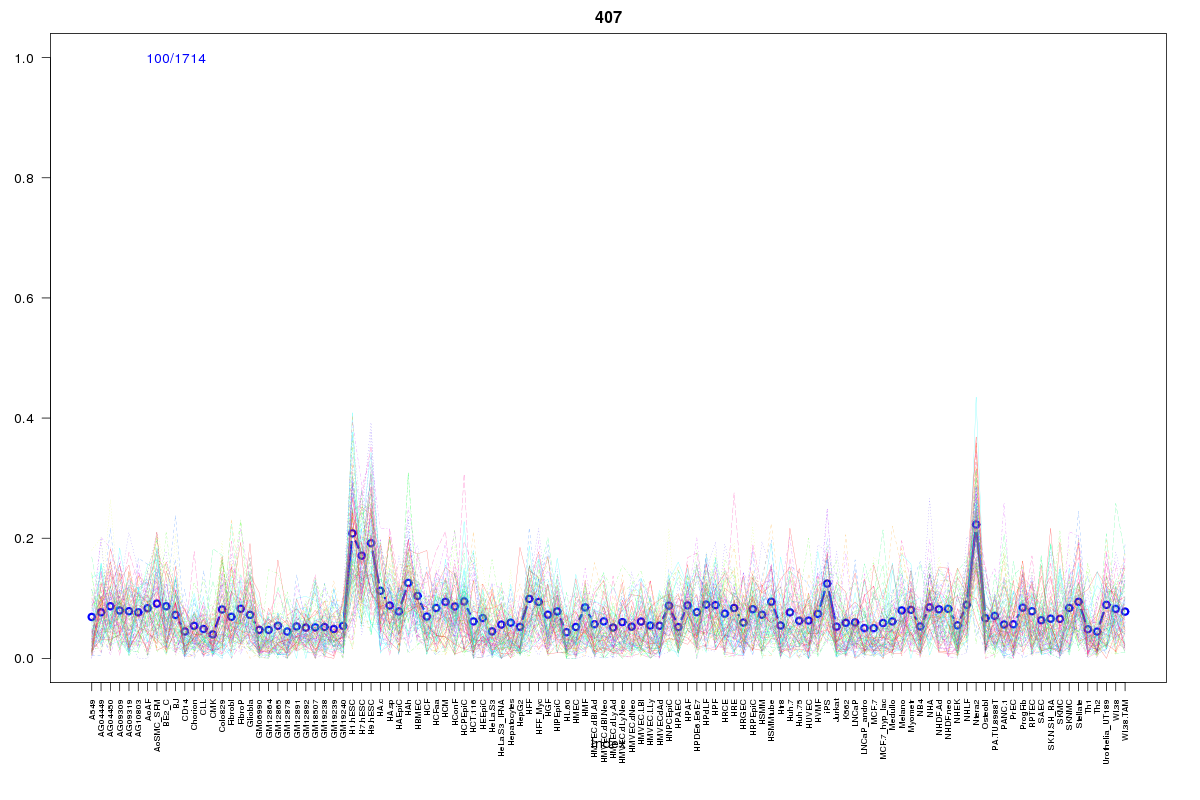 | 407 | 1 |
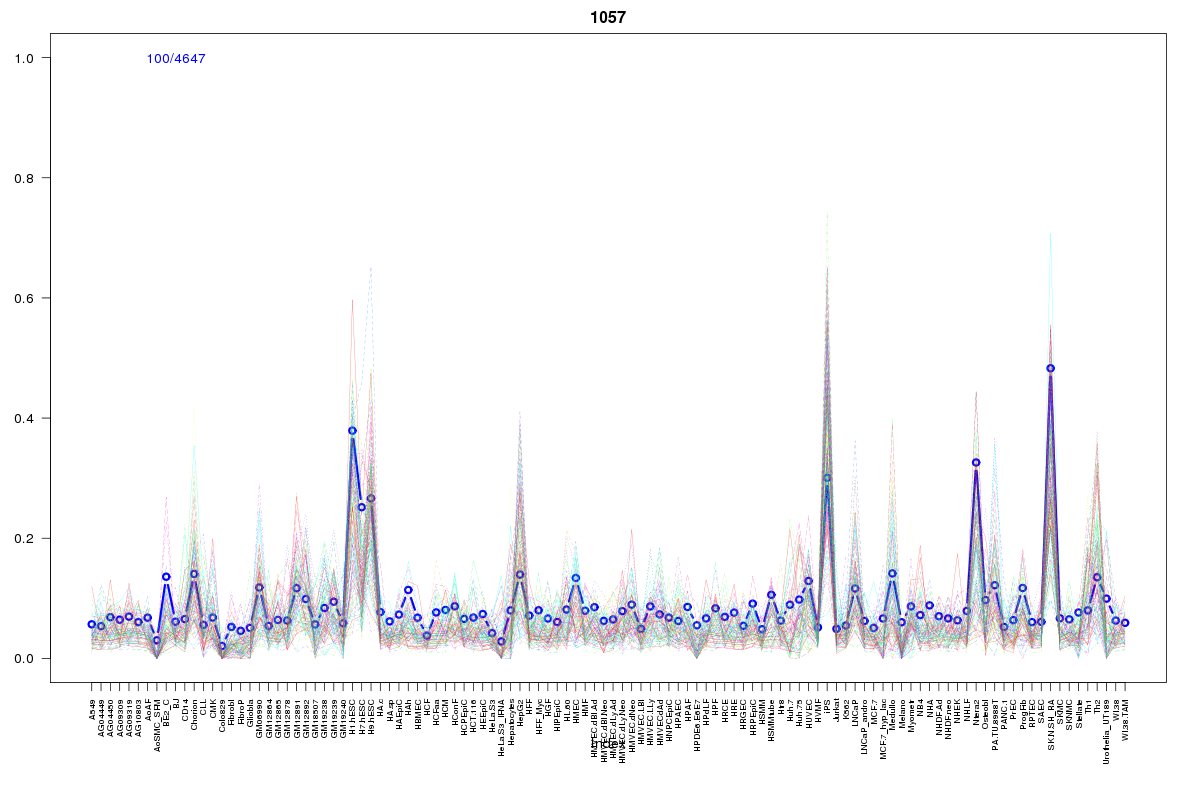 | 1057 | 1 |
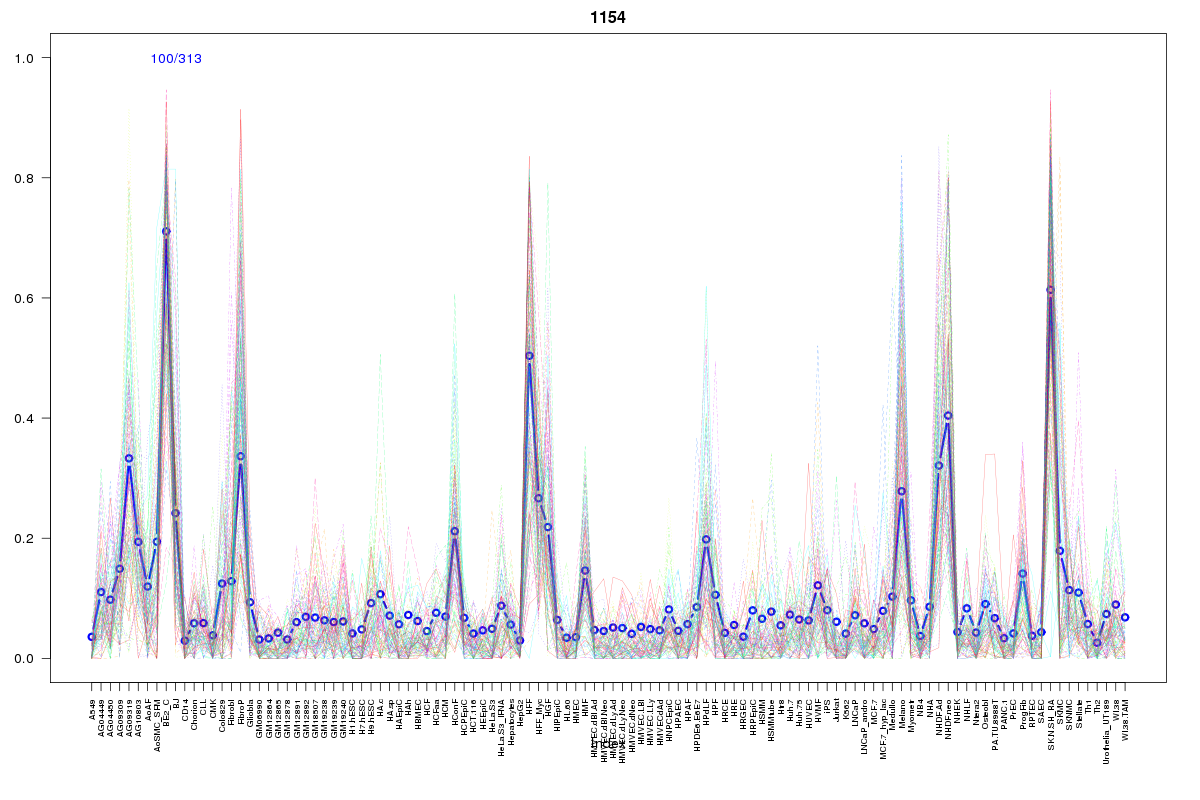 | 1154 | 1 |
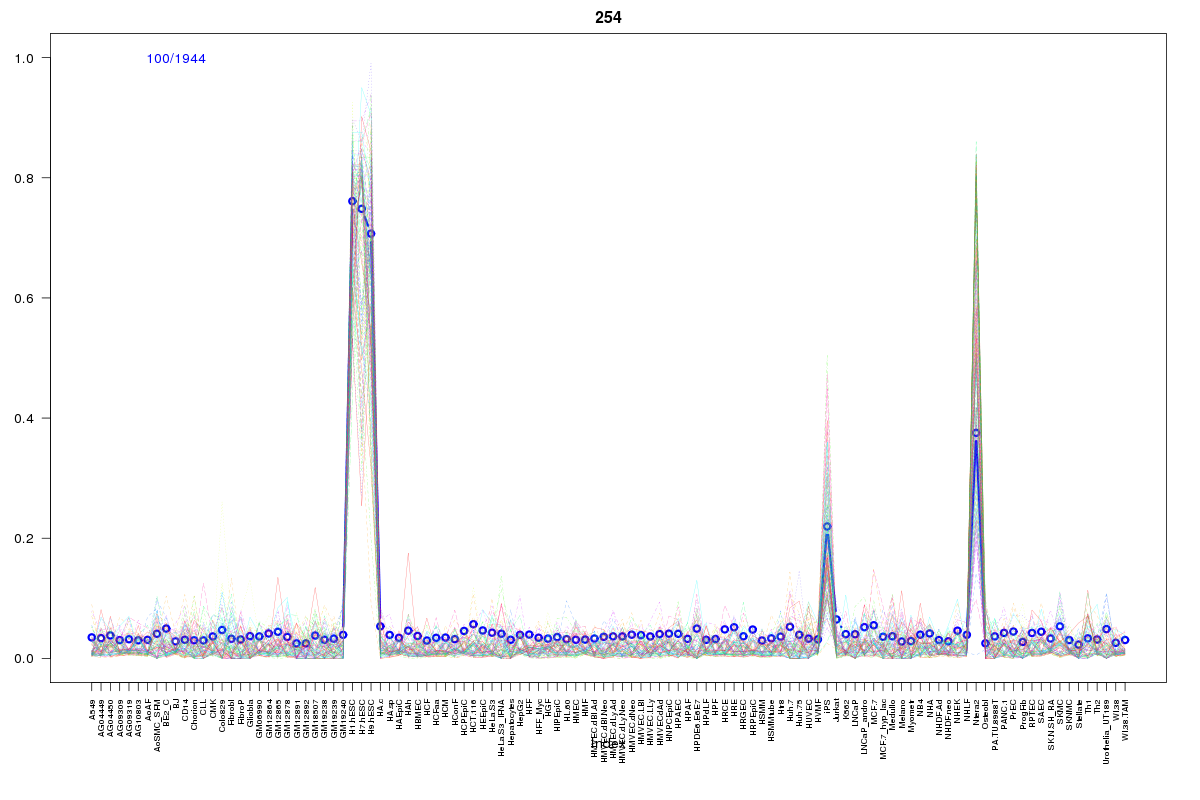 | 254 | 1 |
 | 110 | 1 |
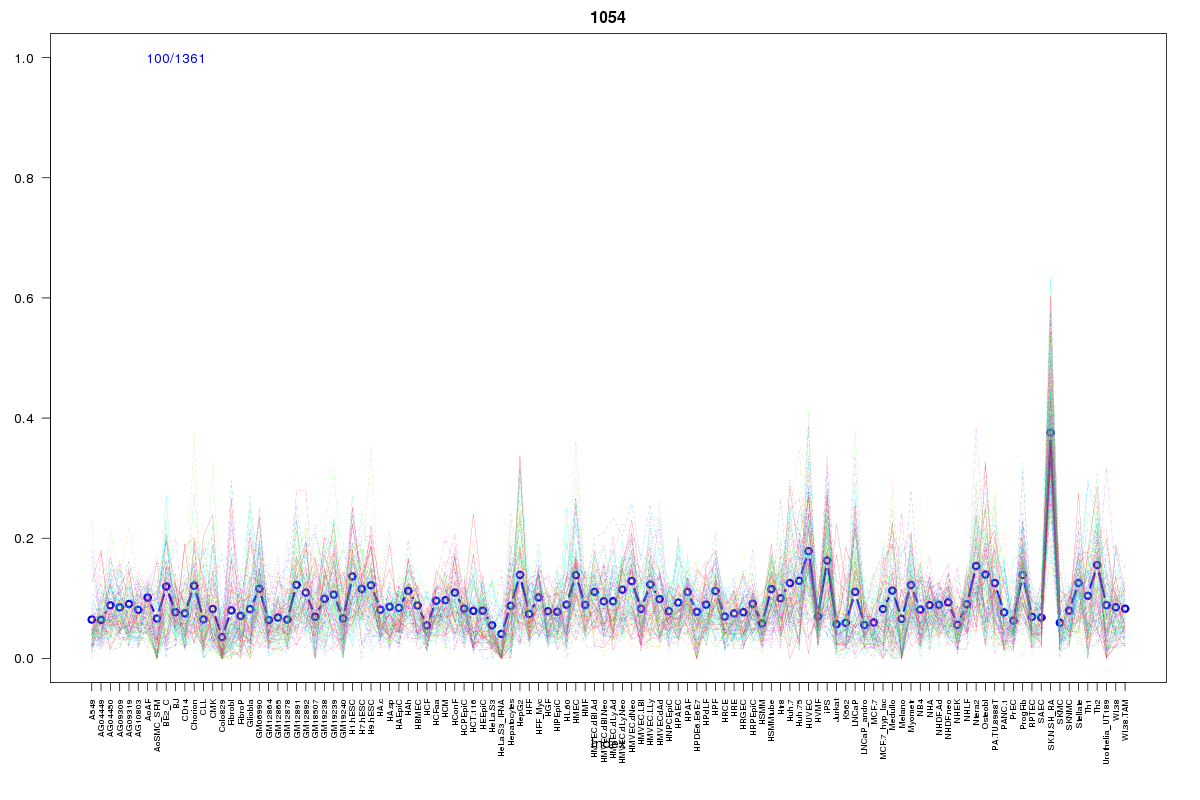 | 1054 | 1 |
 | 2055 | 1 |
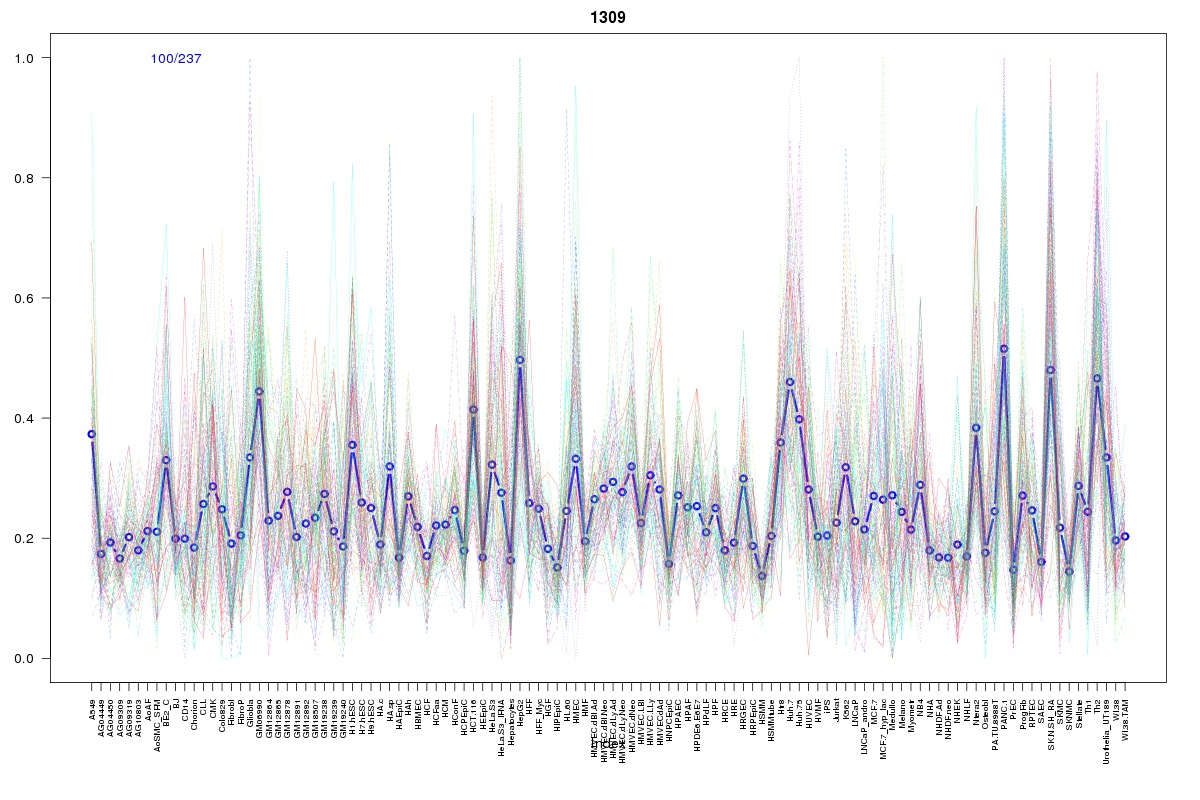 | 1309 | 1 |
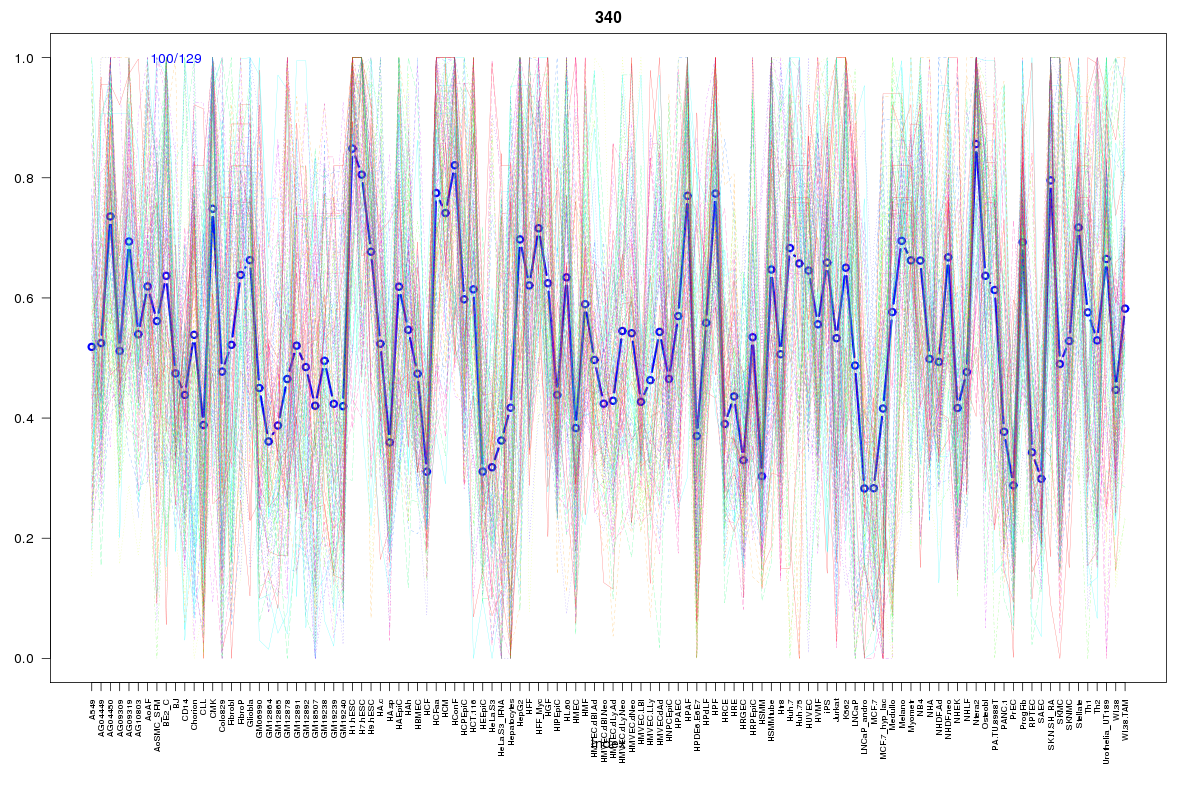 | 340 | 1 |
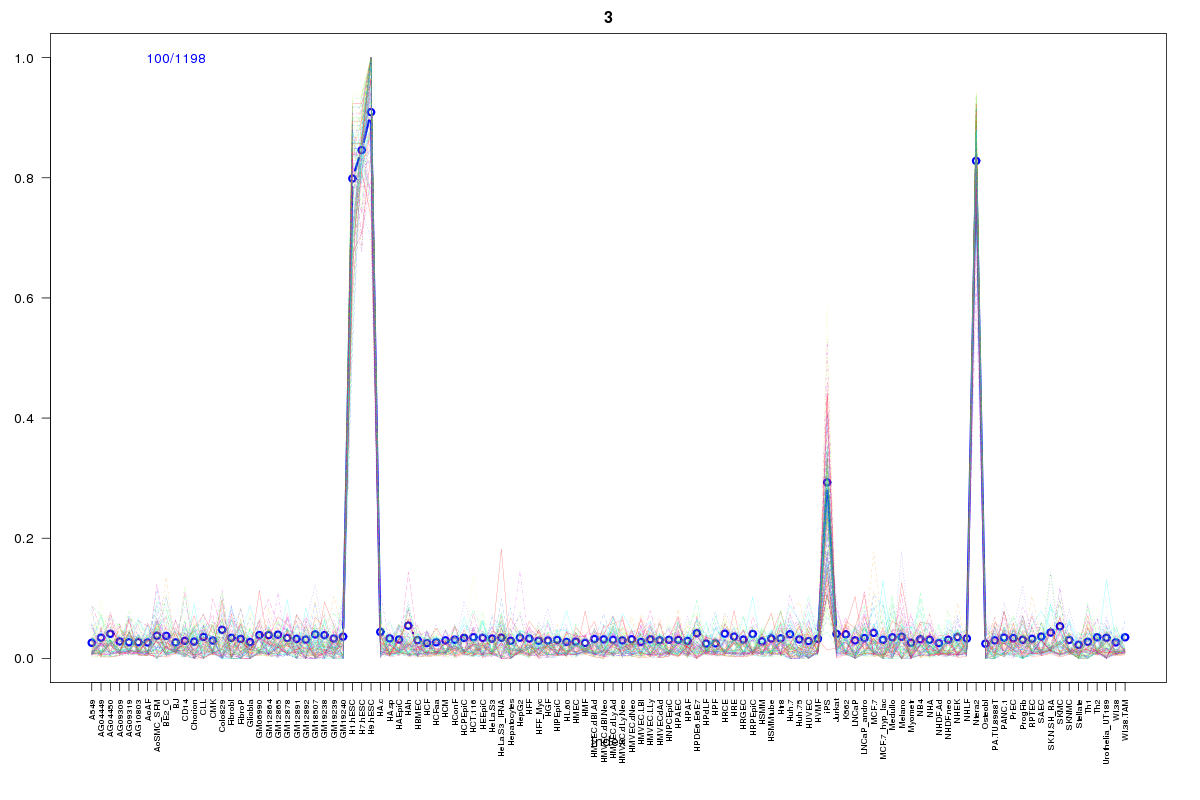 | 3 | 1 |
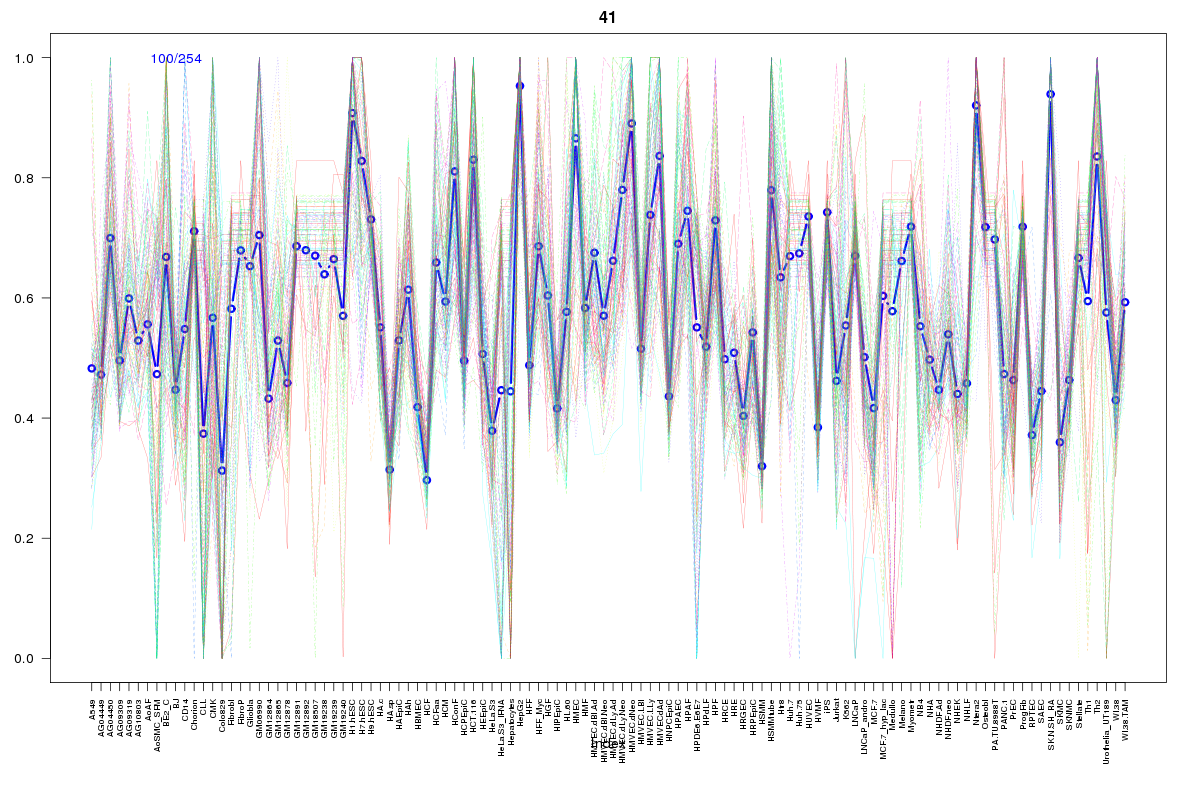 | 41 | 1 |
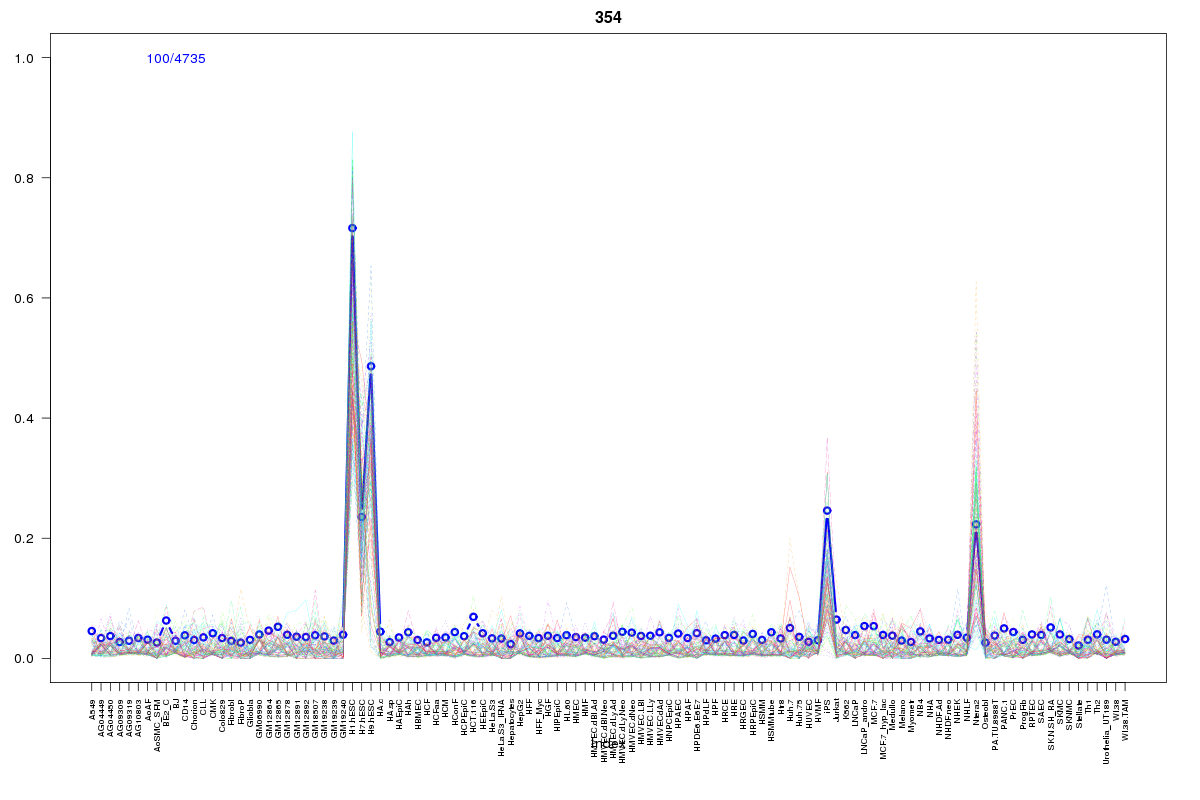 | 354 | 1 |
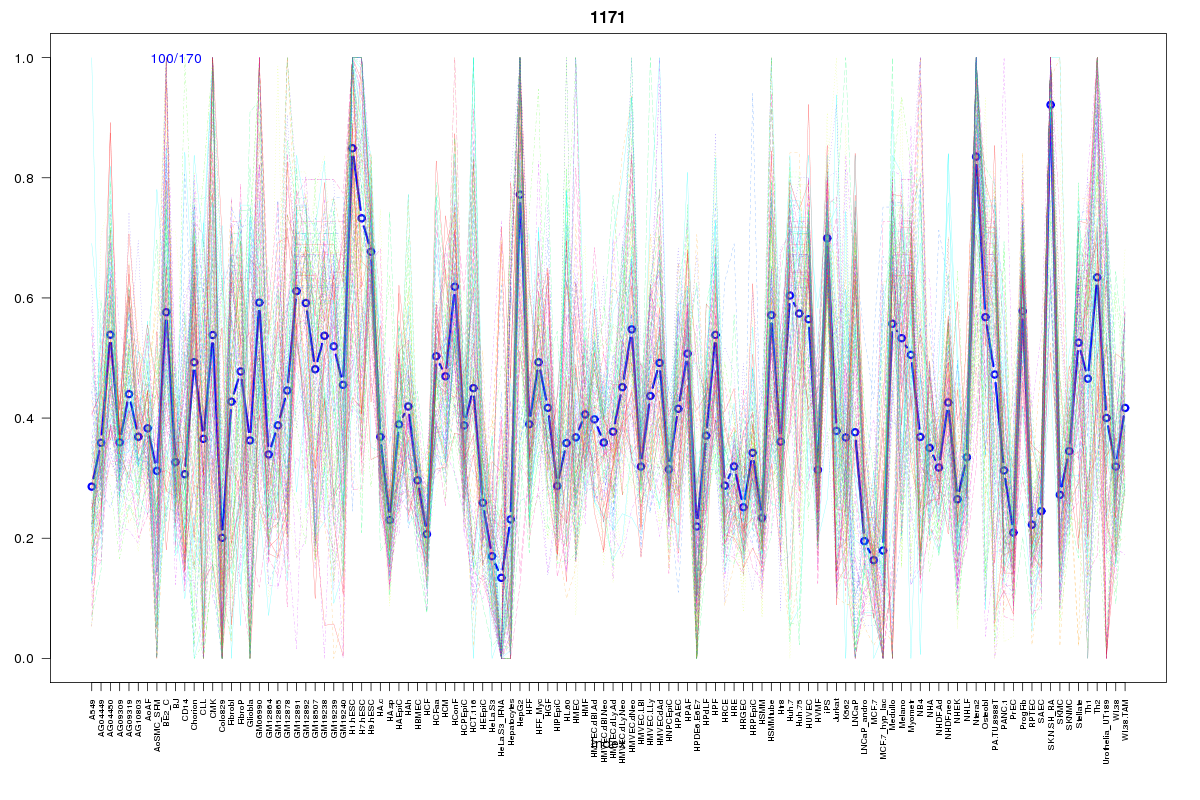 | 1171 | 1 |
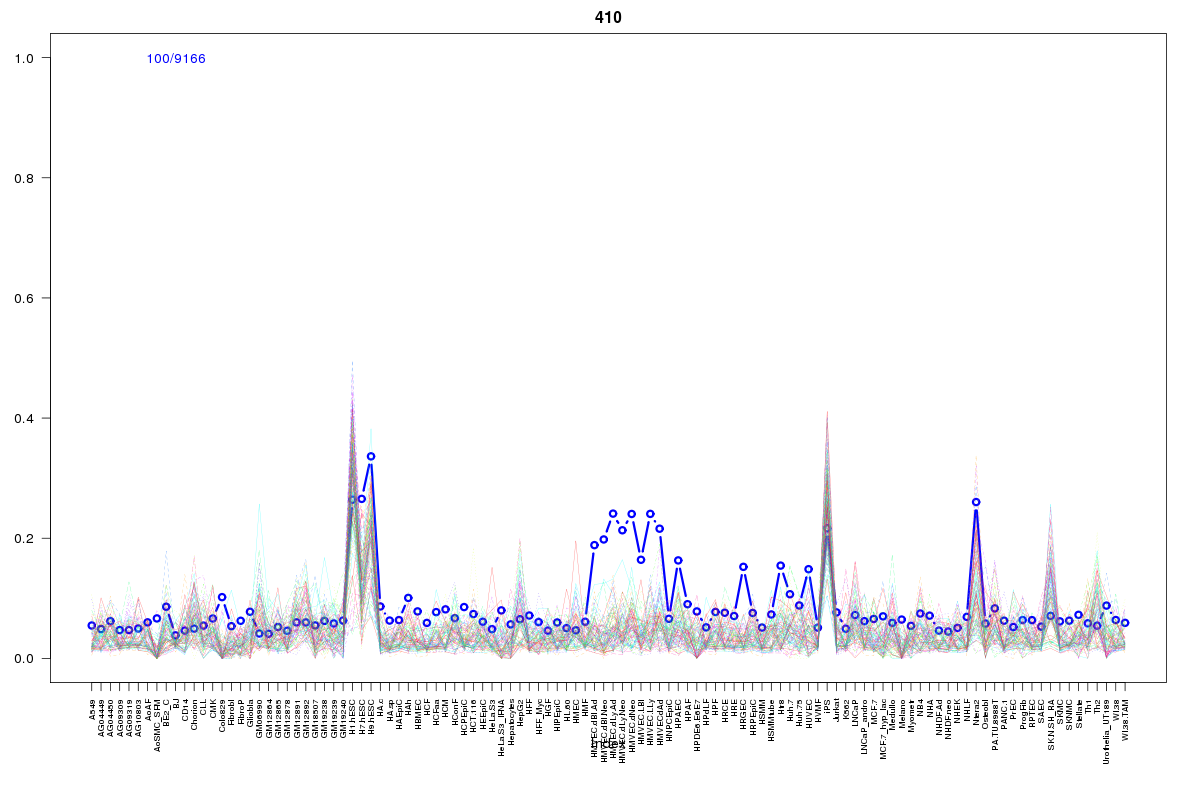 | 410 | 1 |
 | 534 | 1 |
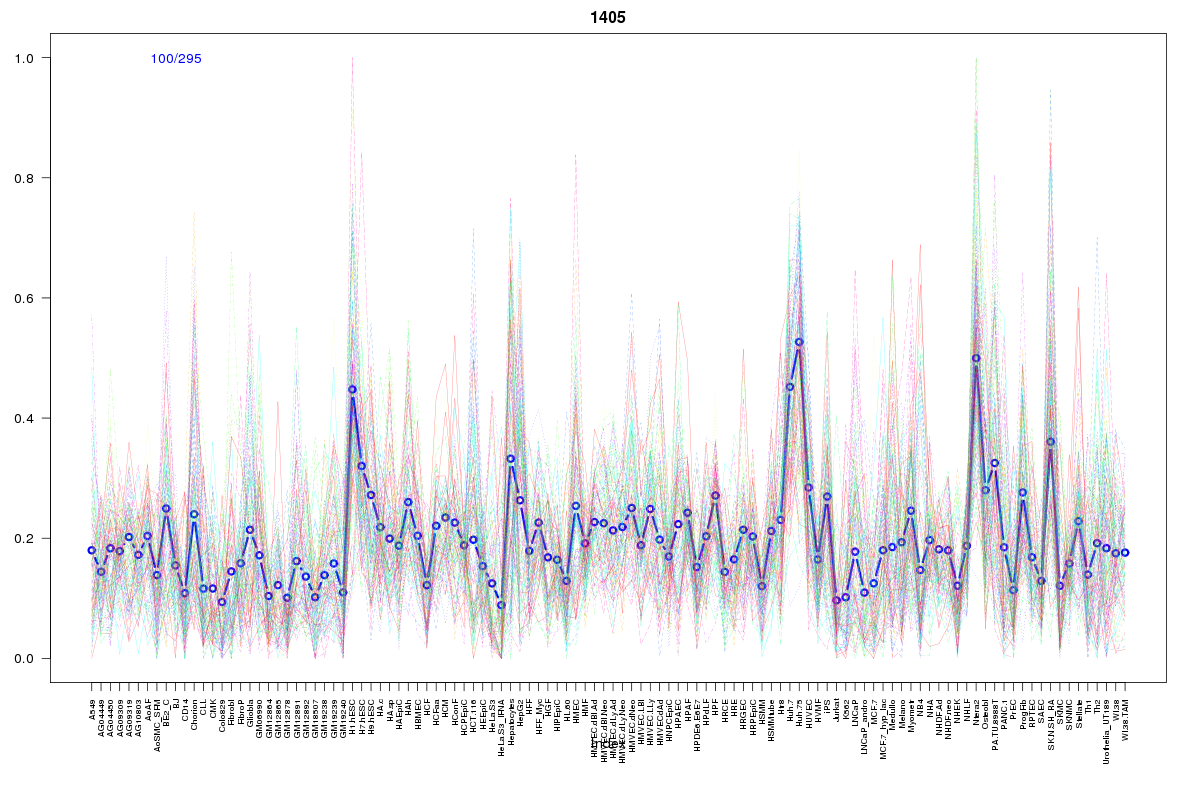 | 1405 | 1 |
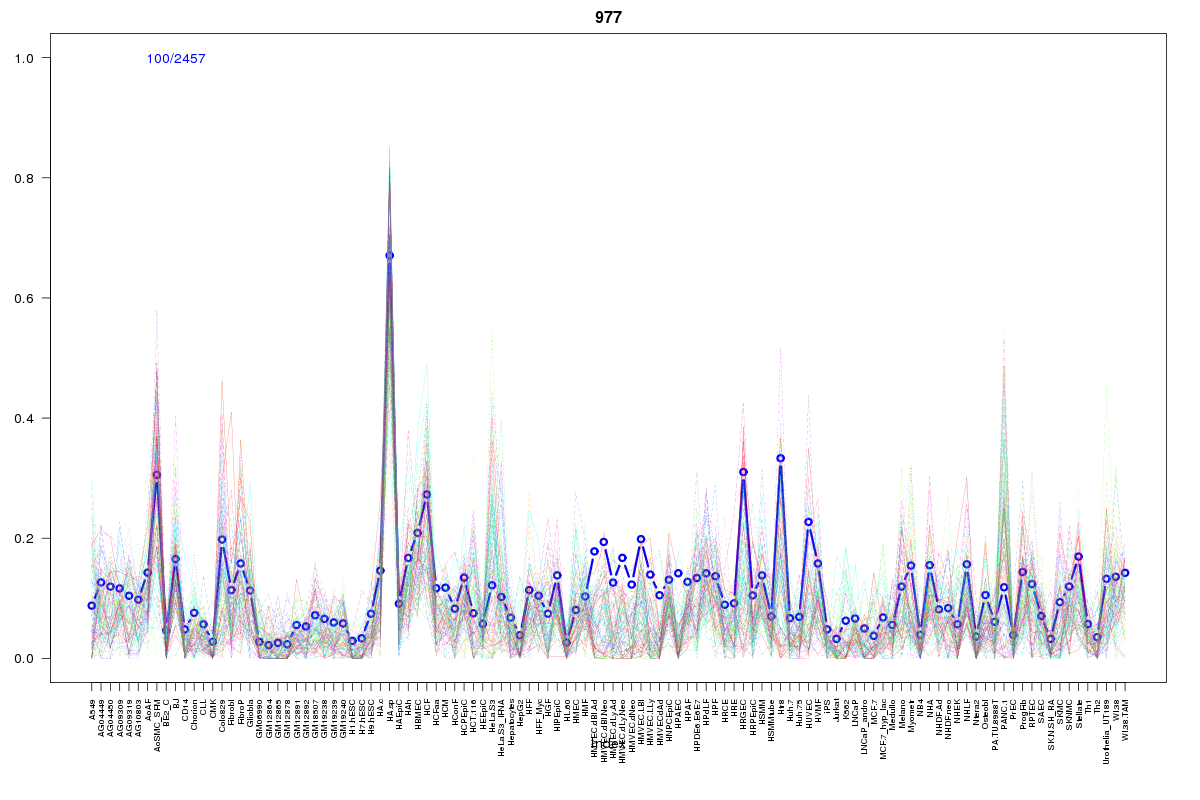 | 977 | 1 |
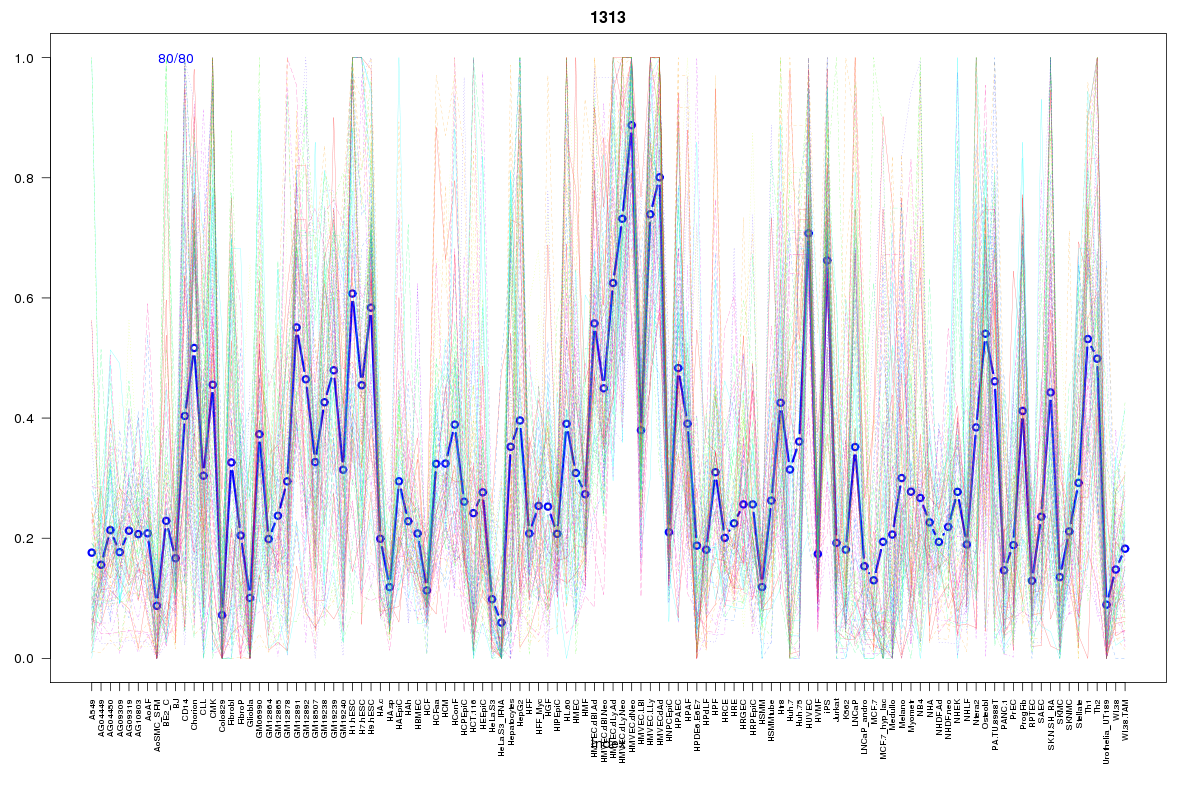 | 1313 | 1 |
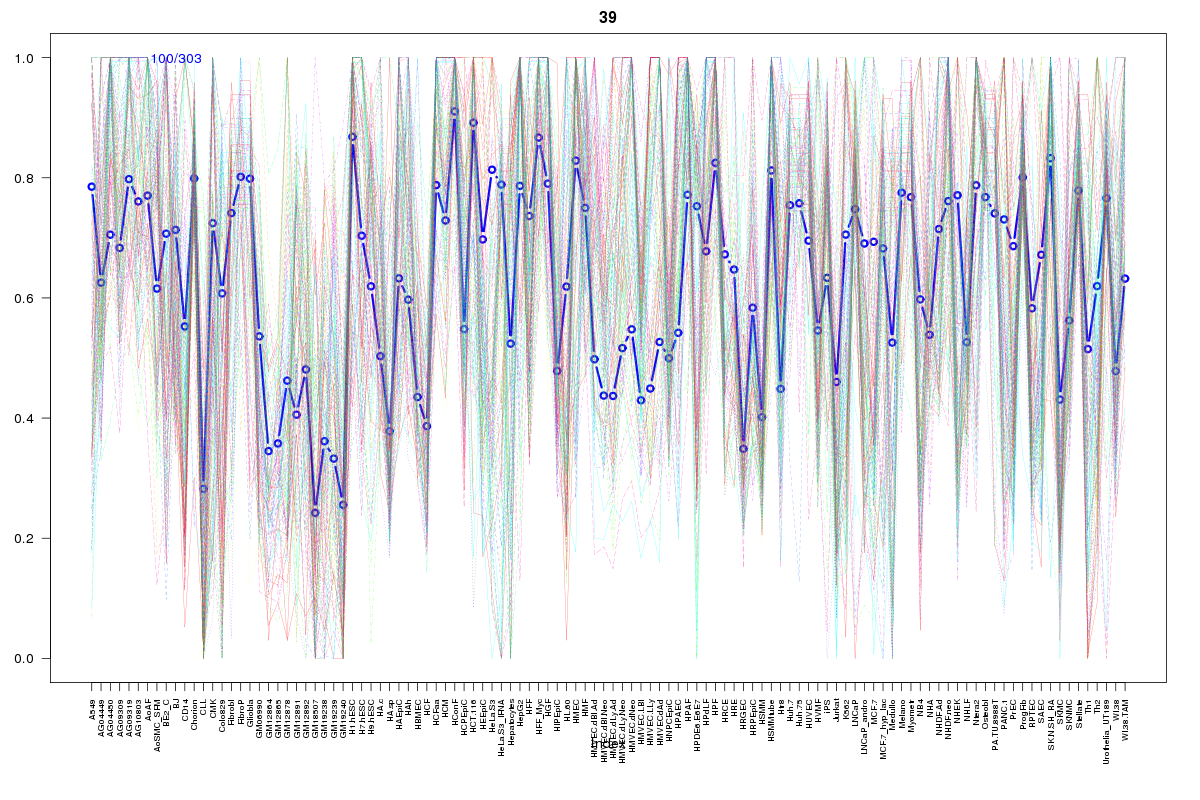 | 39 | 1 |
 | 108 | 1 |
 | 2175 | 1 |
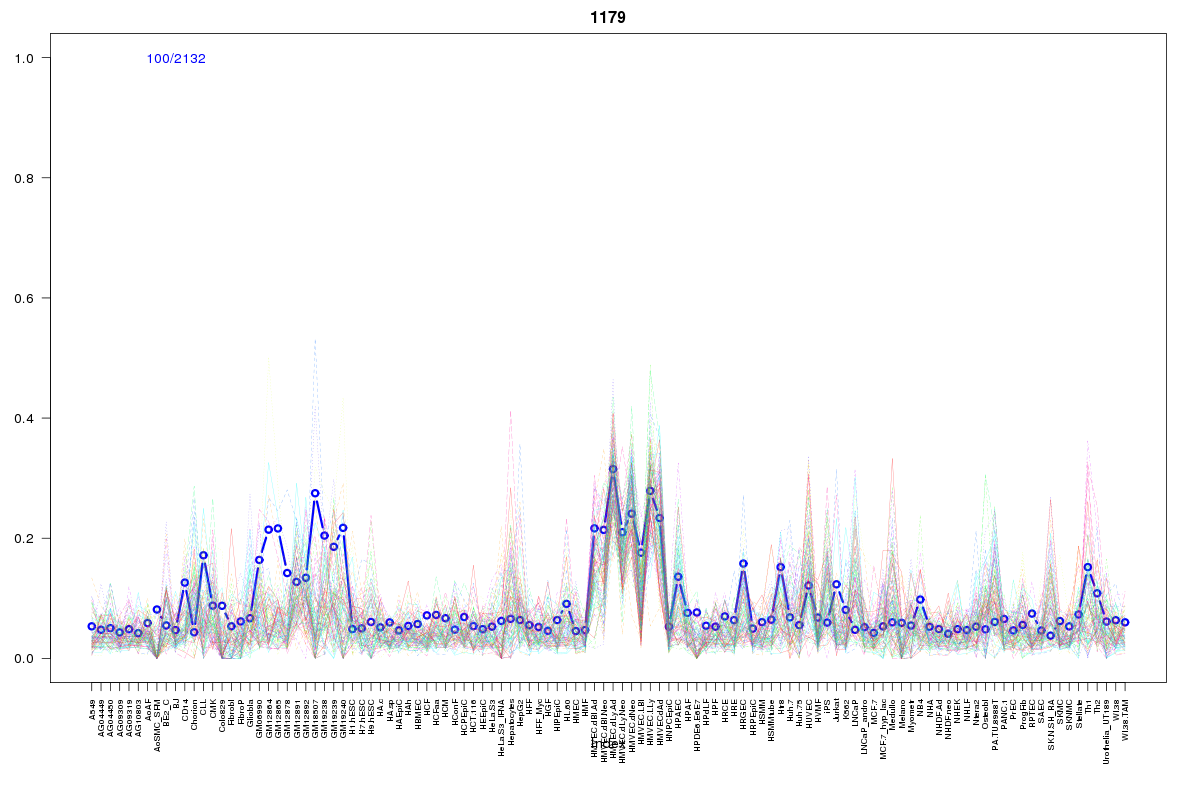 | 1179 | 1 |
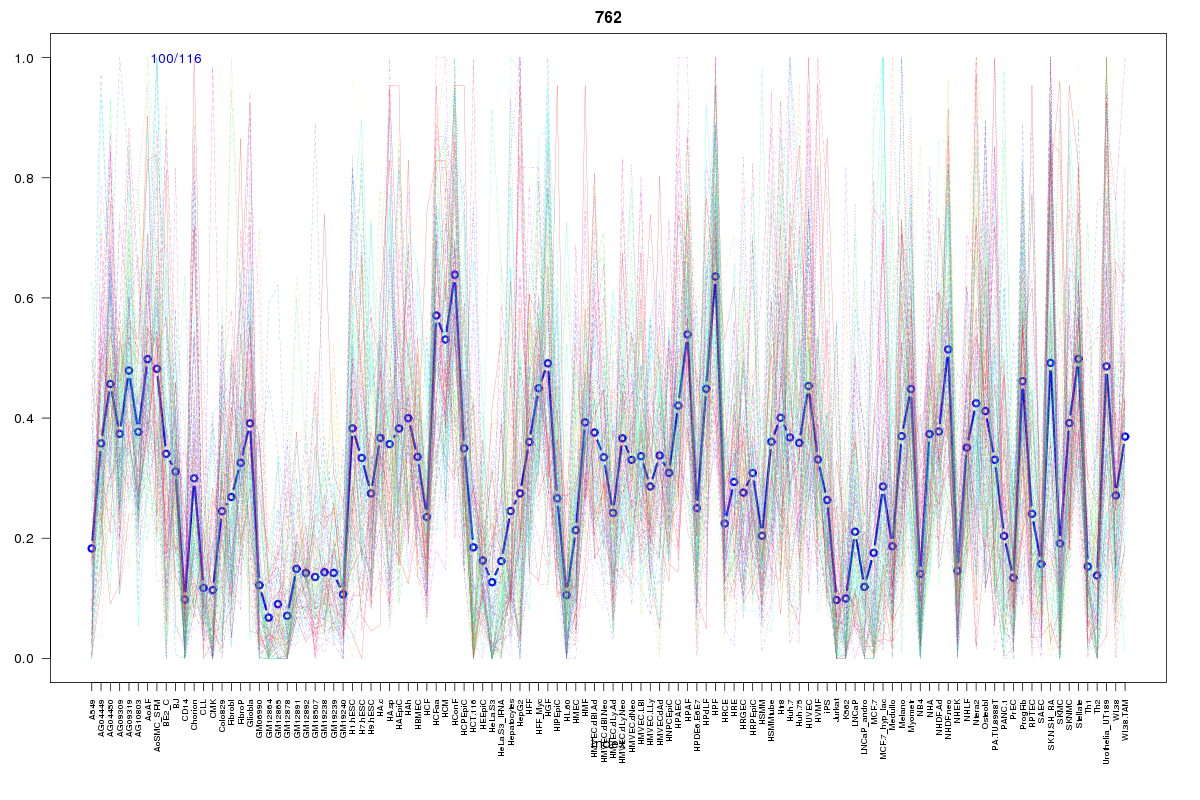 | 762 | 1 |
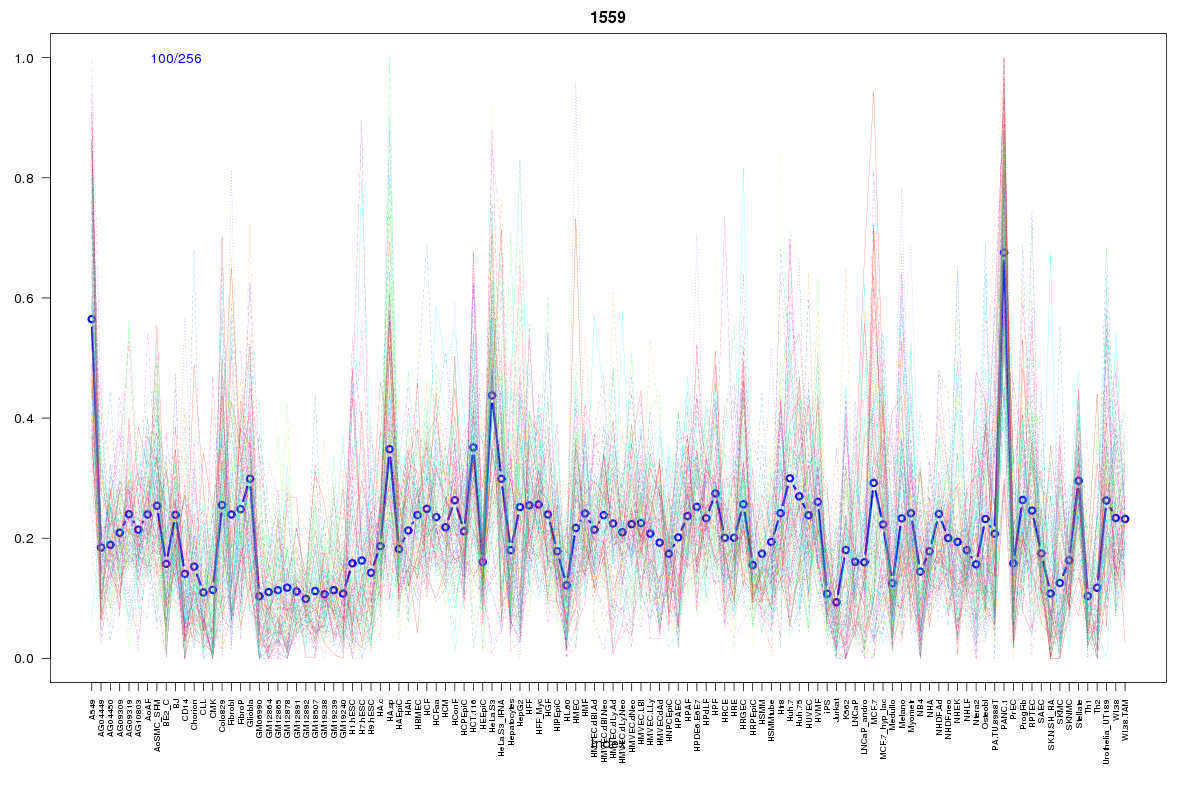 | 1559 | 1 |
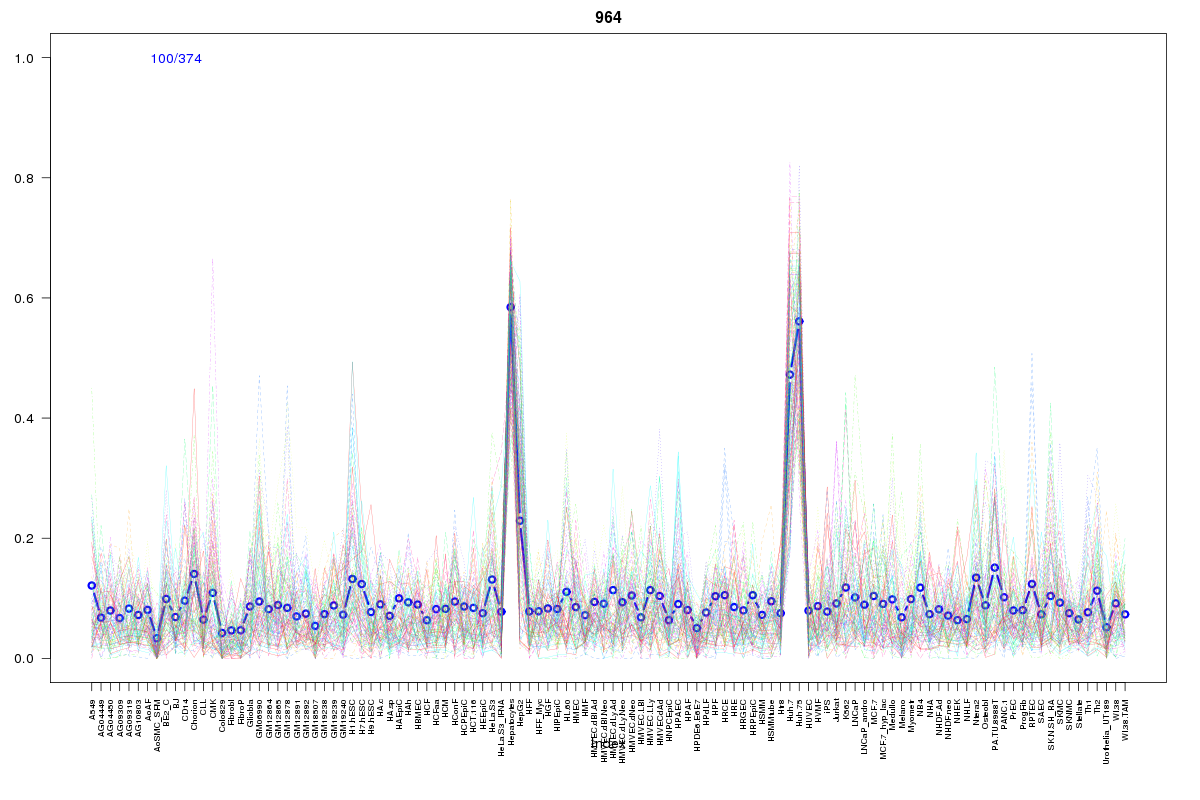 | 964 | 1 |
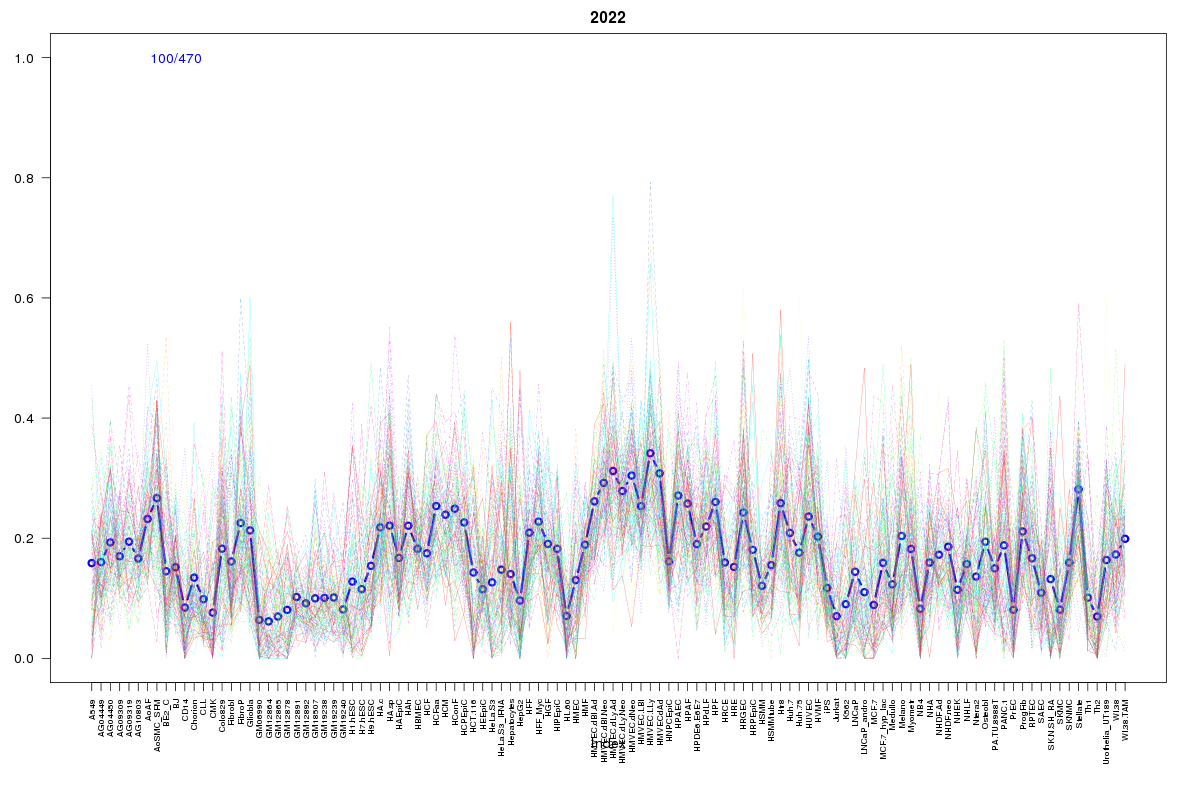 | 2022 | 1 |
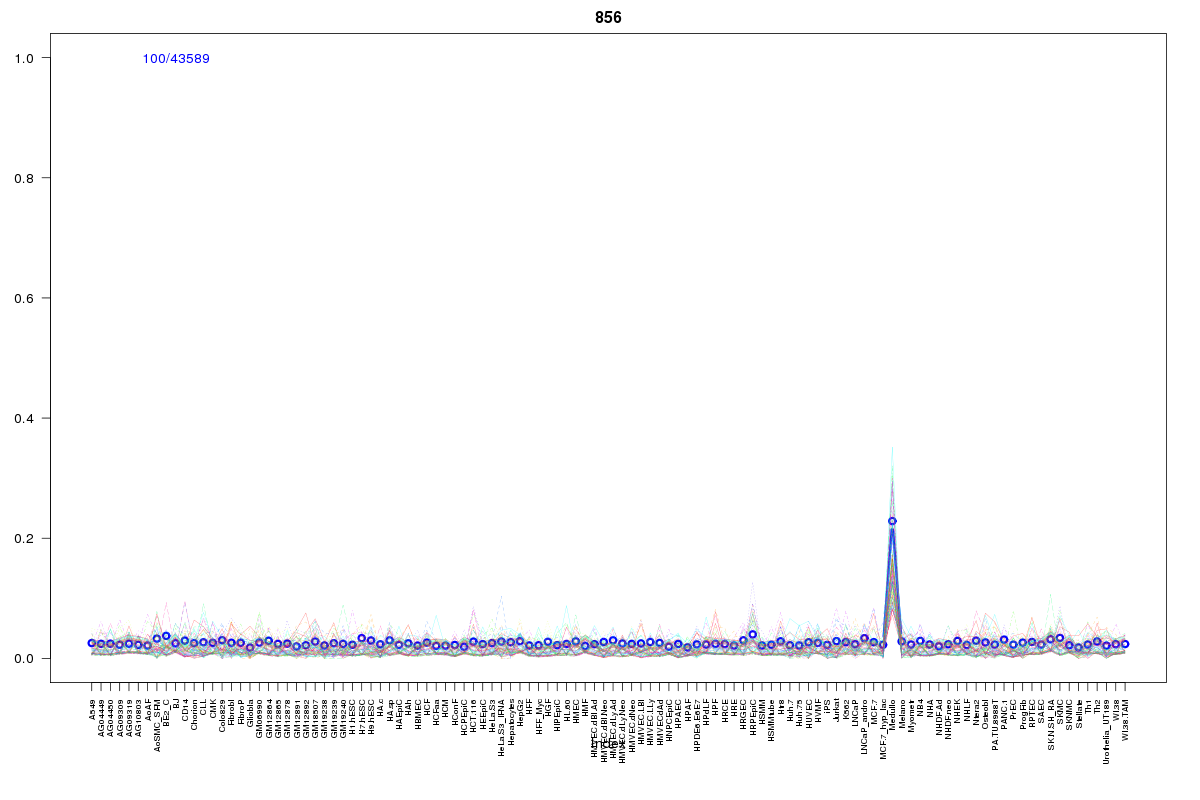 | 856 | 1 |
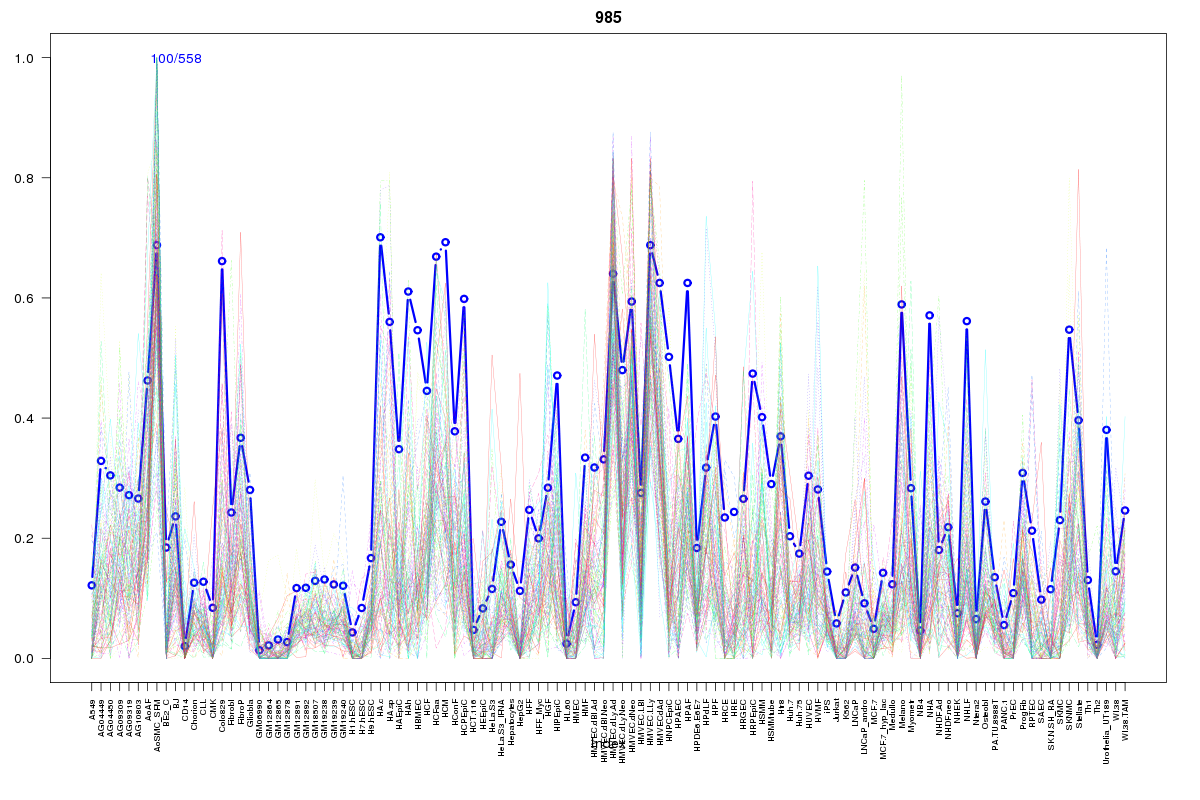 | 985 | 1 |
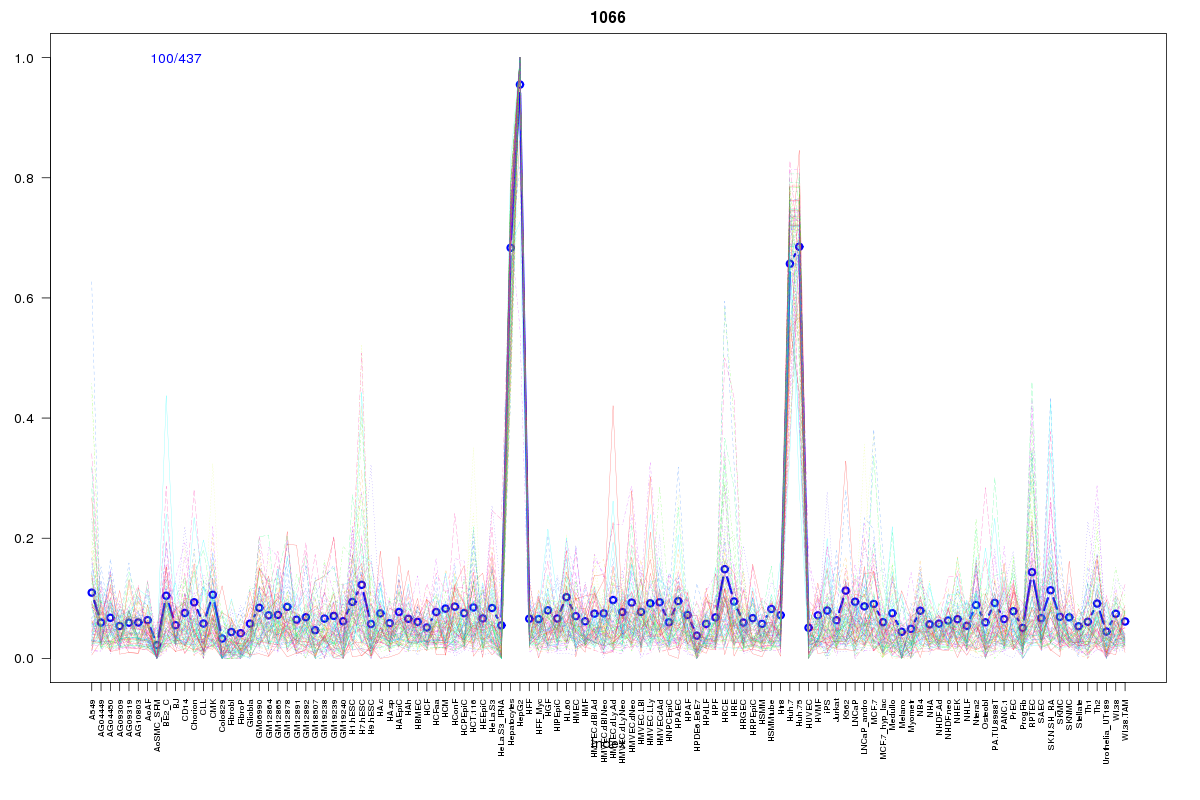 | 1066 | 1 |
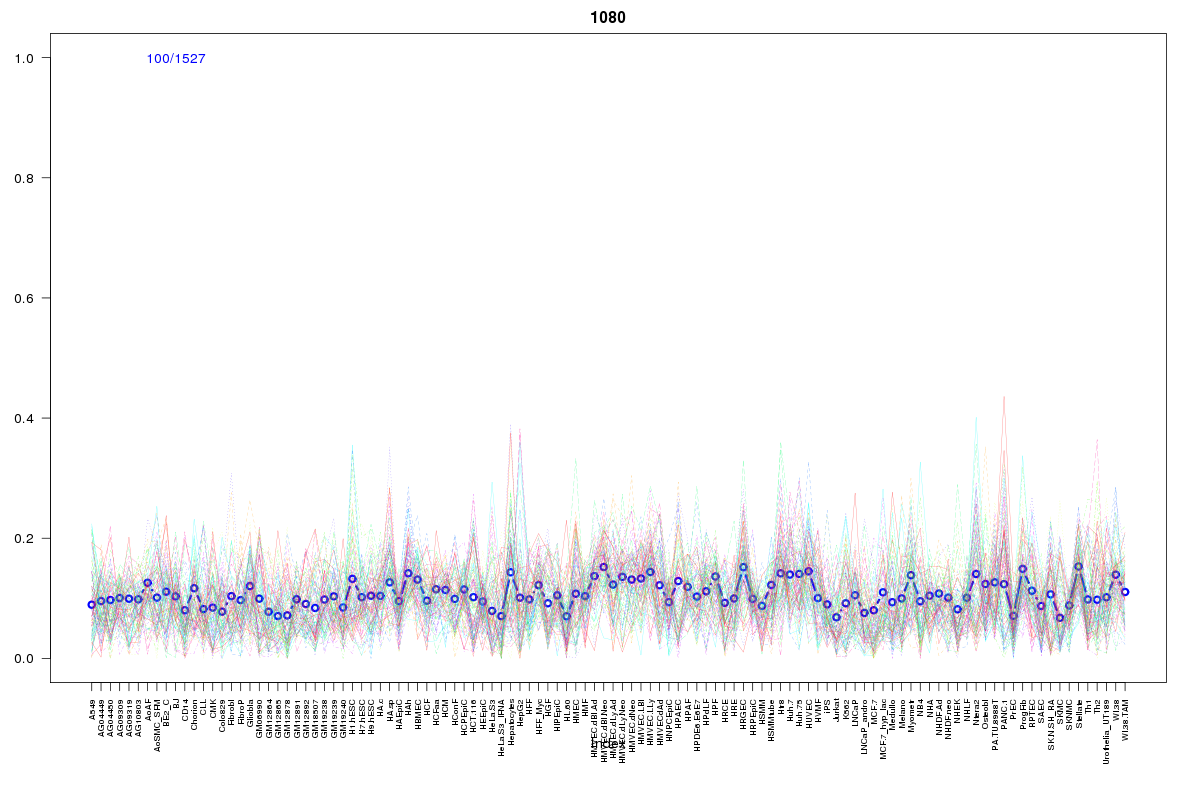 | 1080 | 1 |
 | 10 | 1 |
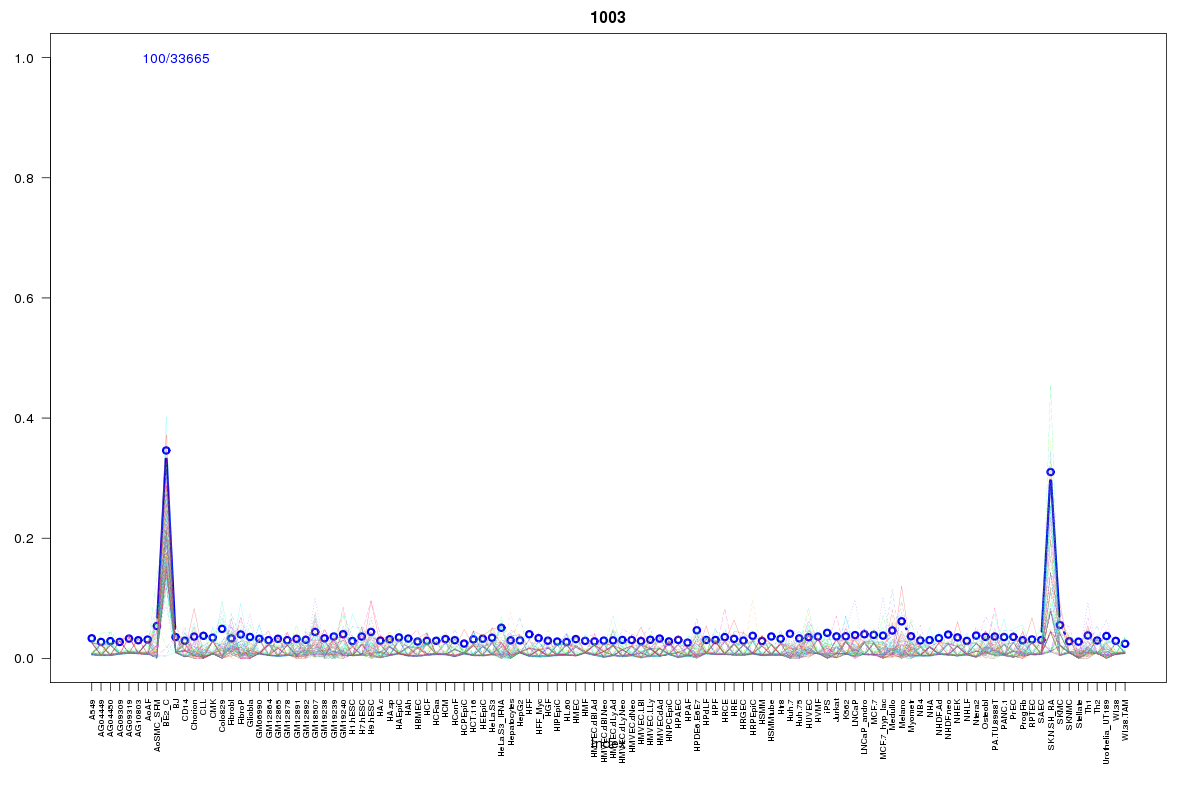 | 1003 | 1 |
Resources
BED file downloads
Connects to 59 DHS sitesTop 10 Correlated DHS Sites
p-values indiciate significant higher or lower correlation| Location | Cluster | P-value |
|---|---|---|
| chr10:21809940-21810090 | 1003 | 0.001 |
| chr10:21736545-21736695 | 15 | 0.001 |
| chr10:21799305-21799455 | 505 | 0.001 |
| chr10:21798980-21799130 | 412 | 0.001 |
| chr10:21812640-21812790 | 1154 | 0.001 |
| chr10:21786180-21786330 | 39 | 0.001 |
| chr10:21799720-21799870 | 812 | 0.002 |
| chr10:21807140-21807290 | 975 | 0.002 |
| chr10:21798005-21798155 | 110 | 0.002 |
| chr10:21798345-21798495 | 505 | 0.002 |
| chr10:21799525-21799675 | 505 | 0.002 |
External Databases
UCSCEnsembl (ENSG00000180592)