Gene: SATB1
chr3: 18386878-18466829Expression Profile
(log scale)
Graphical Connections
Distribution of linked clusters:
You may find it interesting if many of the connected DHS sites belong to the same cluster.| Cluster Profile | Cluster ID | Number of DHS sites in this cluster |
|---|---|---|
 | 2110 | 15 |
 | 2072 | 6 |
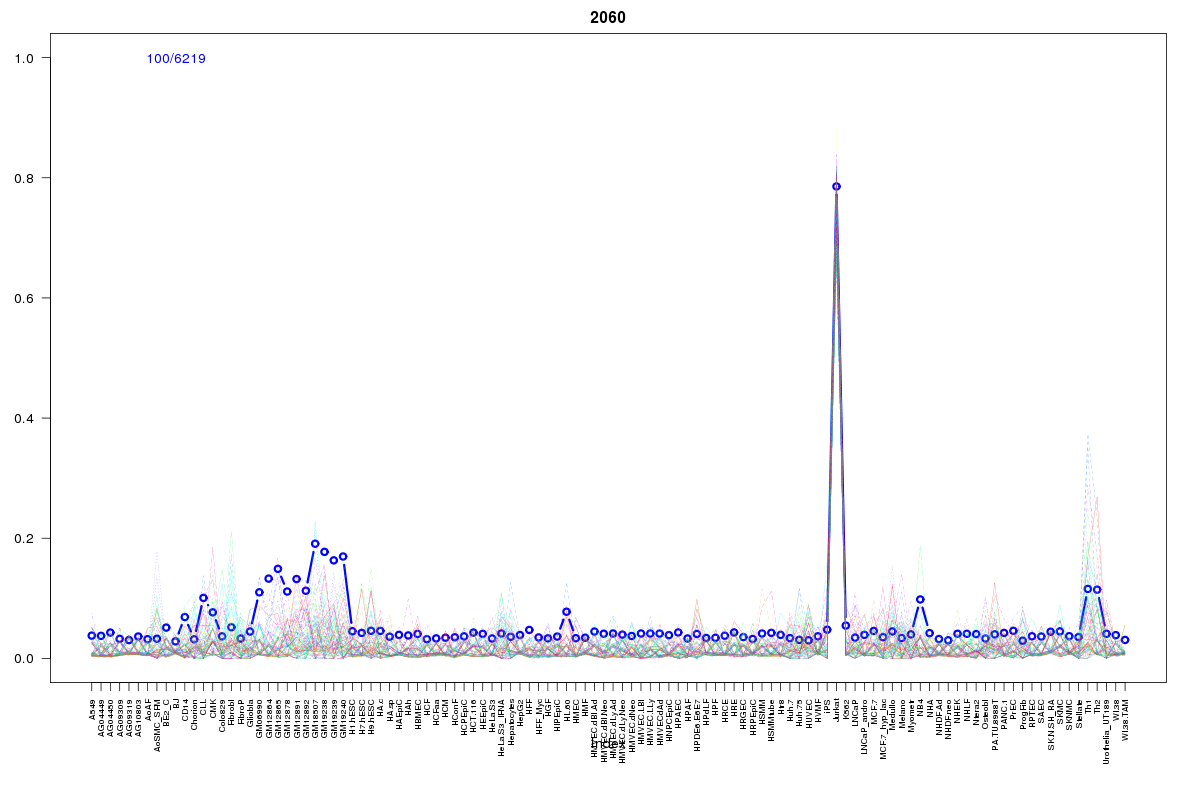 | 2060 | 4 |
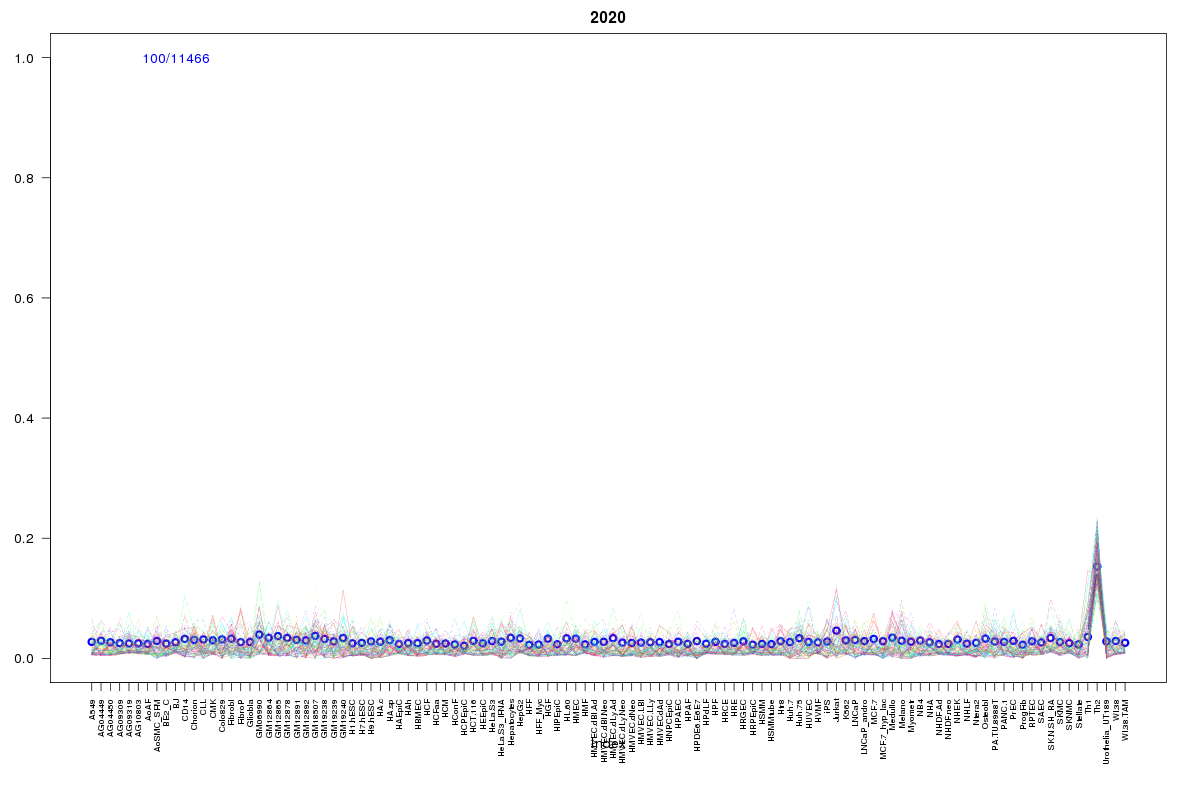 | 2020 | 4 |
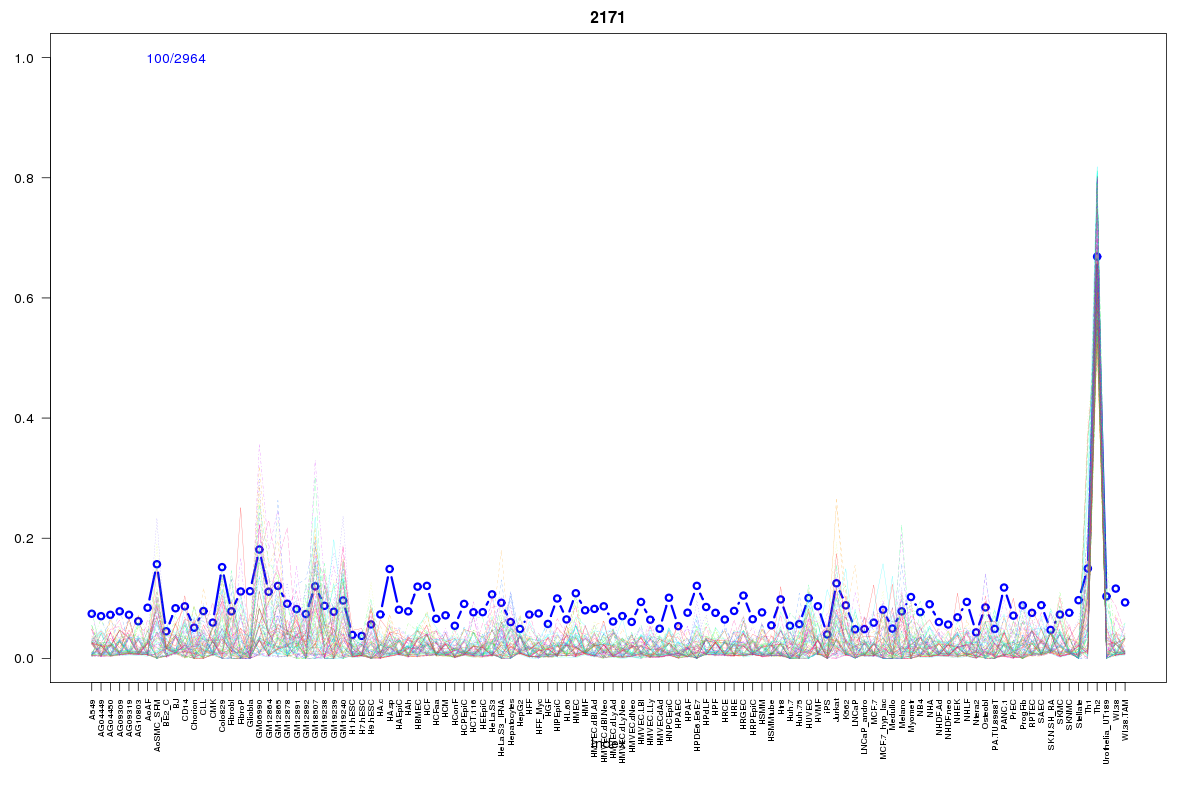 | 2171 | 4 |
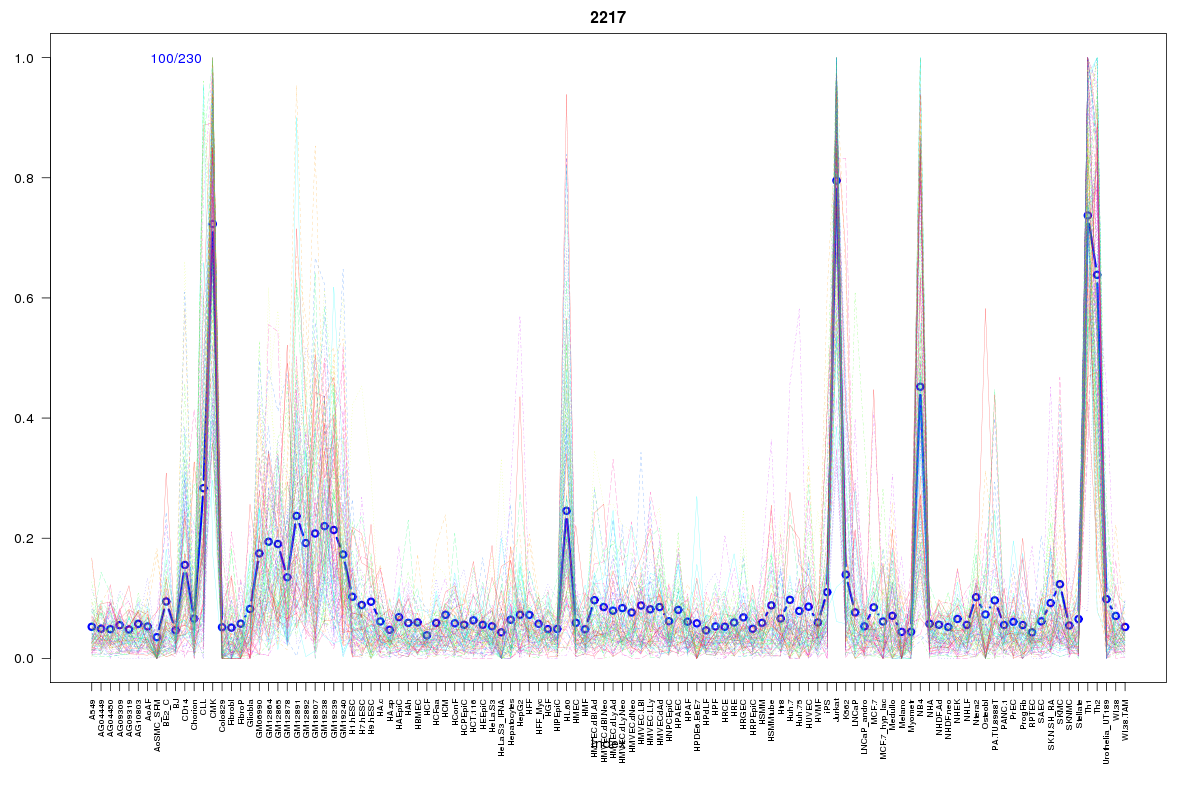 | 2217 | 3 |
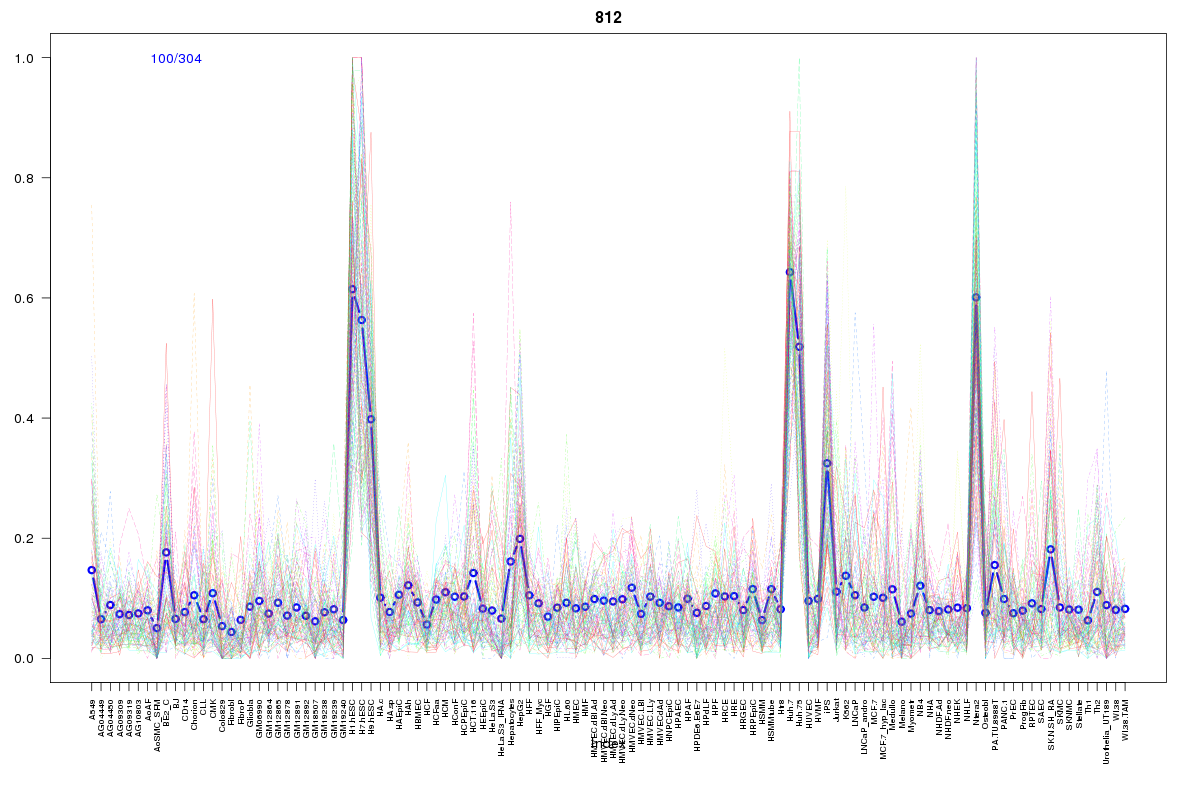 | 812 | 1 |
 | 1404 | 1 |
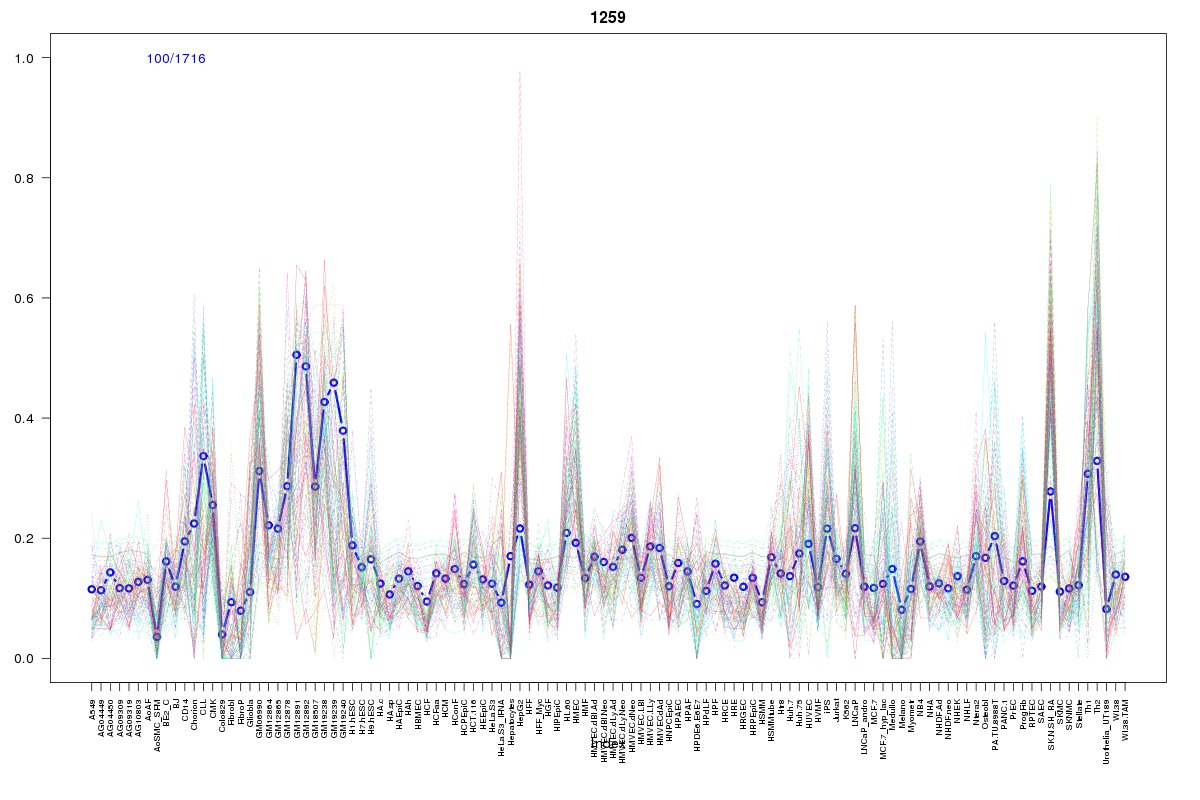 | 1259 | 1 |
 | 2068 | 1 |
 | 10 | 1 |
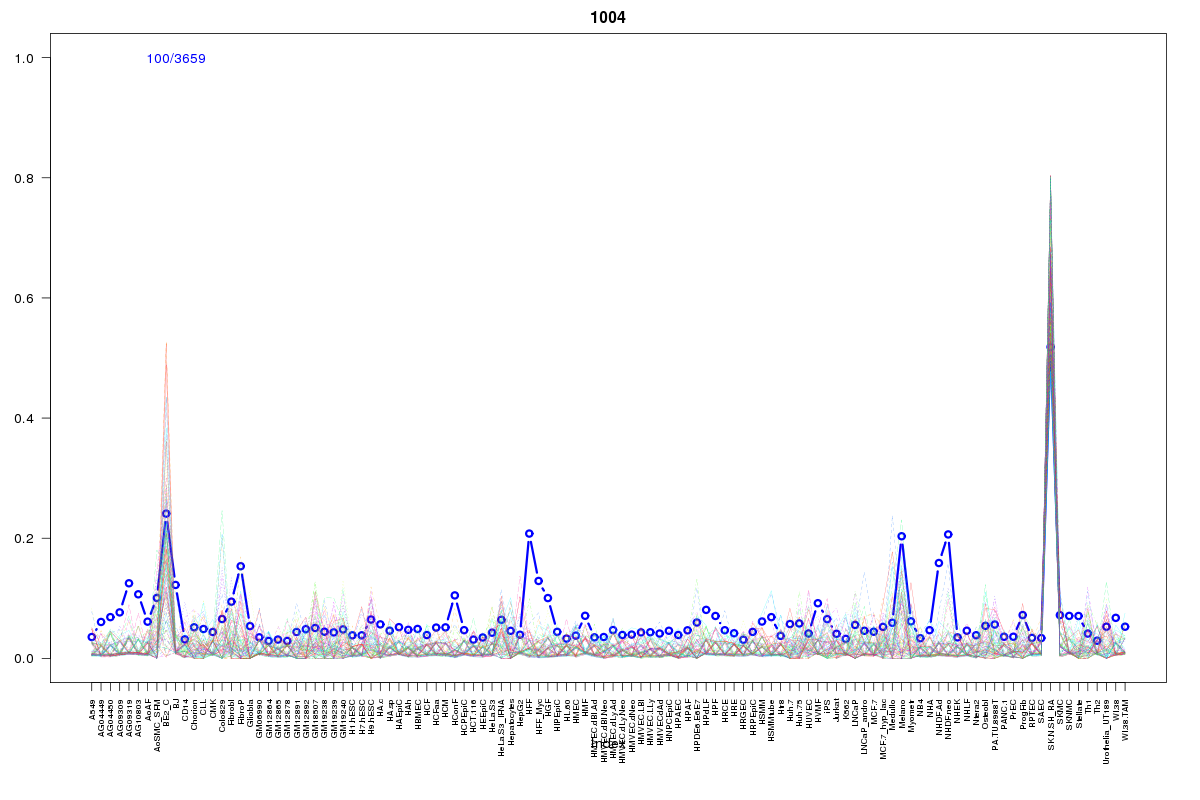 | 1004 | 1 |
 | 2114 | 1 |
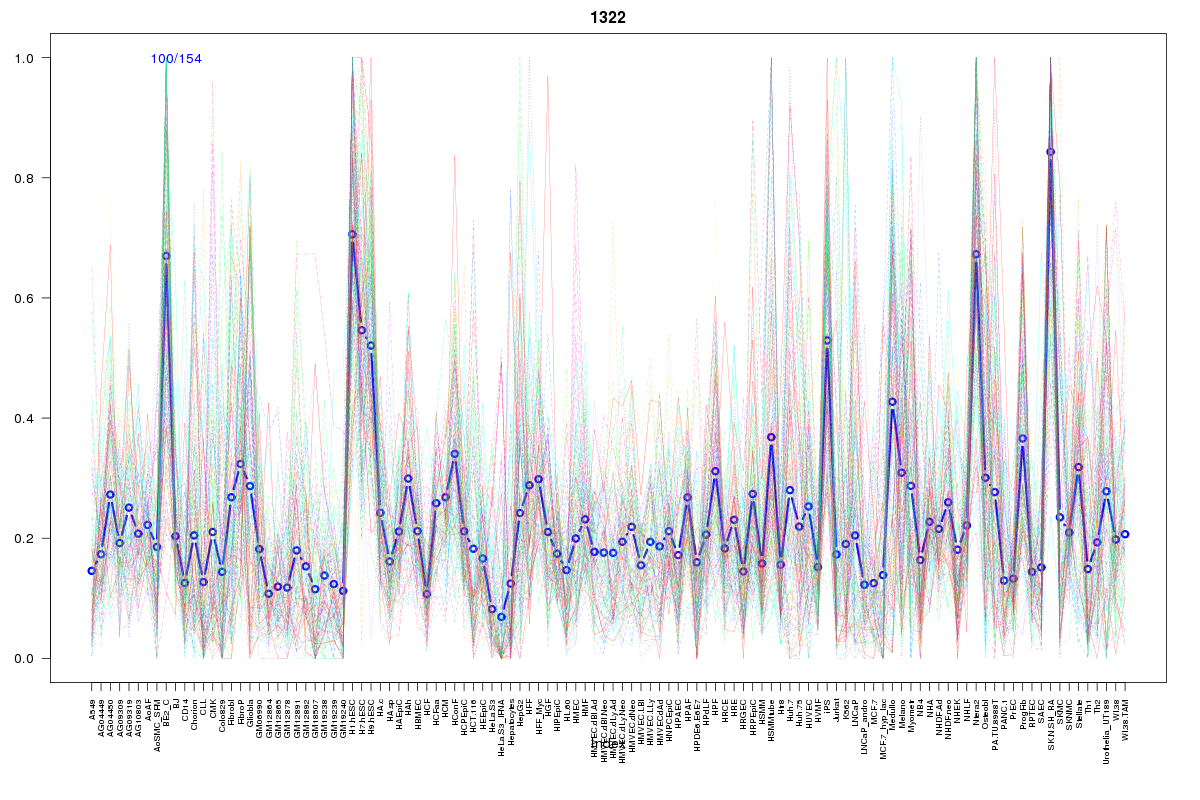 | 1322 | 1 |
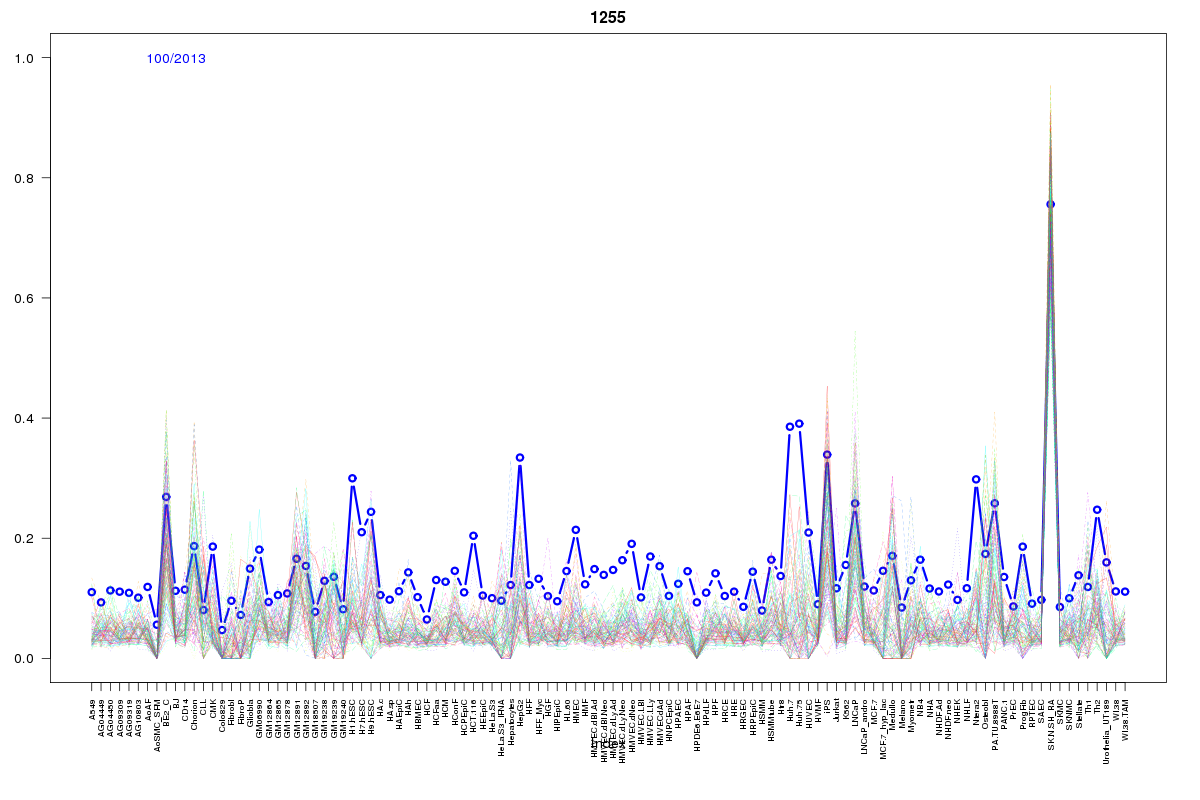 | 1255 | 1 |
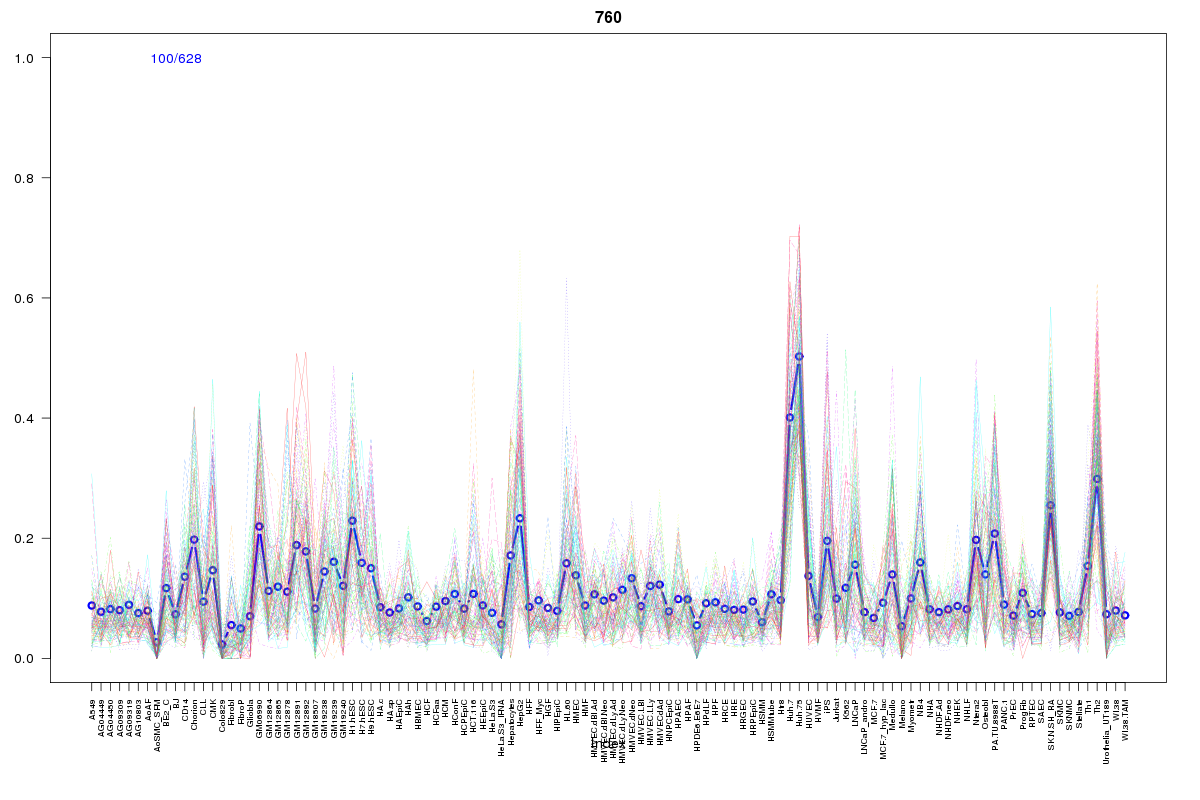 | 760 | 1 |
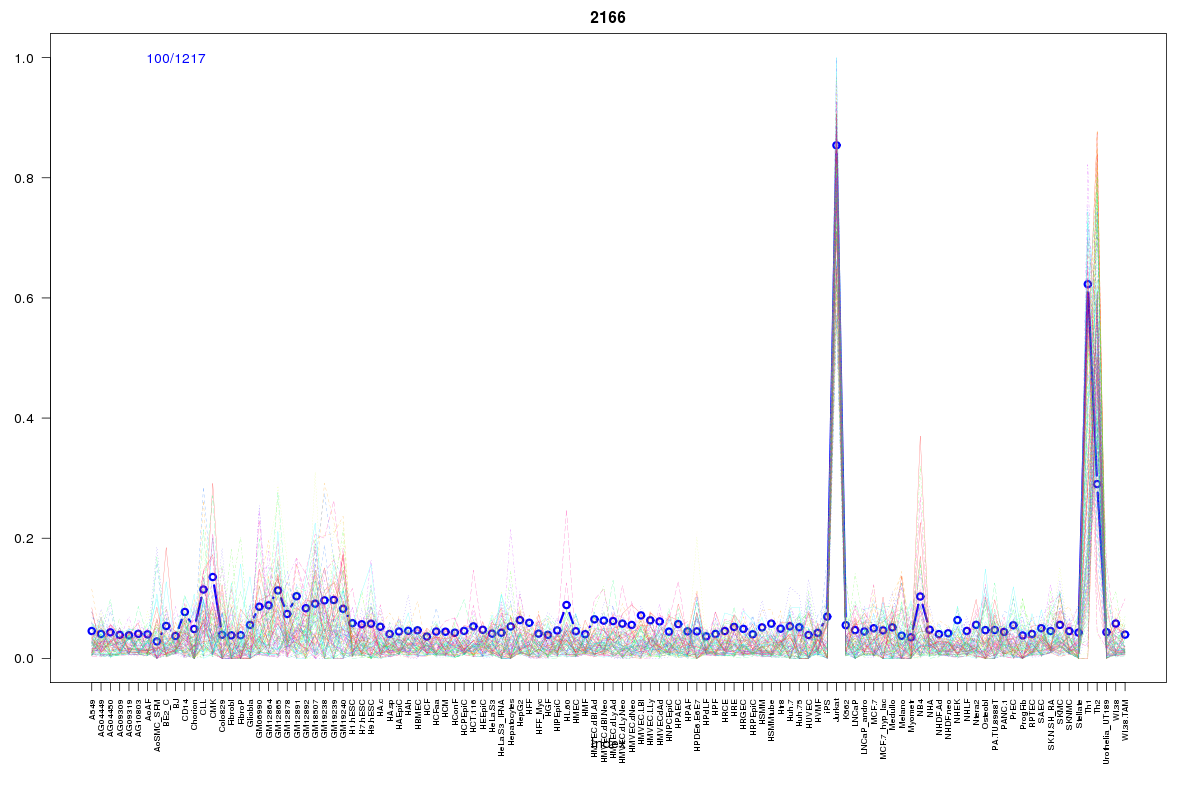 | 2166 | 1 |
 | 1078 | 1 |
Resources
BED file downloads
Connects to 48 DHS sitesTop 10 Correlated DHS Sites
p-values indiciate significant higher or lower correlationExternal Databases
UCSCEnsembl (ENSG00000182568)