Gene: PTRHD1
chr2: 25012602-25016251Expression Profile
(log scale)
Graphical Connections
Distribution of linked clusters:
You may find it interesting if many of the connected DHS sites belong to the same cluster.| Cluster Profile | Cluster ID | Number of DHS sites in this cluster |
|---|---|---|
 | 1008 | 2 |
 | 1724 | 2 |
 | 860 | 1 |
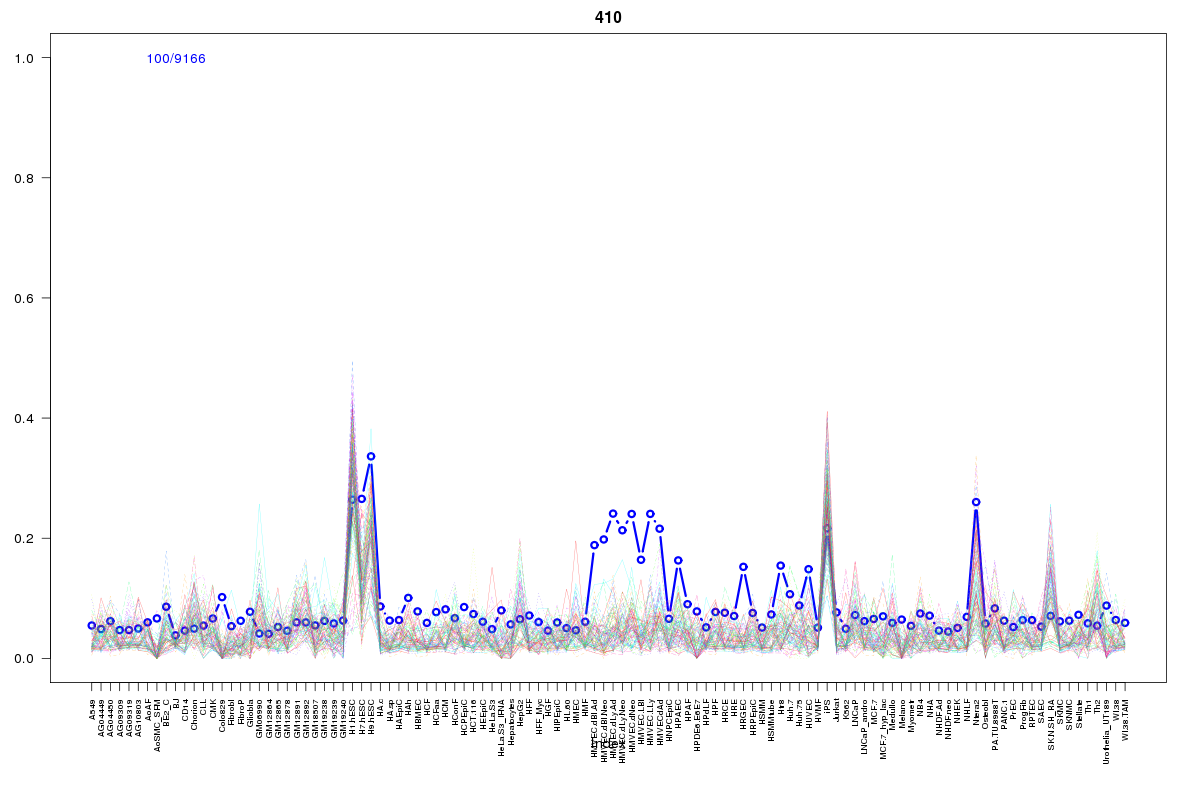 | 410 | 1 |
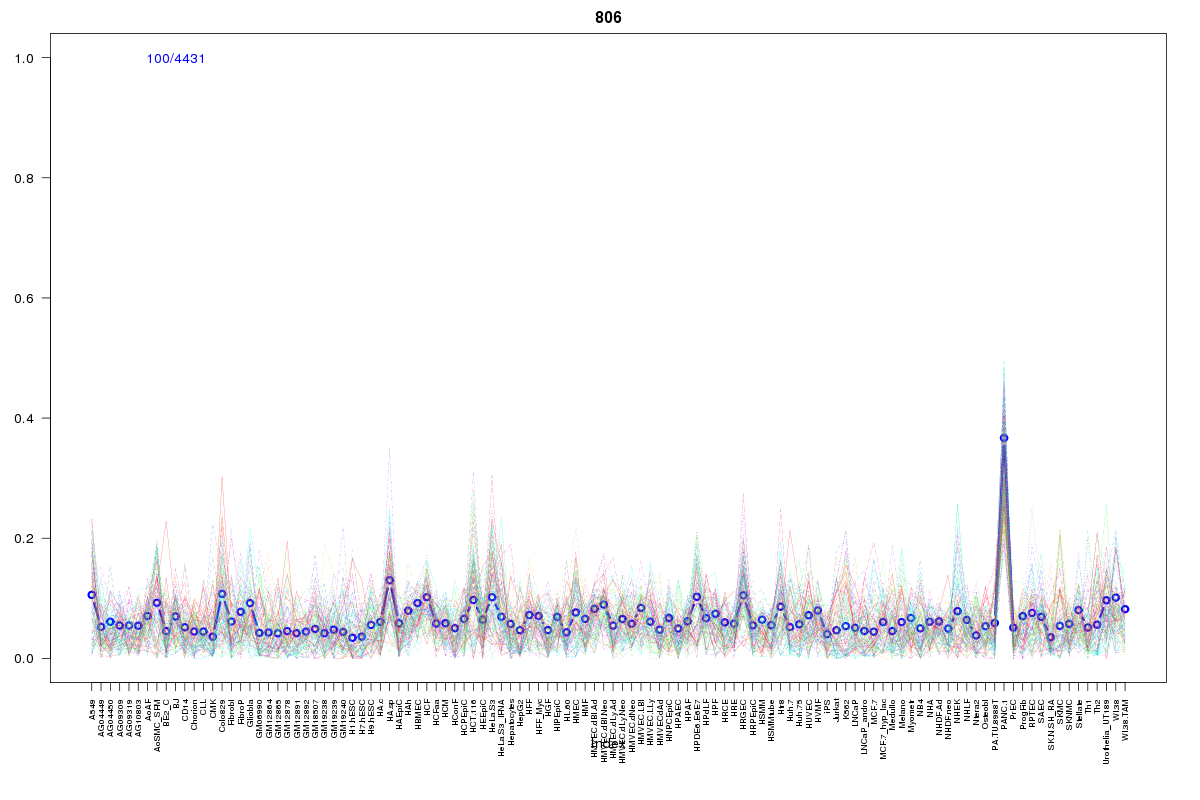 | 806 | 1 |
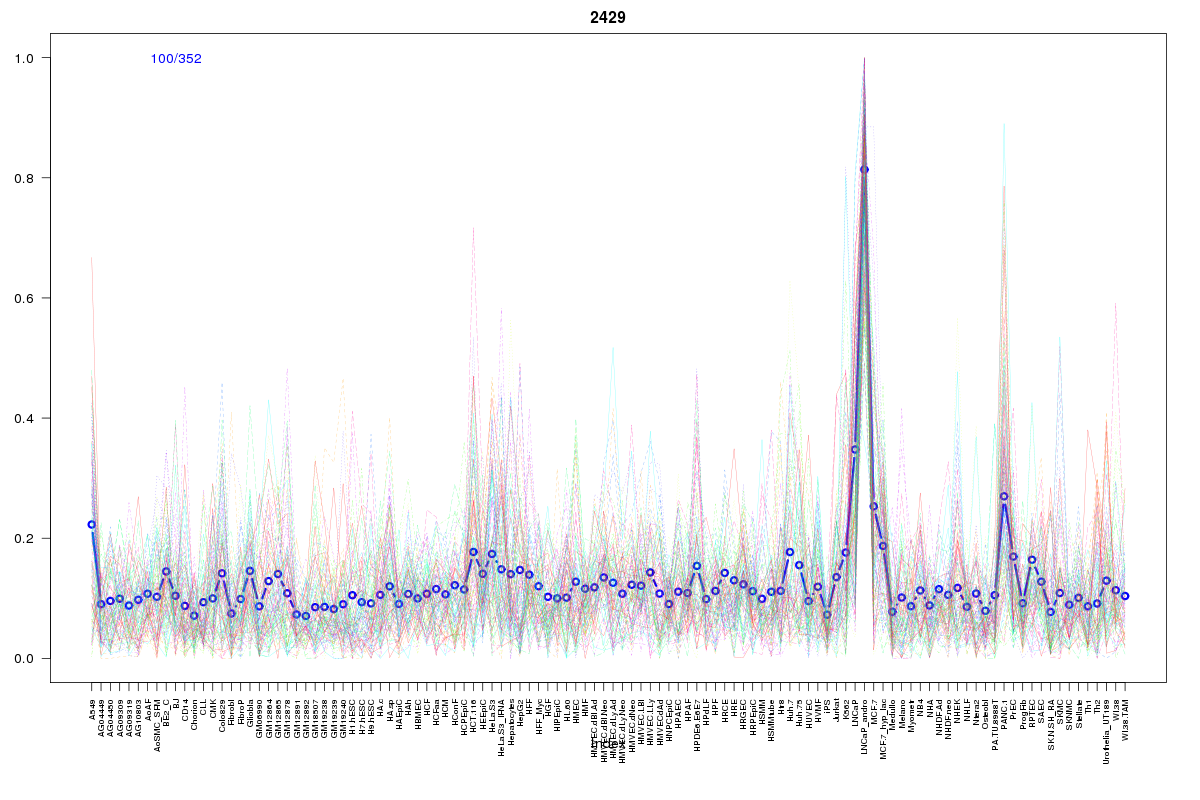 | 2429 | 1 |
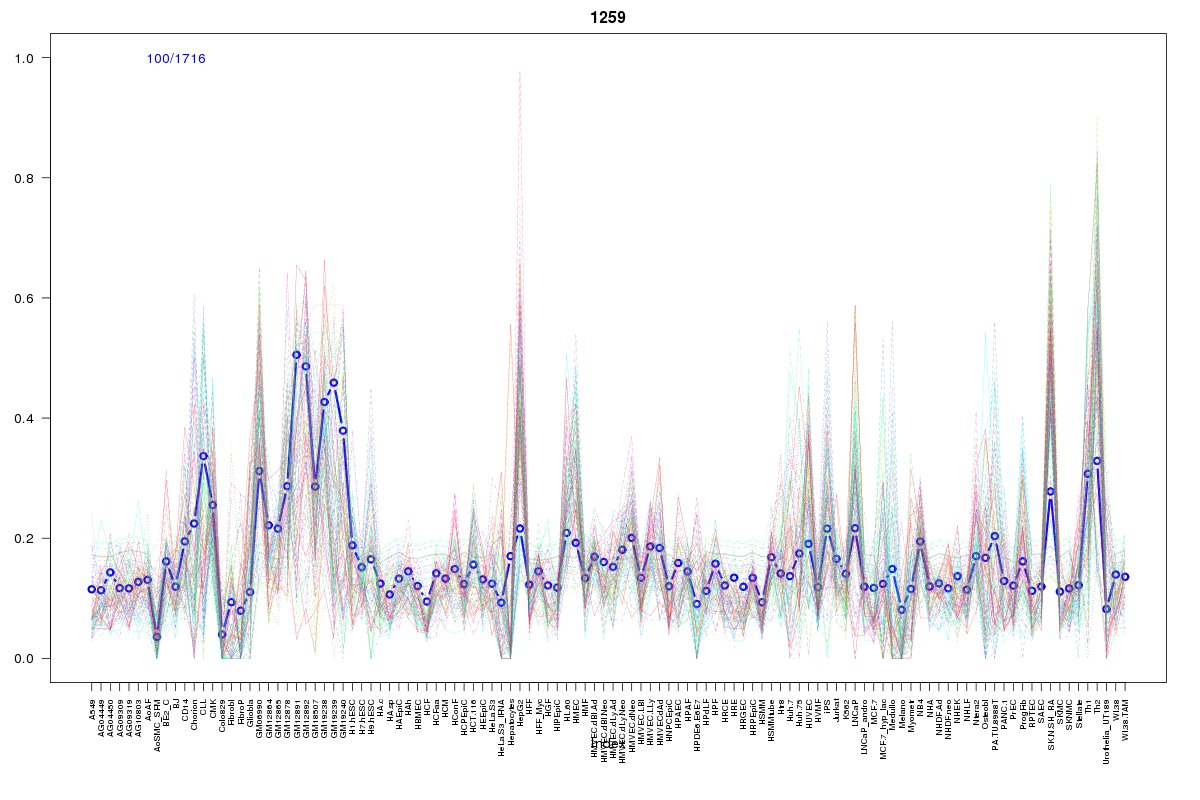 | 1259 | 1 |
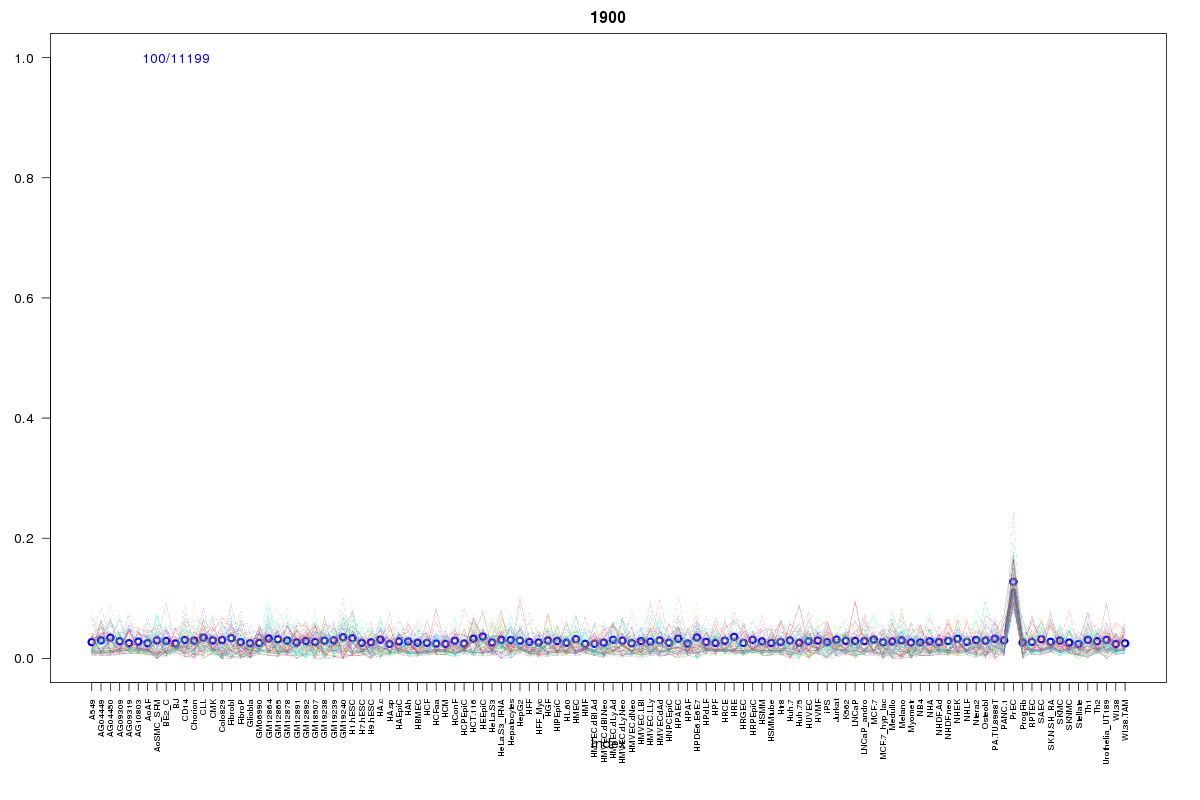 | 1900 | 1 |
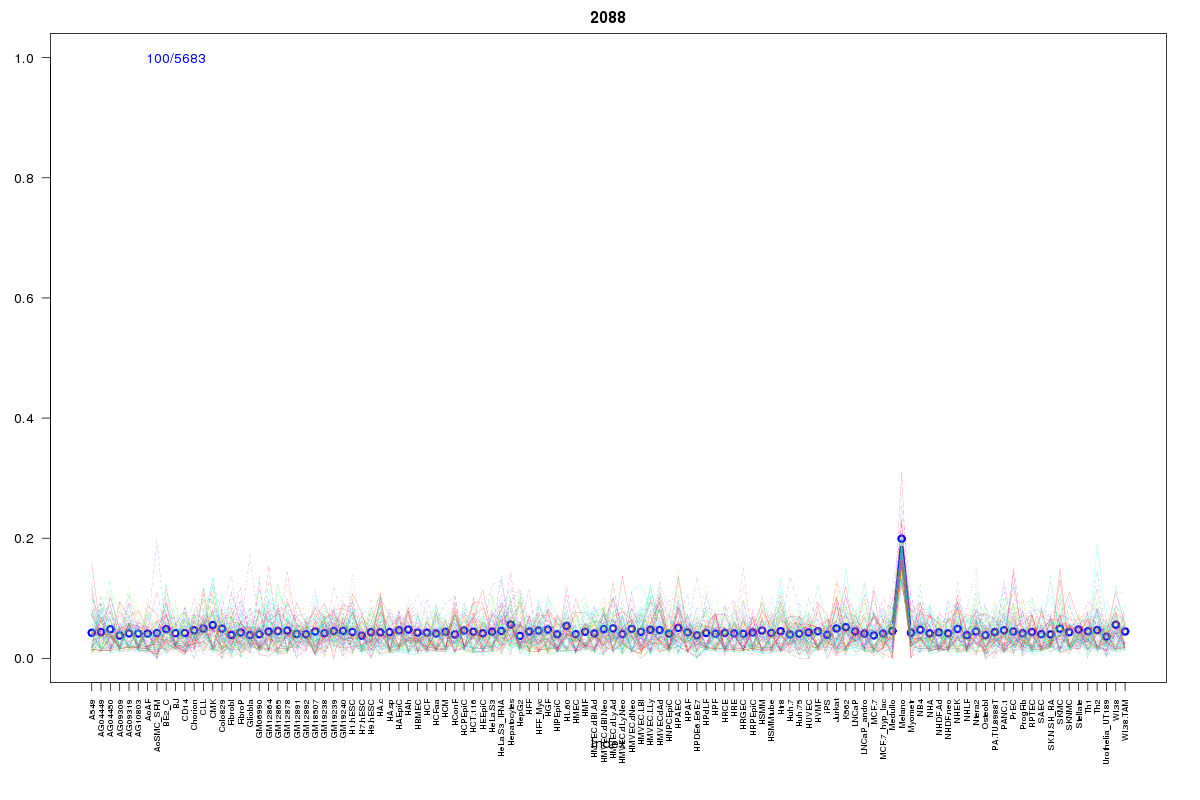 | 2088 | 1 |
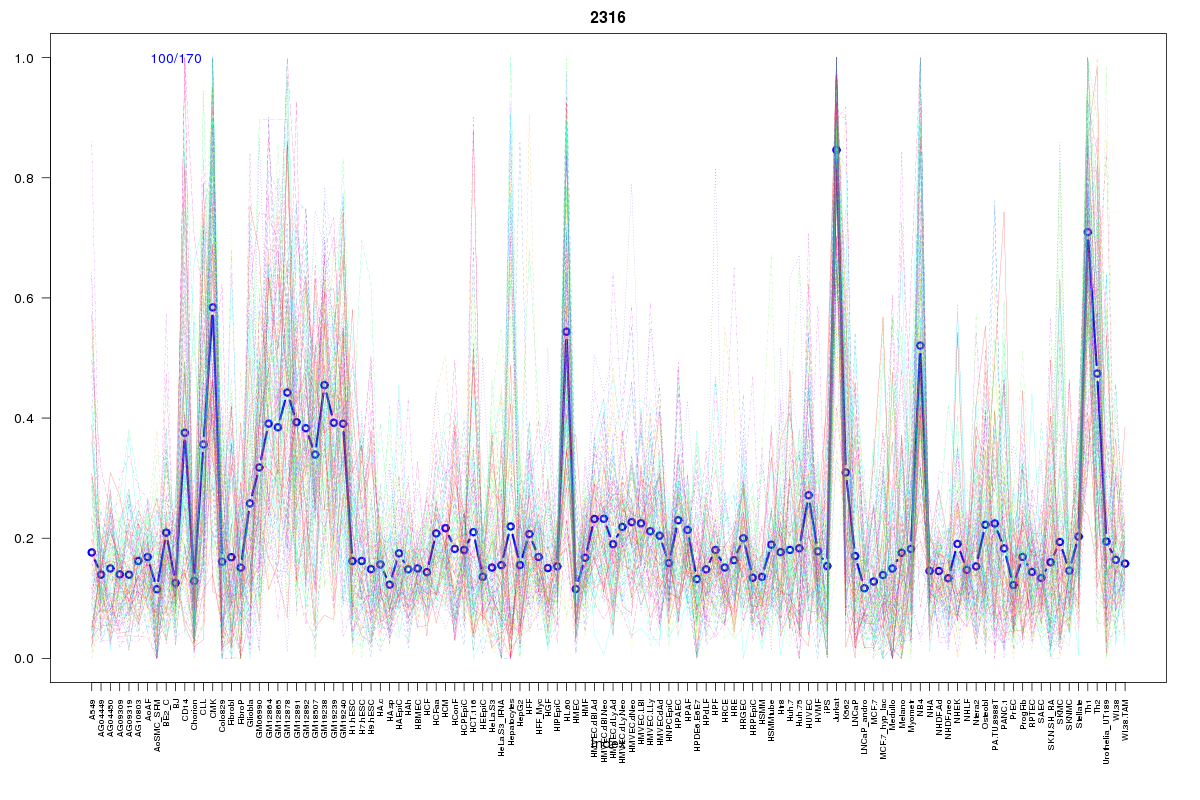 | 2316 | 1 |
 | 2052 | 1 |
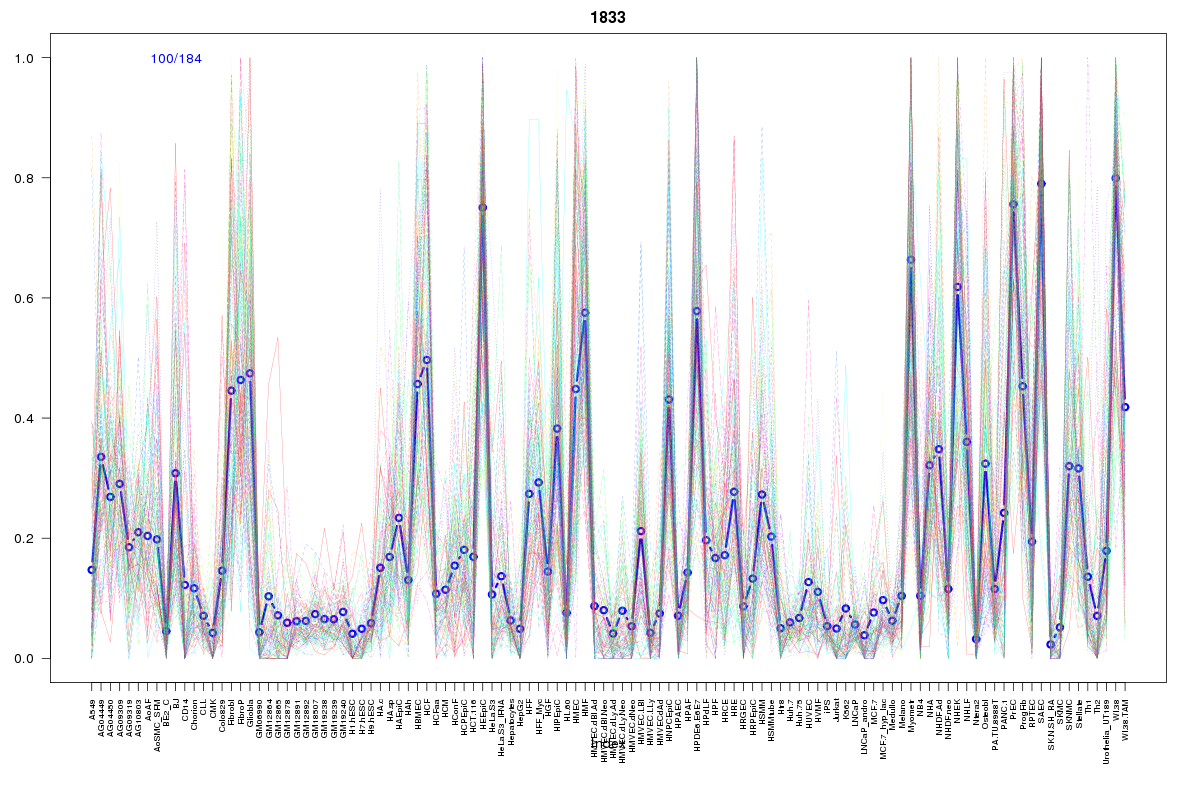 | 1833 | 1 |
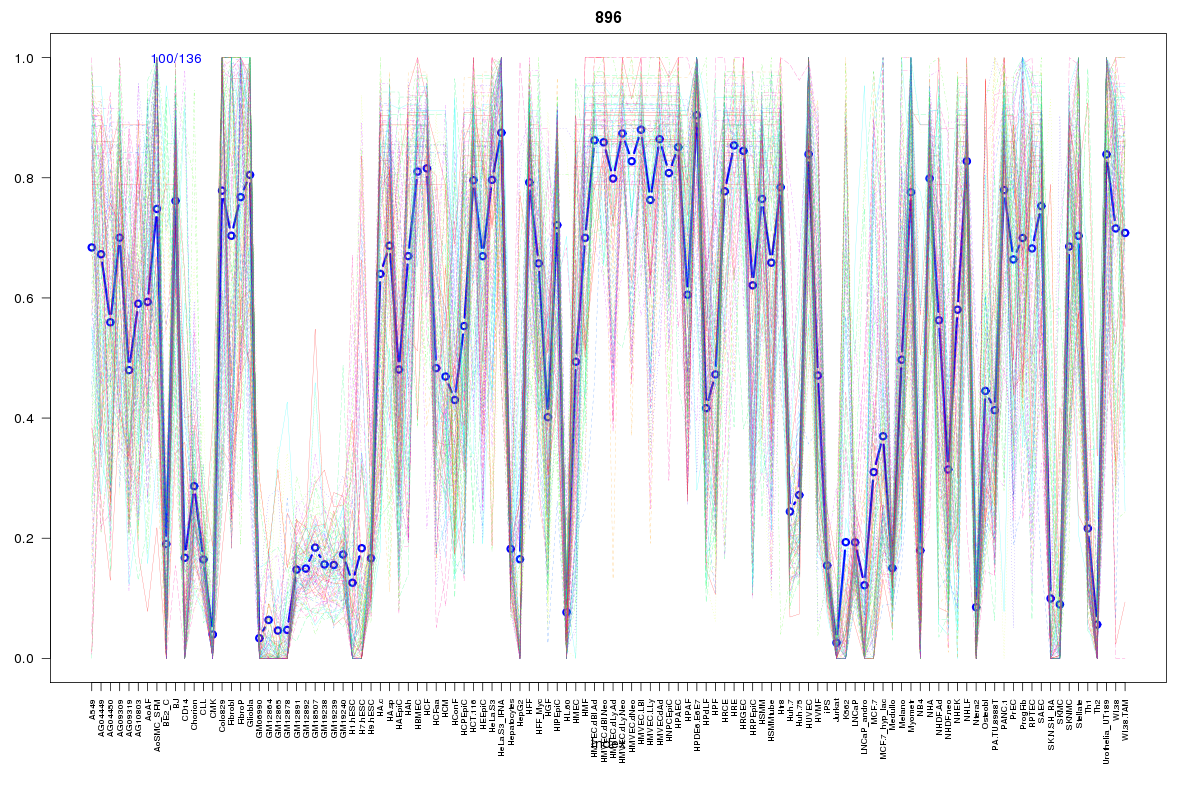 | 896 | 1 |
 | 1078 | 1 |
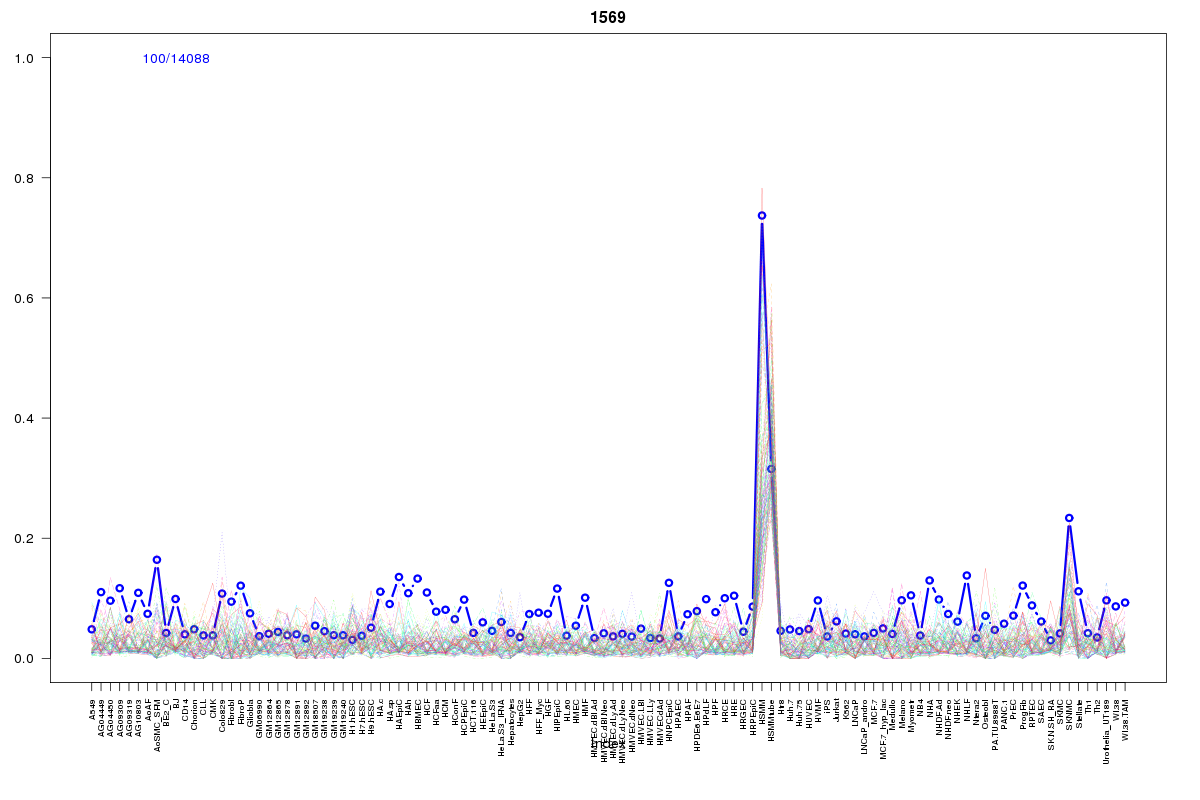 | 1569 | 1 |
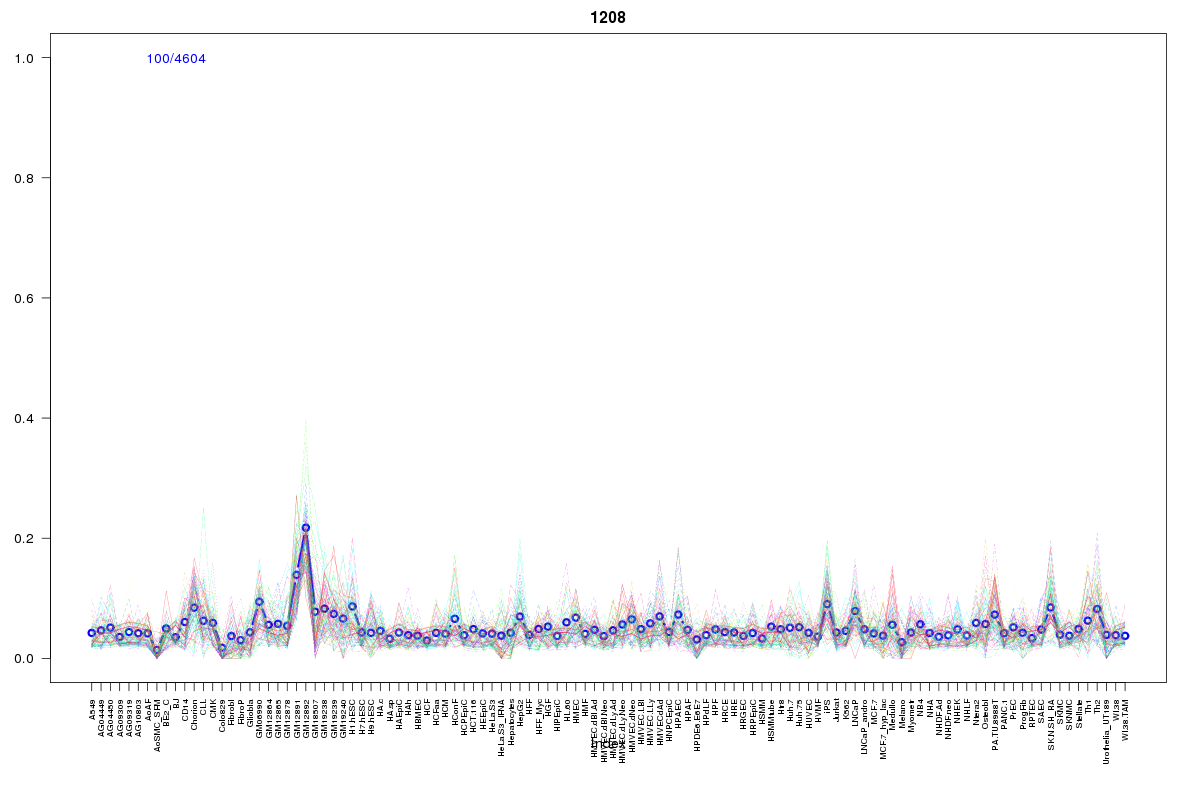 | 1208 | 1 |
 | 1721 | 1 |
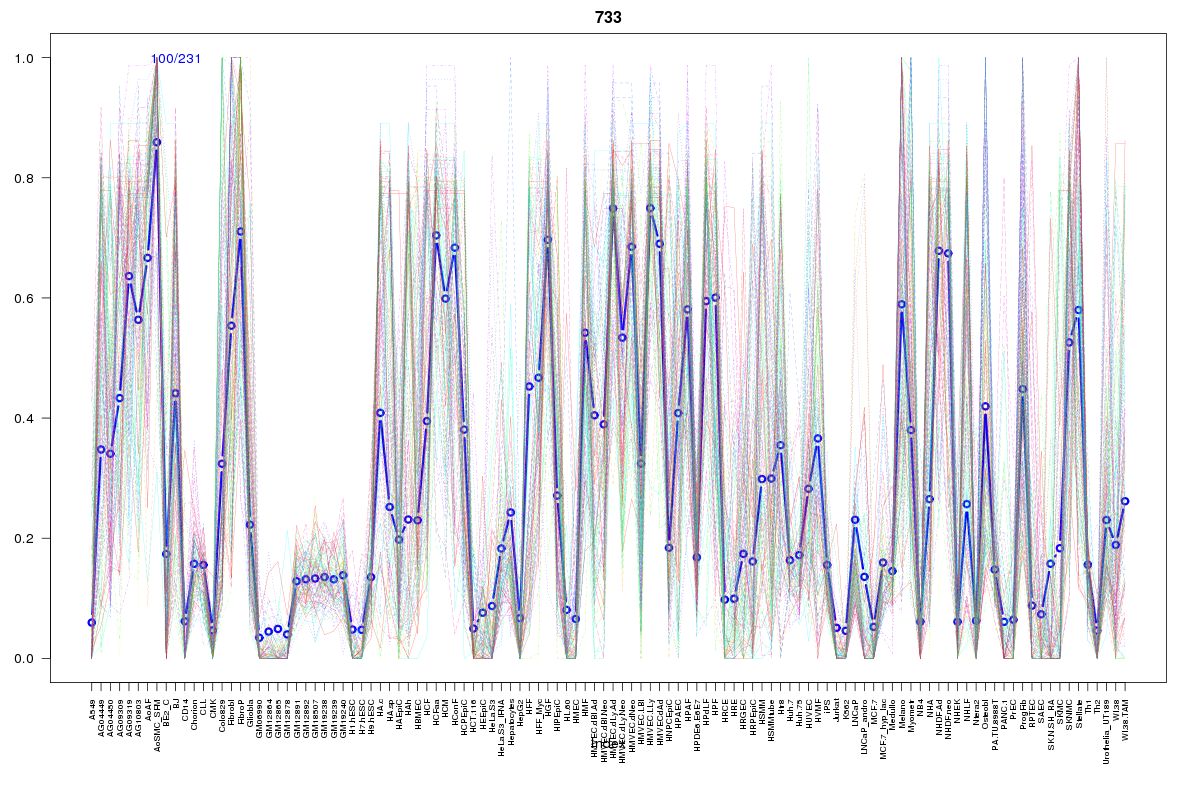 | 733 | 1 |
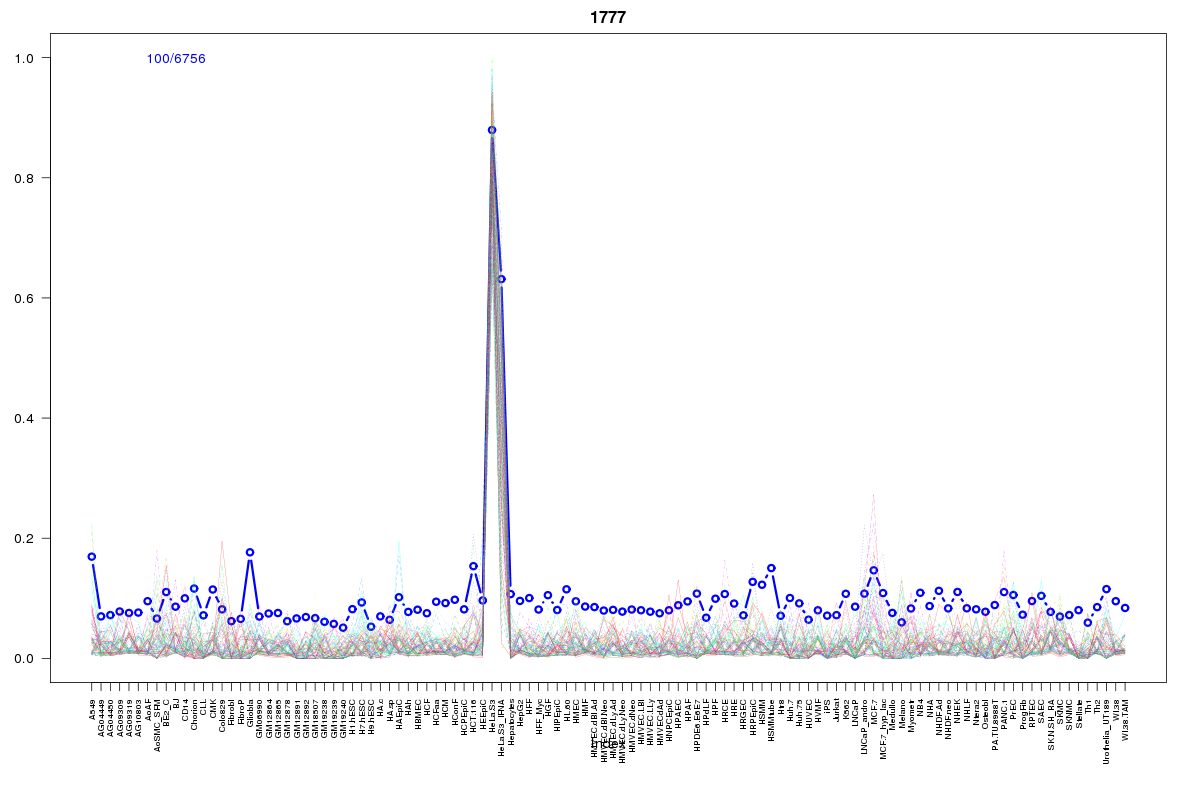 | 1777 | 1 |
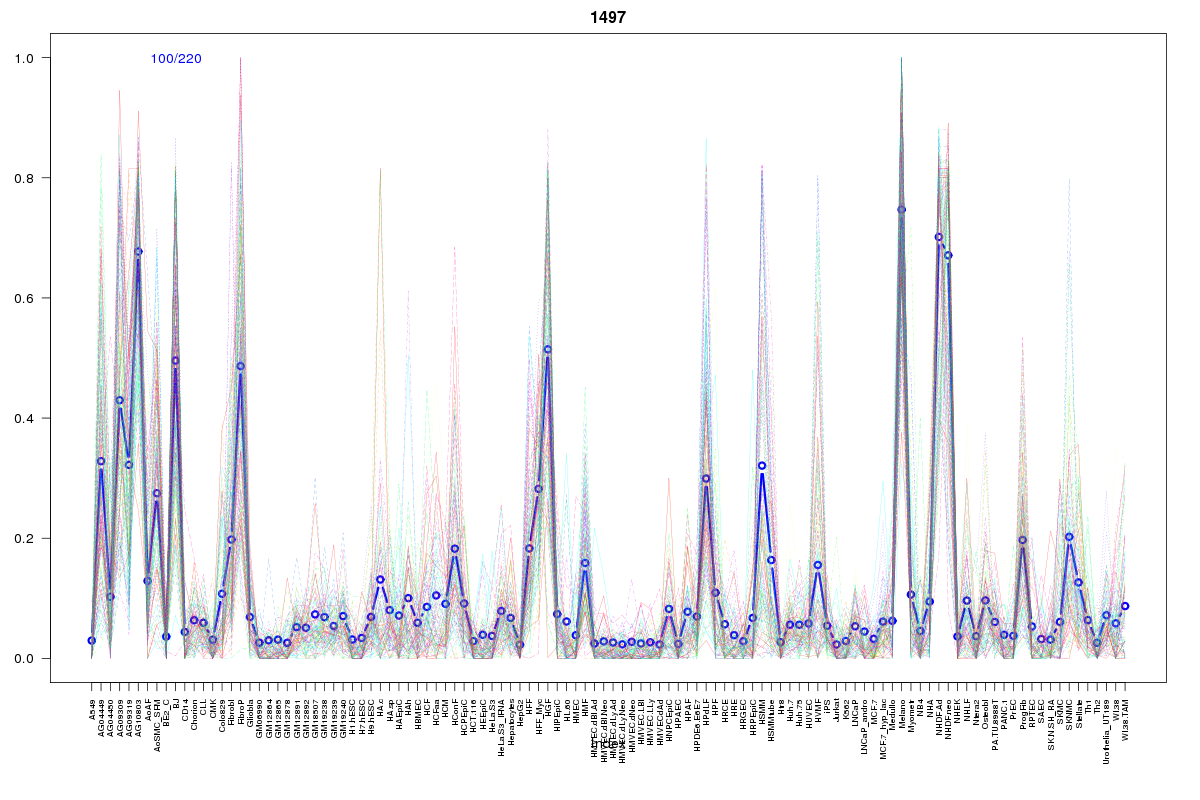 | 1497 | 1 |
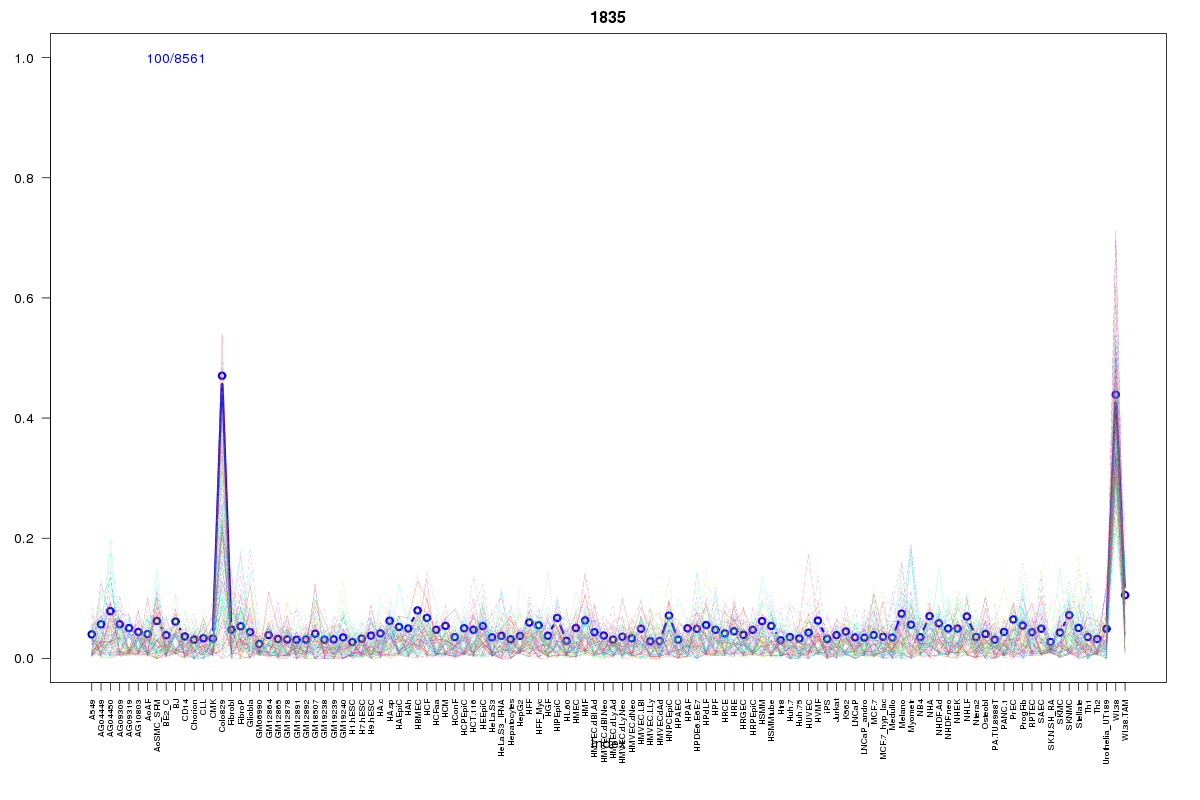 | 1835 | 1 |
Resources
BED file downloads
Connects to 23 DHS sitesTop 10 Correlated DHS Sites
p-values indiciate significant higher or lower correlation| Location | Cluster | P-value |
|---|---|---|
| chr2:25015365-25015515 | 806 | 0.001 |
| chr2:25096680-25096830 | 1777 | 0.002 |
| chr2:25096525-25096675 | 1724 | 0.002 |
| chr2:25097245-25097395 | 1724 | 0.006 |
| chr2:25015560-25015710 | 2429 | 0.007 |
| chr2:25047980-25048130 | 2316 | 0.01 |
| chr2:25016460-25016610 | 1259 | 0.013 |
| chr2:25095345-25095495 | 1208 | 0.02 |
| chr2:25058085-25058235 | 2052 | 0.02 |
| chr2:25105425-25105575 | 1835 | 0.02 |
| chr2:25030705-25030855 | 1900 | 0.019 |
External Databases
UCSCEnsembl (ENSG00000184924)