Gene: HTR3D
chr3: 183749331-183757157Expression Profile
(log scale)
Graphical Connections
Distribution of linked clusters:
You may find it interesting if many of the connected DHS sites belong to the same cluster.| Cluster Profile | Cluster ID | Number of DHS sites in this cluster |
|---|---|---|
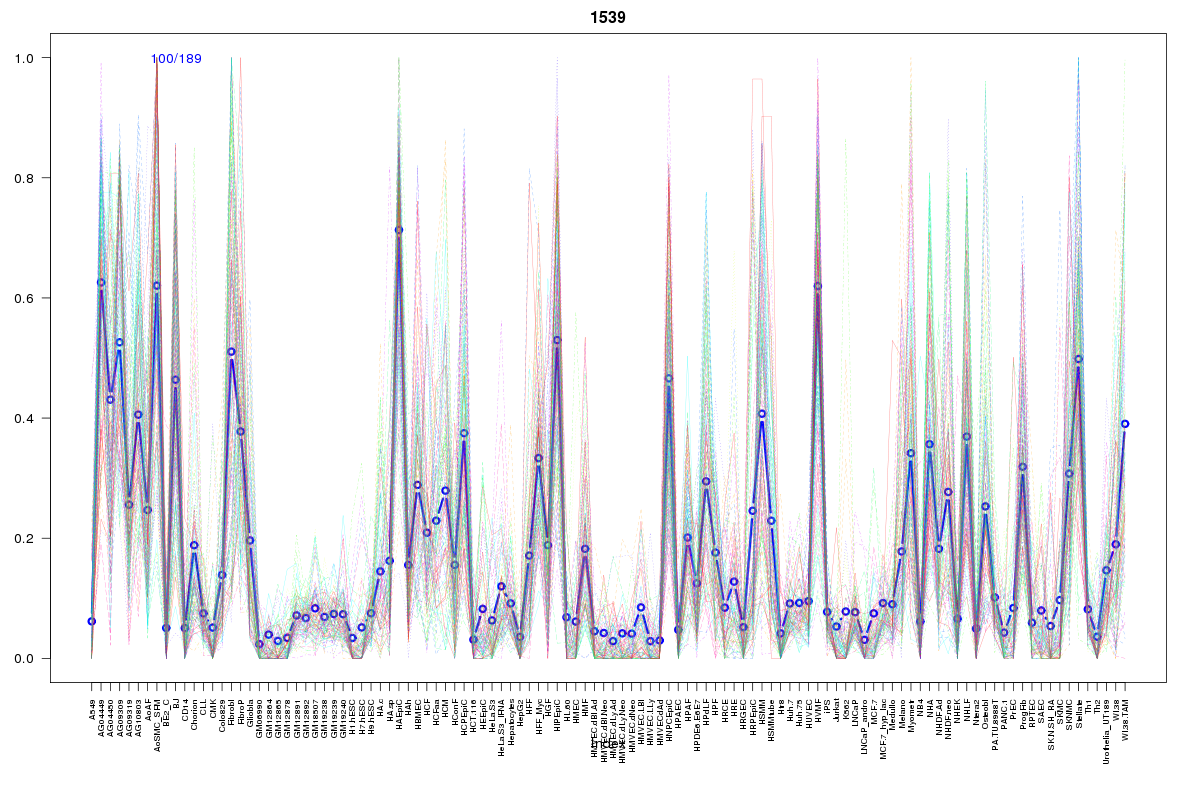 | 1539 | 1 |
 | 230 | 1 |
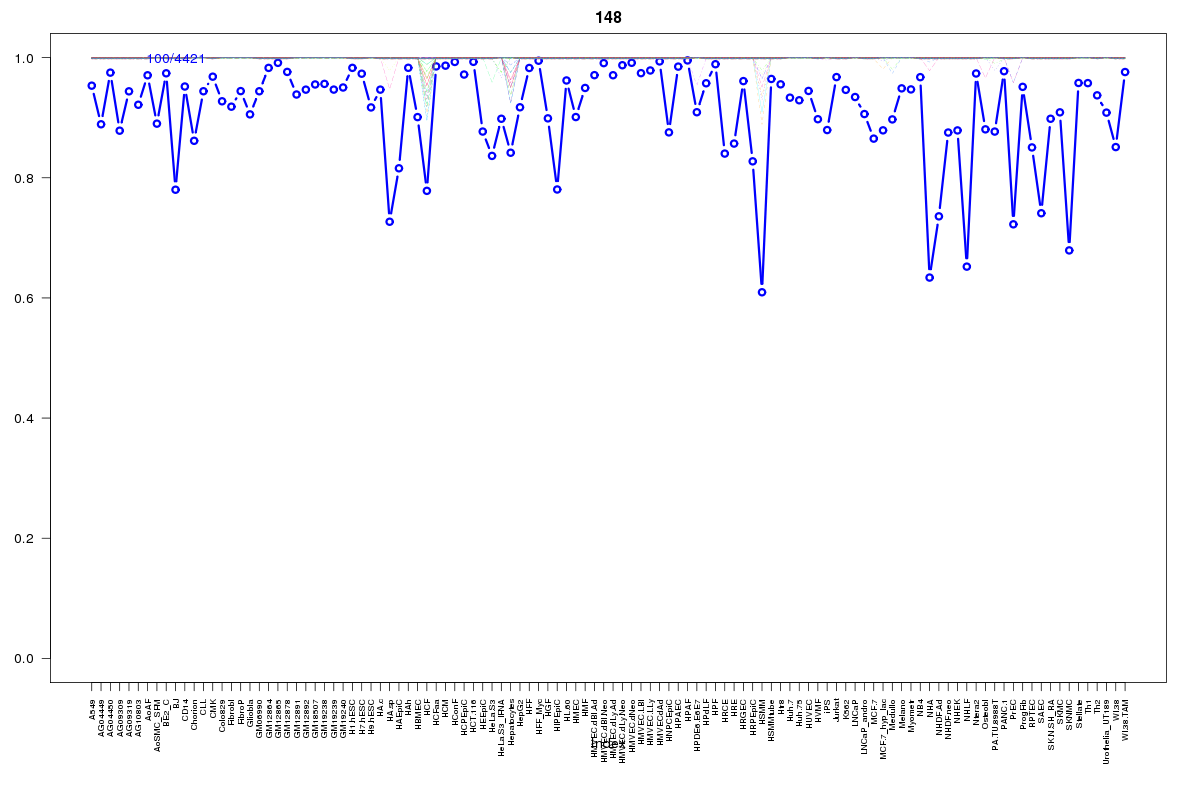 | 148 | 1 |
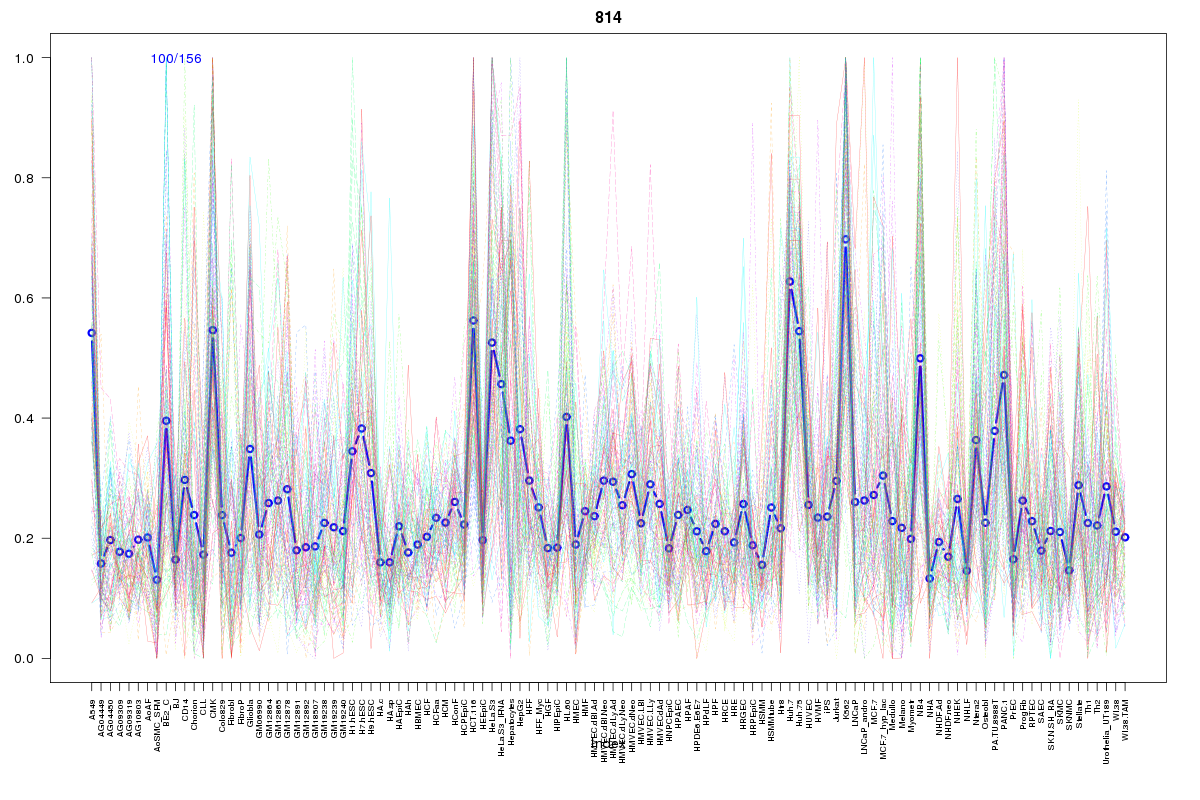 | 814 | 1 |
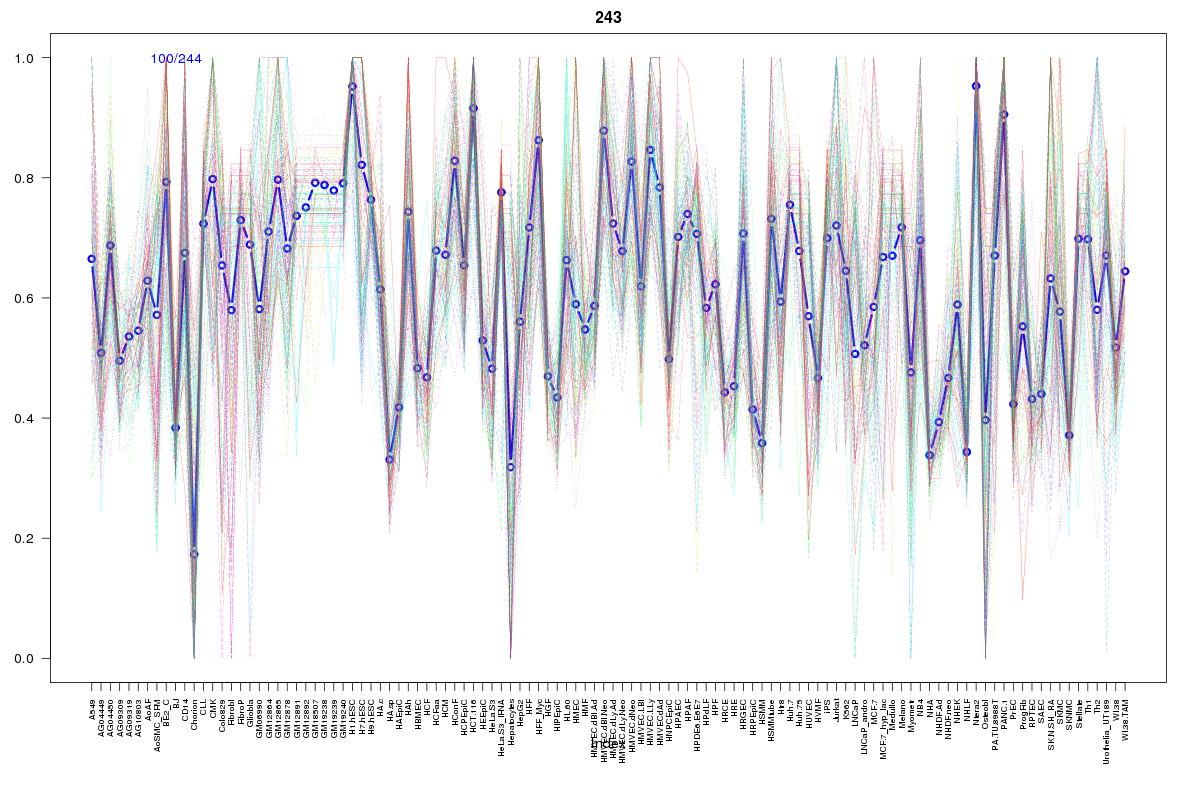 | 243 | 1 |
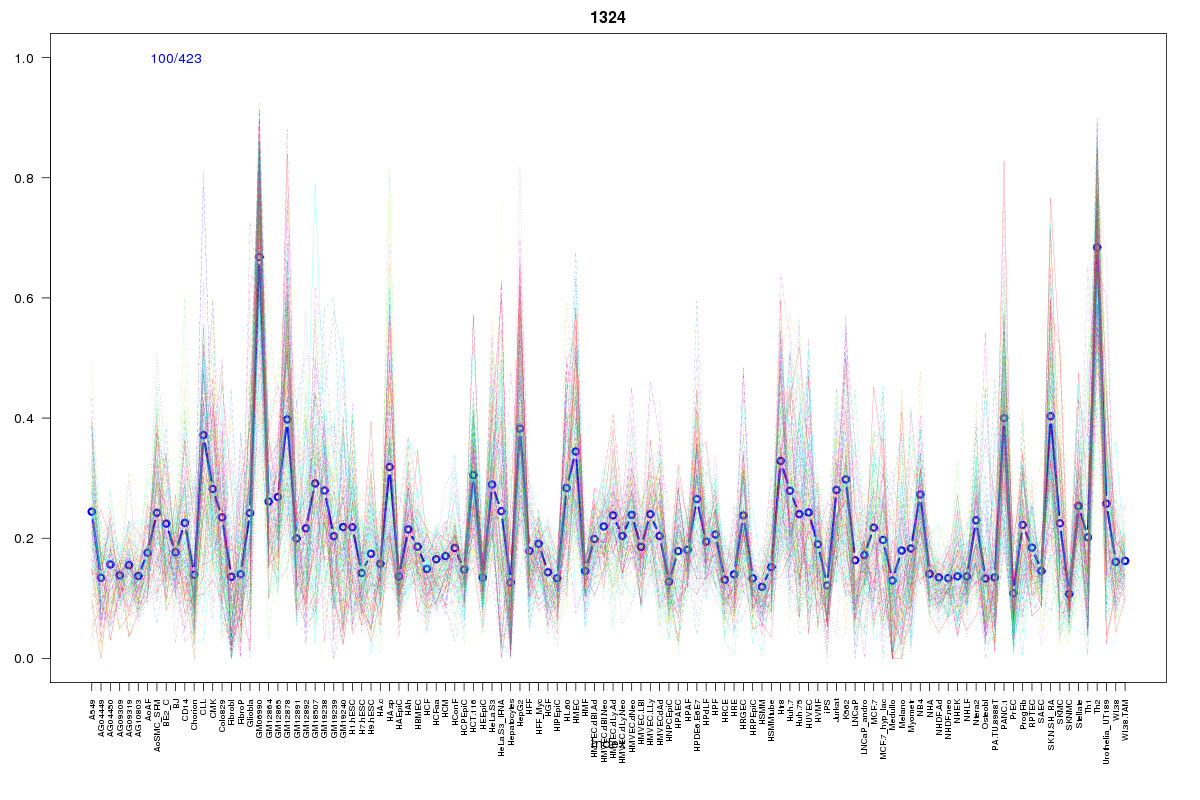 | 1324 | 1 |
 | 149 | 1 |
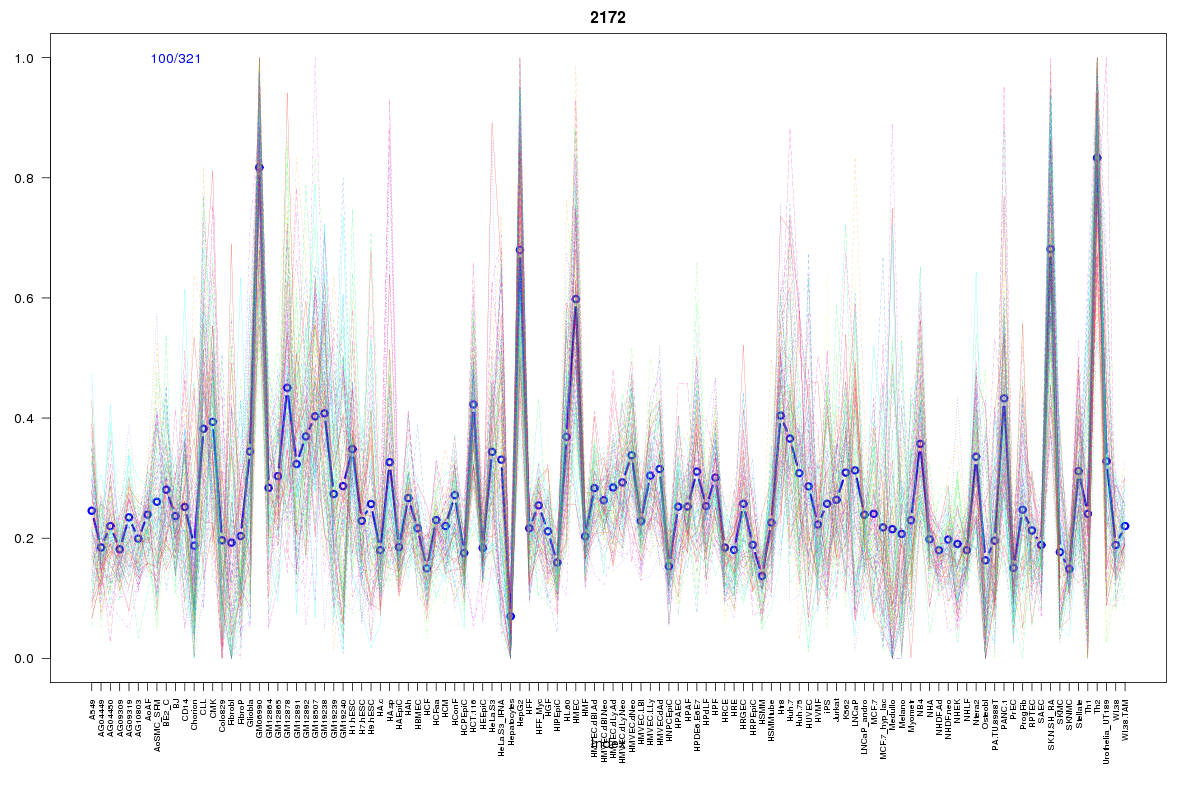 | 2172 | 1 |
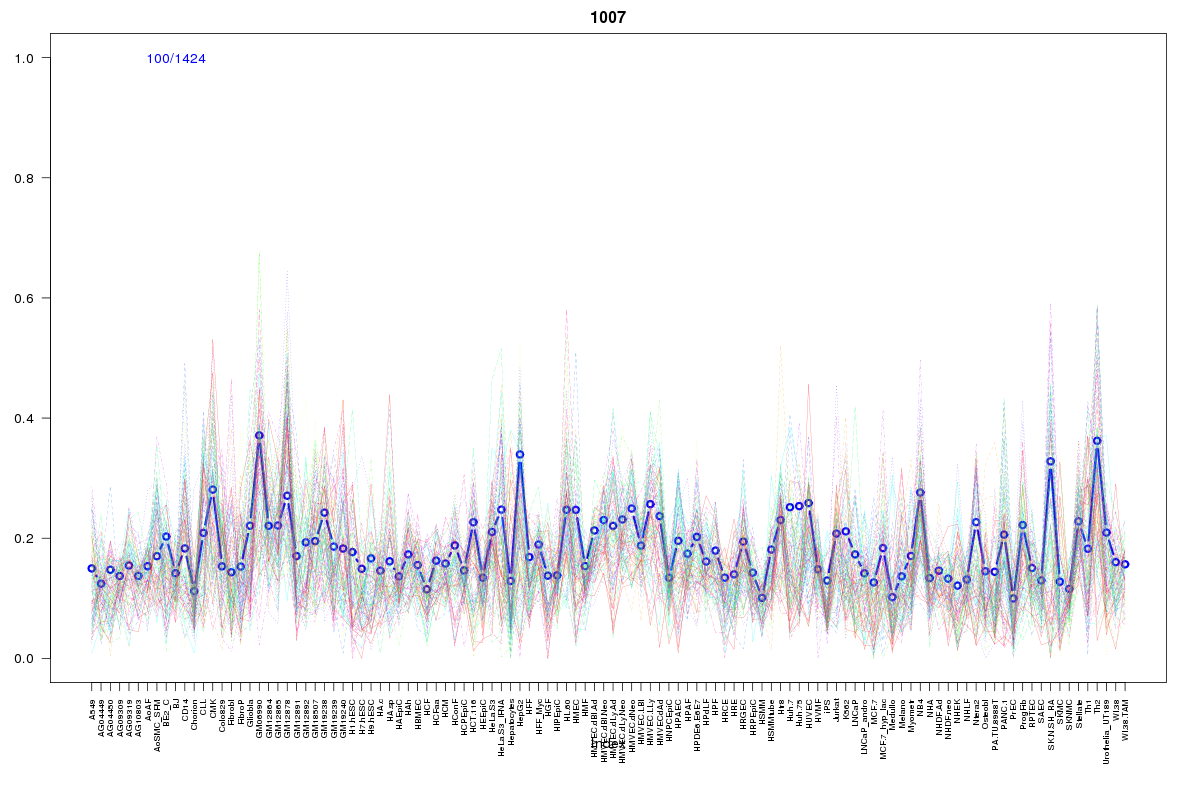 | 1007 | 1 |
Resources
BED file downloads
Connects to 9 DHS sitesTop 10 Correlated DHS Sites
p-values indiciate significant higher or lower correlation| Location | Cluster | P-value |
|---|---|---|
| chr3:183852780-183852930 | 1324 | 0.019 |
| chr3:183706040-183706190 | 1539 | 0.016 |
| chr3:183736060-183736210 | 814 | 0.013 |
| chr3:183853505-183853655 | 1007 | 0.01 |
| chr3:183735280-183735430 | 230 | 0.005 |
| chr3:183851900-183852050 | 243 | 0.005 |
| chr3:183853320-183853470 | 2172 | 0.005 |
| chr3:183853080-183853230 | 149 | 0.004 |
| chr3:183735760-183735910 | 148 | 0 |
External Databases
UCSCEnsembl (ENSG00000186090)