Gene: TMEM63A
chr1: 226033236-226070069Expression Profile
(log scale)
Graphical Connections
Distribution of linked clusters:
You may find it interesting if many of the connected DHS sites belong to the same cluster.| Cluster Profile | Cluster ID | Number of DHS sites in this cluster |
|---|---|---|
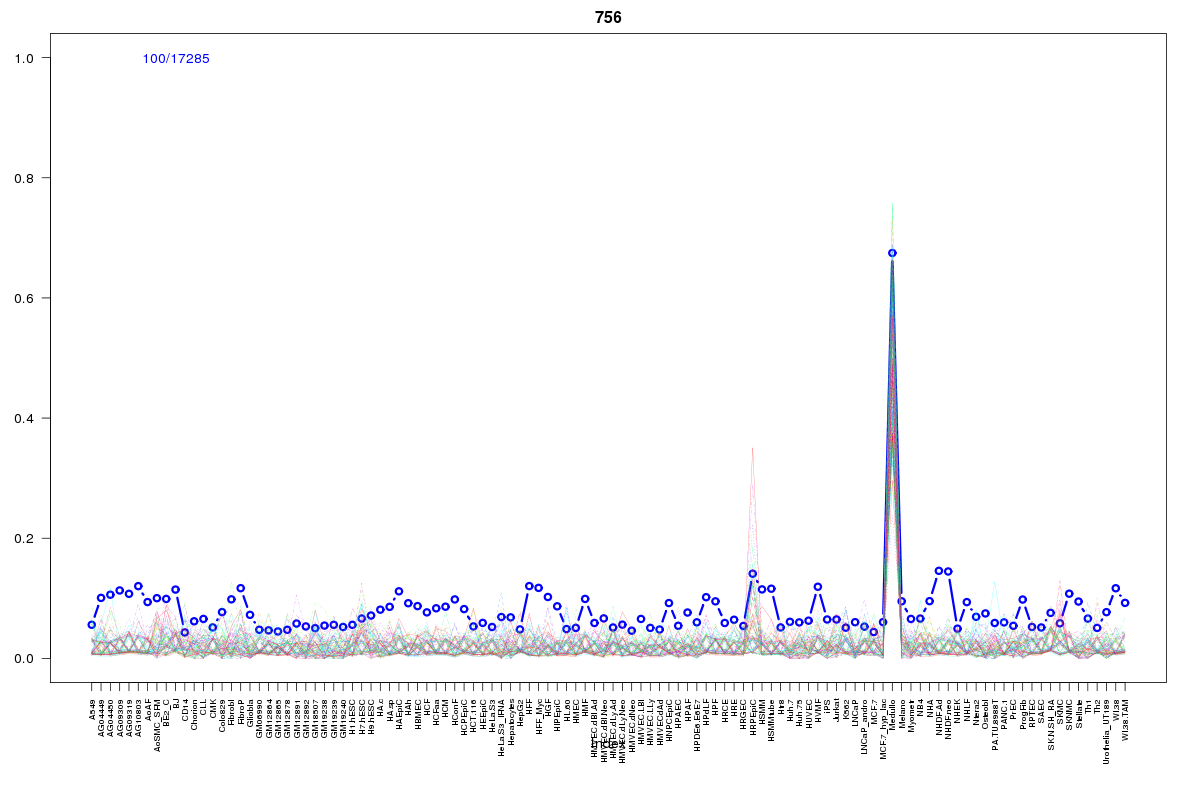 | 756 | 6 |
 | 416 | 2 |
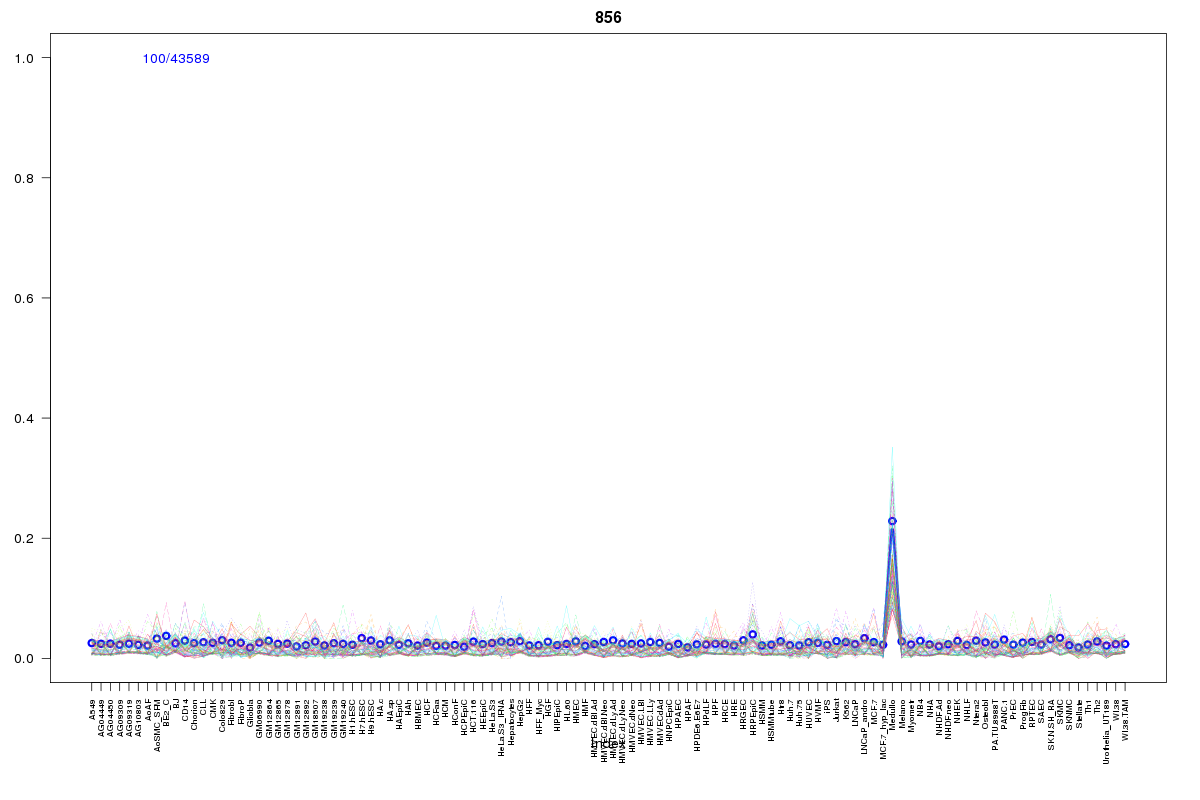 | 856 | 2 |
 | 1755 | 2 |
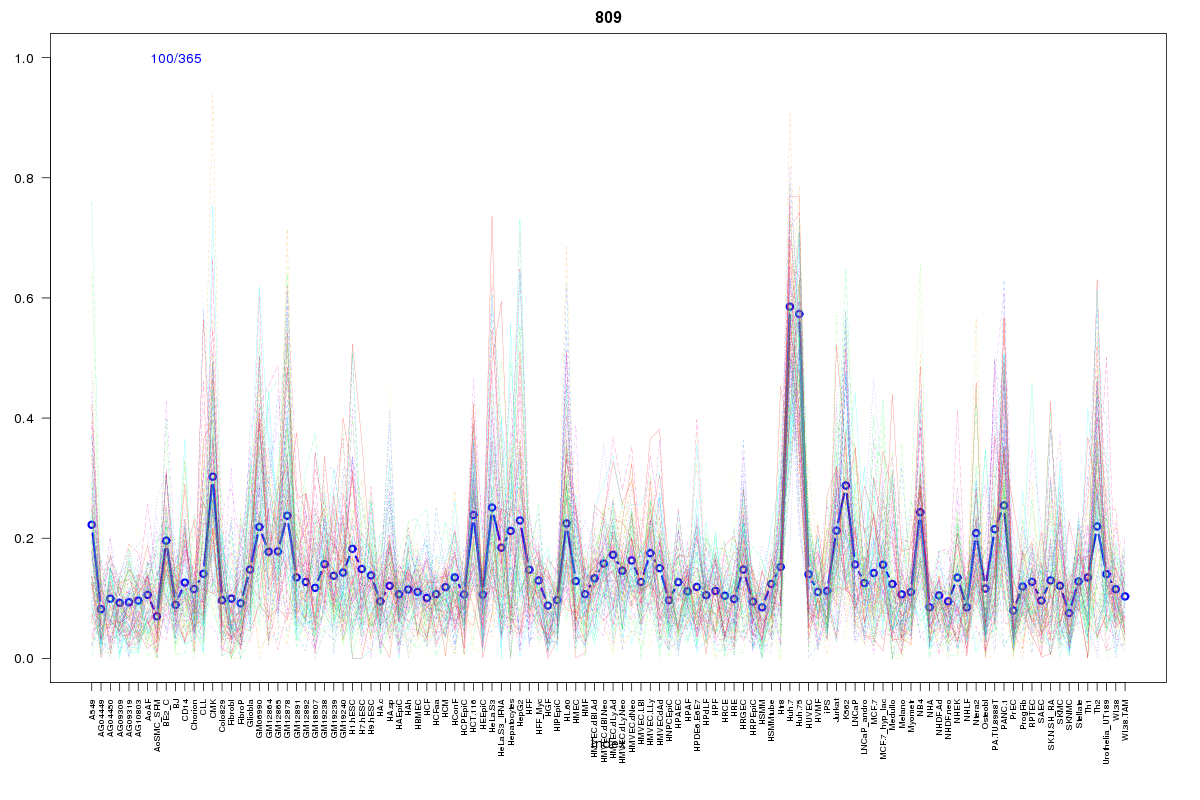 | 809 | 1 |
 | 1056 | 1 |
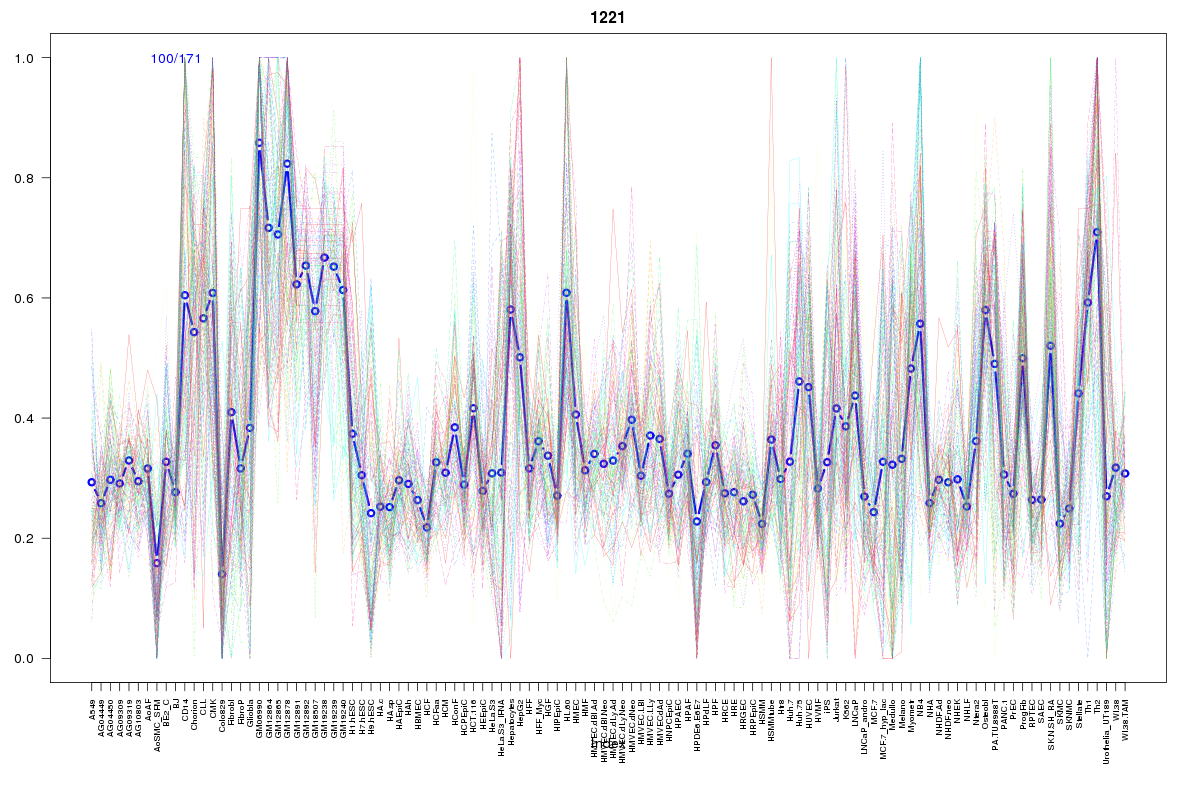 | 1221 | 1 |
 | 927 | 1 |
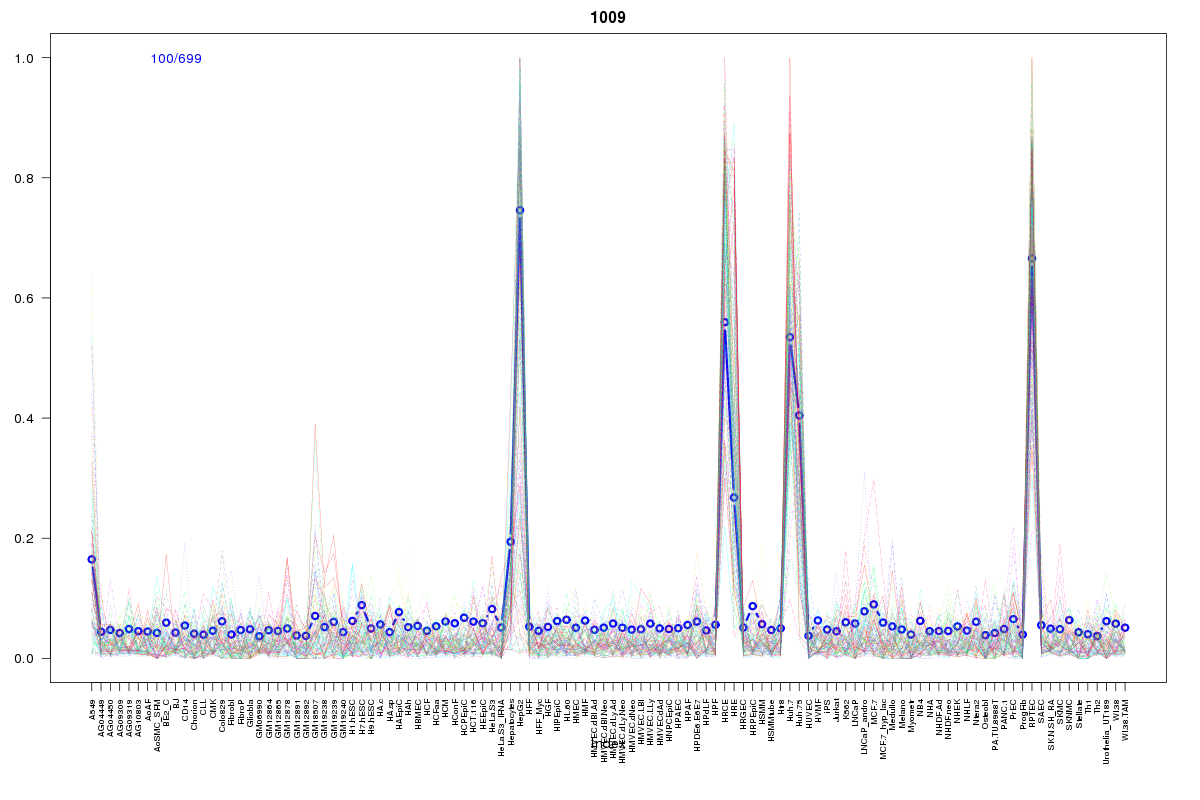 | 1009 | 1 |
 | 2122 | 1 |
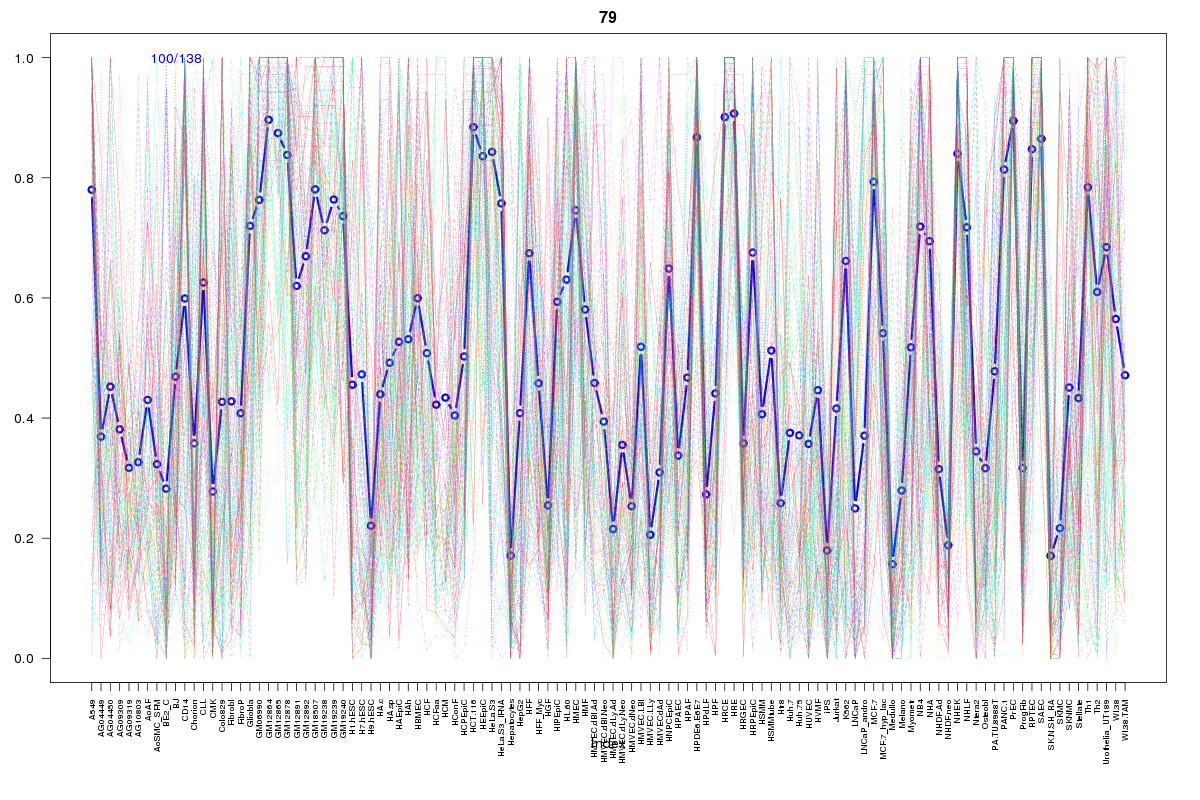 | 79 | 1 |
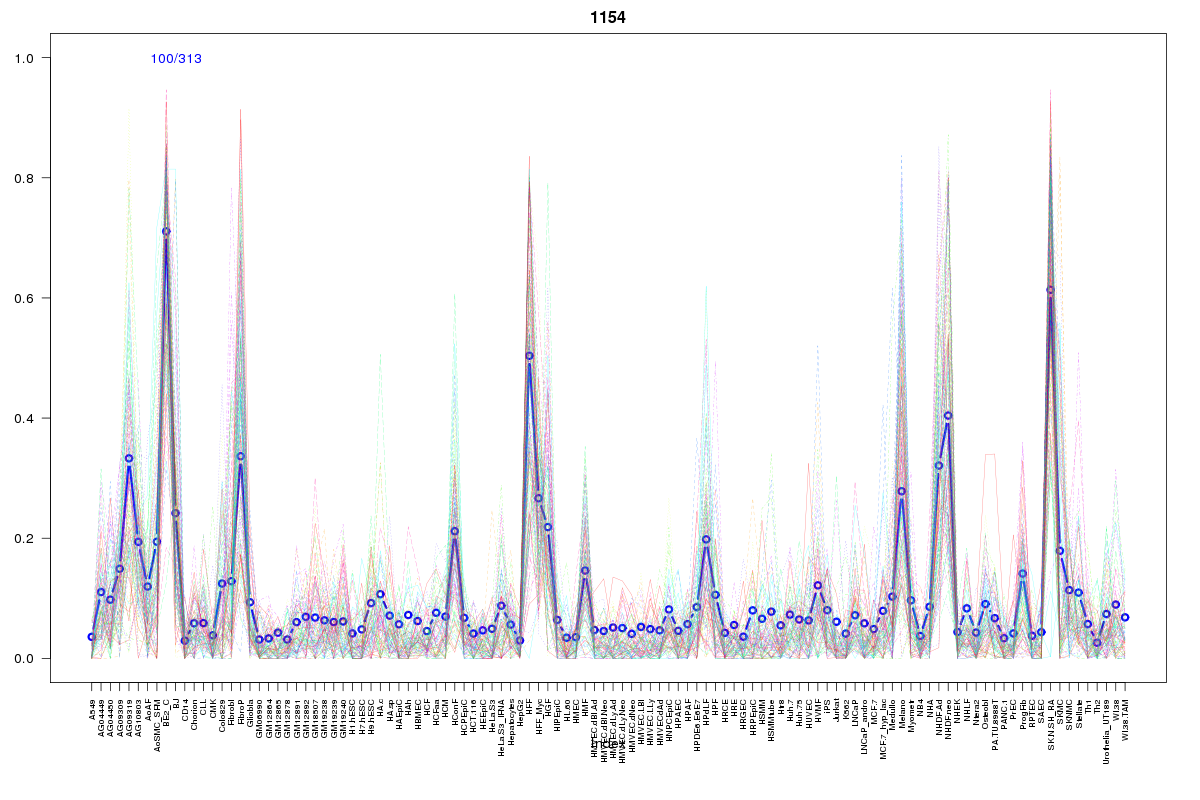 | 1154 | 1 |
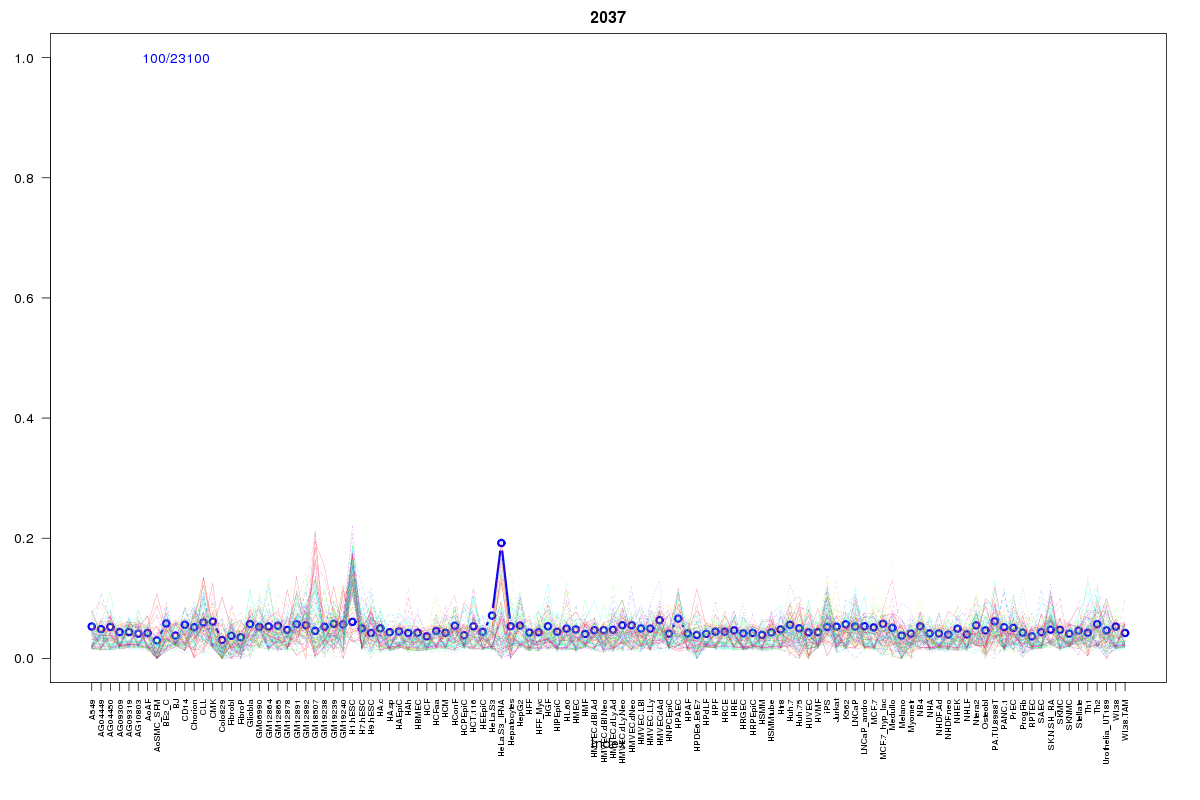 | 2037 | 1 |
 | 430 | 1 |
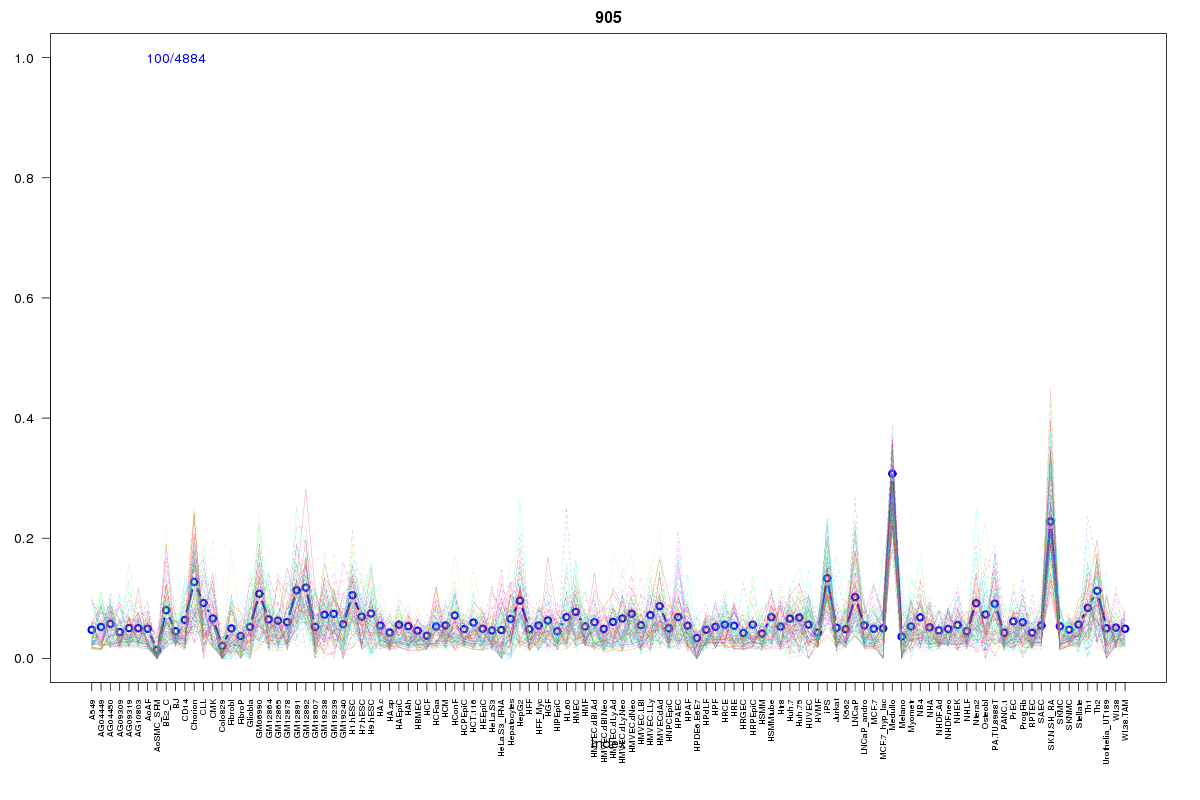 | 905 | 1 |
 | 966 | 1 |
 | 1078 | 1 |
 | 1970 | 1 |
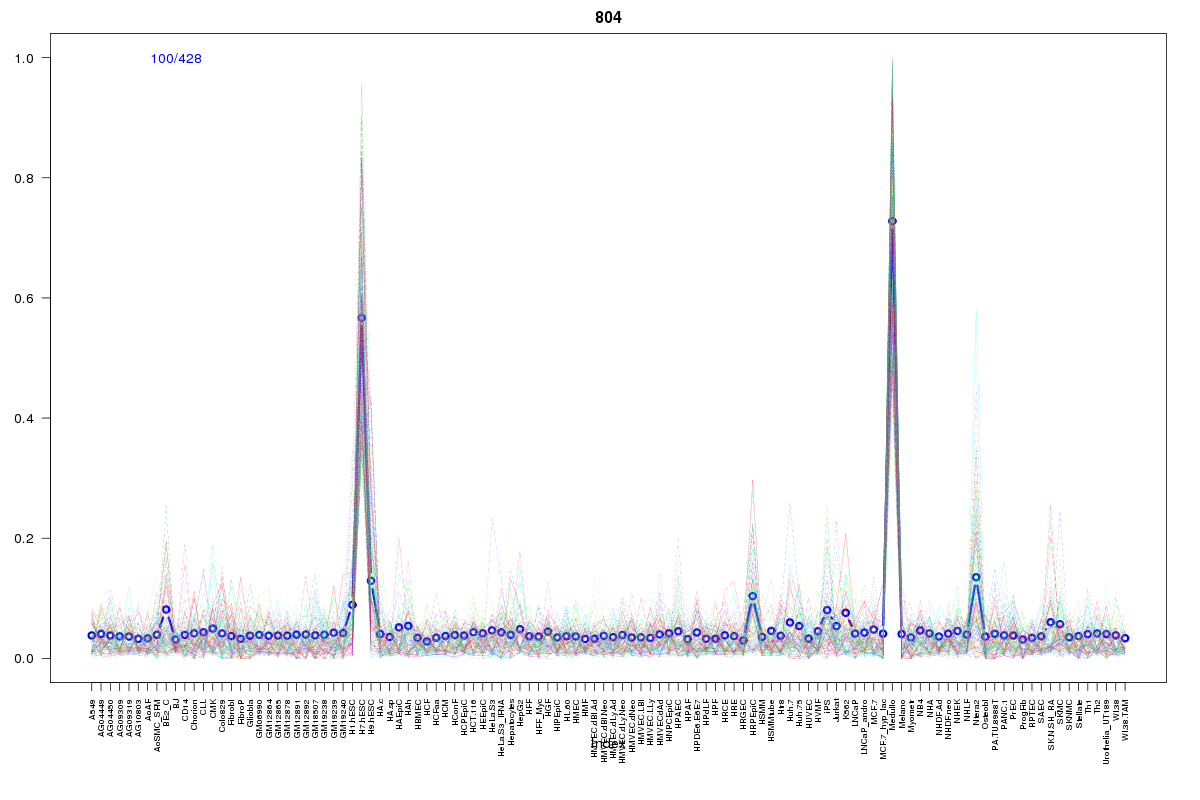 | 804 | 1 |
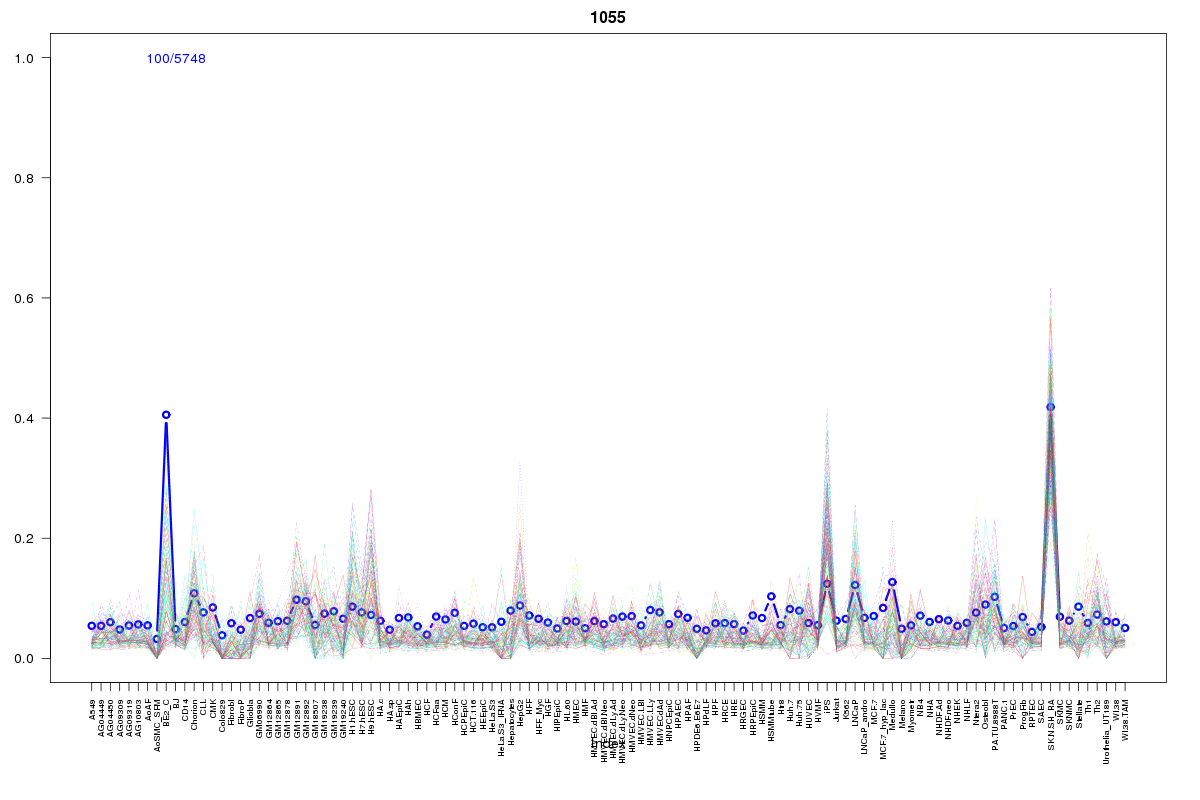 | 1055 | 1 |
 | 862 | 1 |
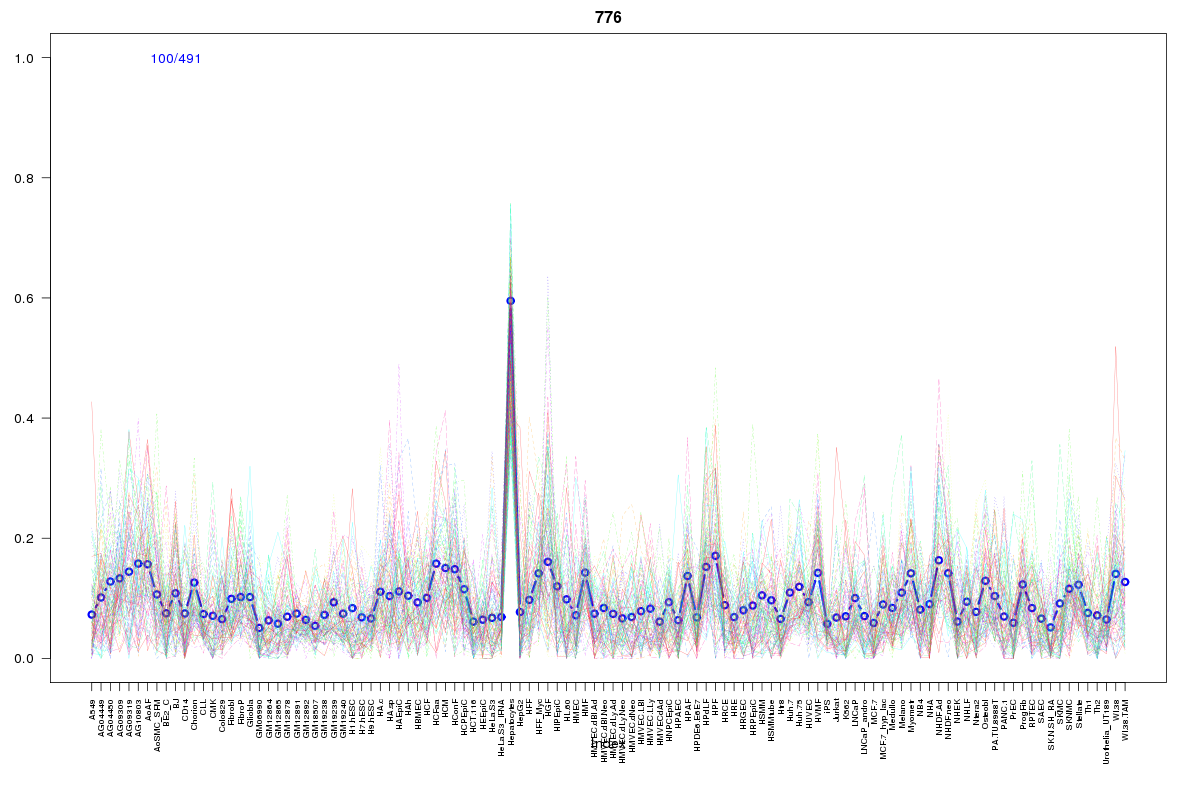 | 776 | 1 |
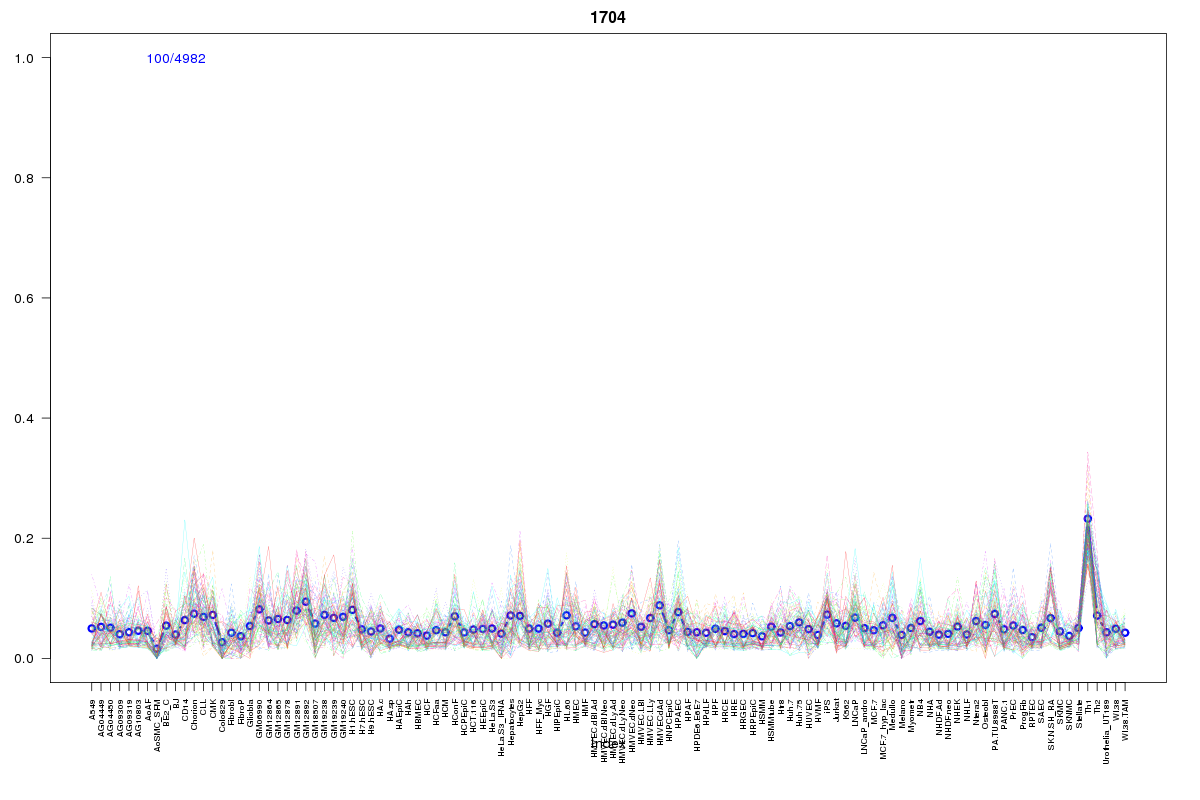 | 1704 | 1 |
 | 2063 | 1 |
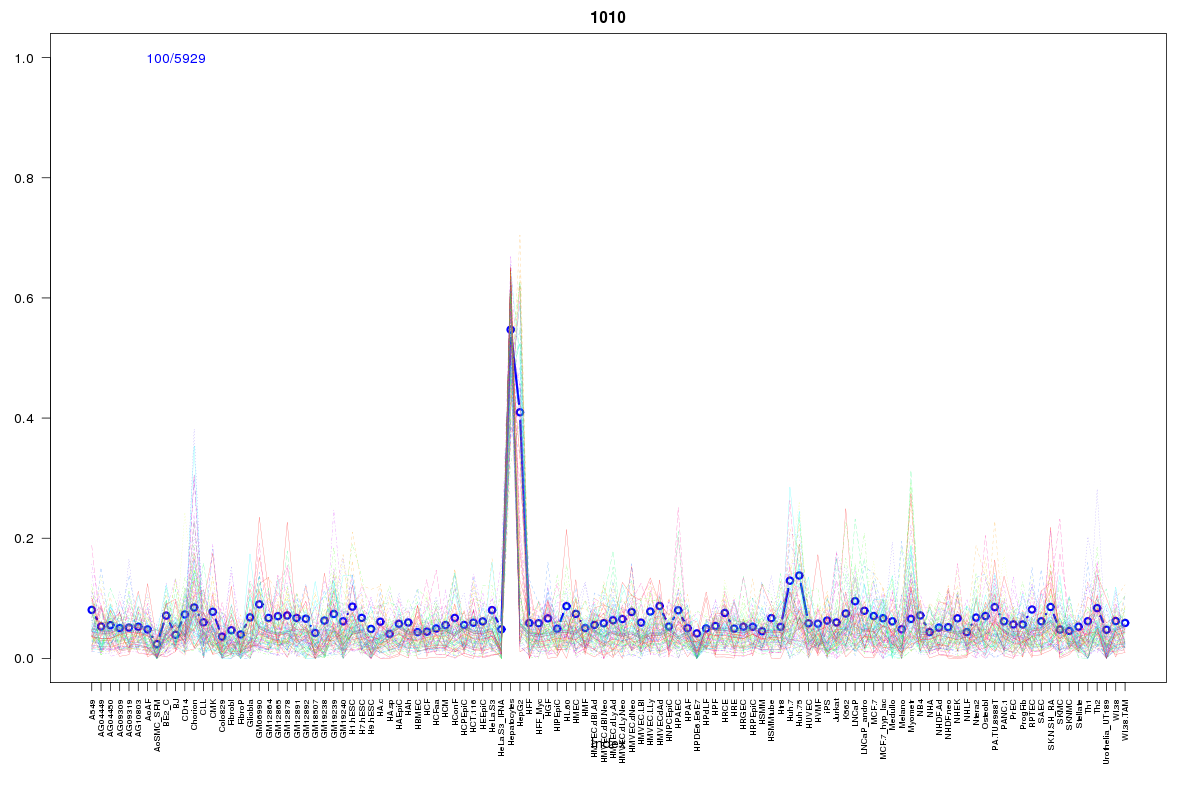 | 1010 | 1 |
Resources
BED file downloads
Connects to 33 DHS sitesTop 10 Correlated DHS Sites
p-values indiciate significant higher or lower correlation| Location | Cluster | P-value |
|---|---|---|
| chr1:226069260-226069410 | 1056 | 0 |
| chr1:226067640-226067790 | 2063 | 0.001 |
| chr1:226010865-226011015 | 1755 | 0.002 |
| chr1:226079000-226079150 | 1009 | 0.01 |
| chr1:226004225-226004375 | 1755 | 0.012 |
| chr1:226012905-226013055 | 966 | 0.012 |
| chr1:226026305-226026455 | 1970 | 0.016 |
| chr1:226066660-226066810 | 776 | 0.016 |
| chr1:226068345-226068495 | 1010 | 0.016 |
| chr1:226069105-226069255 | 809 | 0.02 |
| chr1:226069420-226069570 | 1221 | 0.02 |
External Databases
UCSCEnsembl (ENSG00000196187)