Gene: ATAD3A
chr1: 1447530-1470065Expression Profile
(log scale)
Graphical Connections
Distribution of linked clusters:
You may find it interesting if many of the connected DHS sites belong to the same cluster.| Cluster Profile | Cluster ID | Number of DHS sites in this cluster |
|---|---|---|
 | 626 | 2 |
 | 570 | 2 |
 | 1605 | 1 |
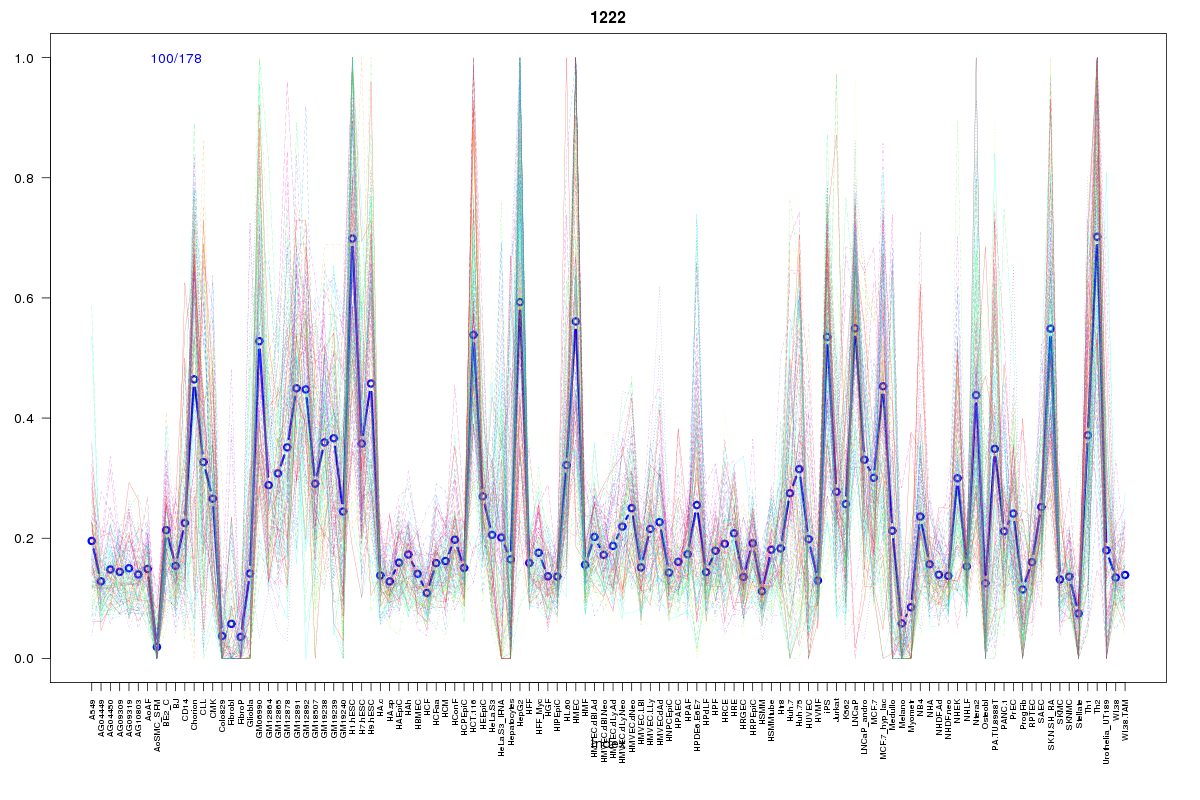 | 1222 | 1 |
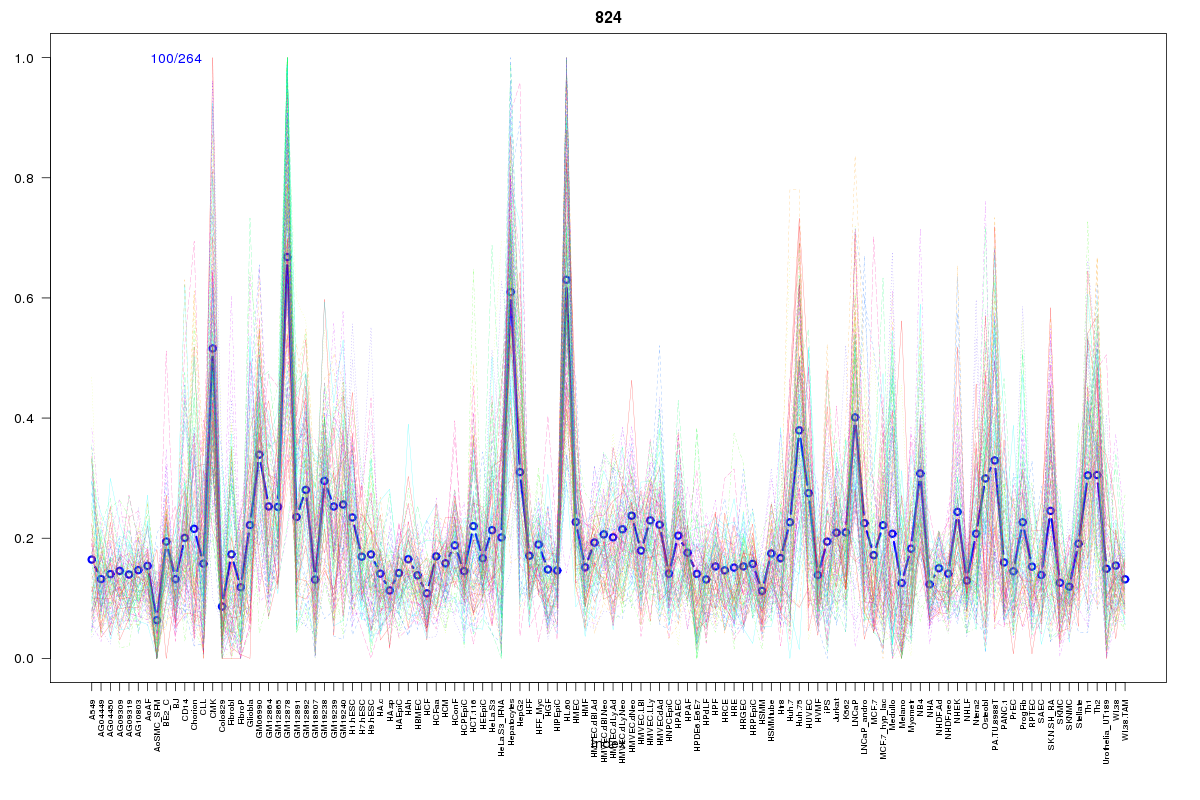 | 824 | 1 |
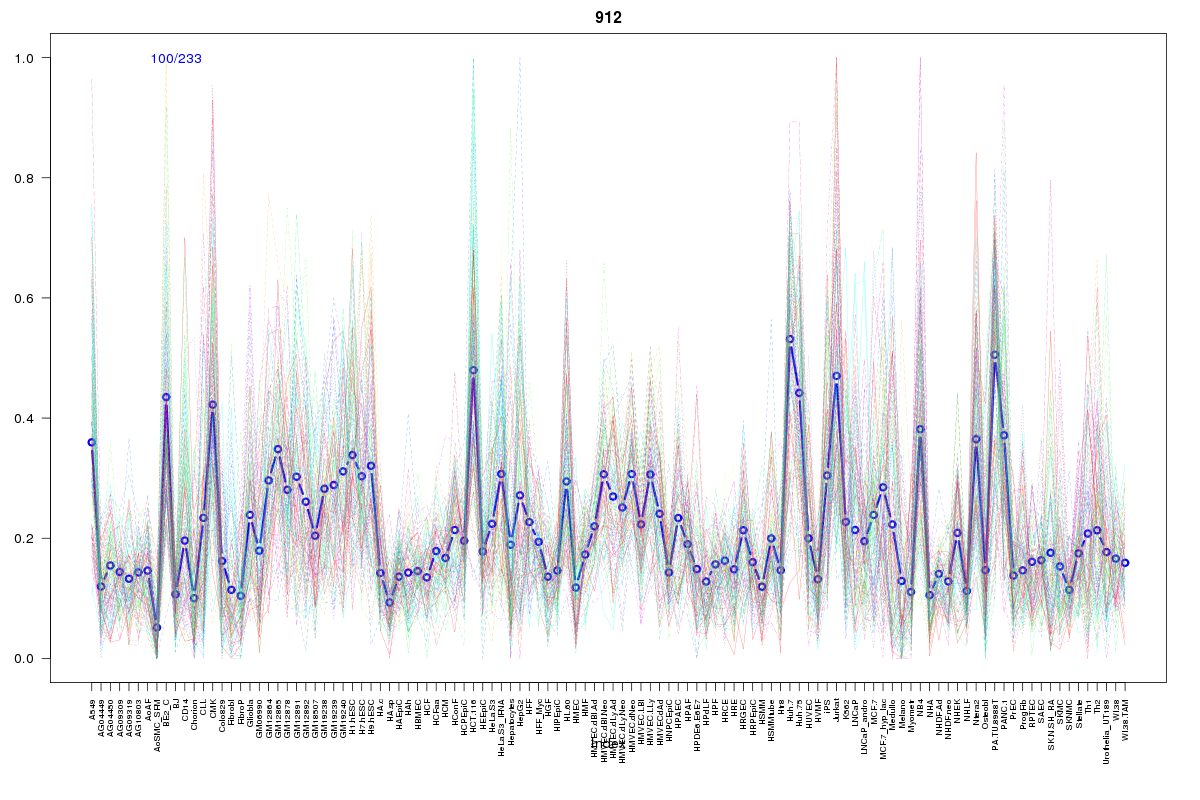 | 912 | 1 |
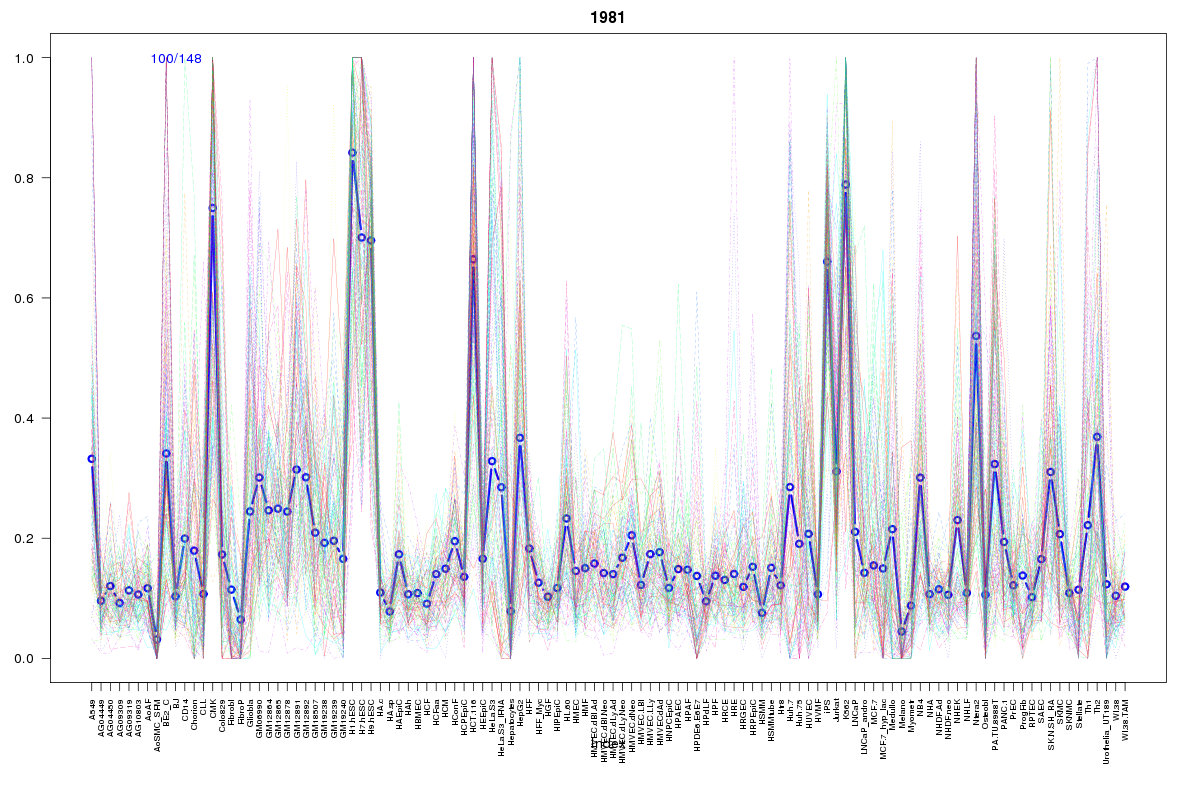 | 1981 | 1 |
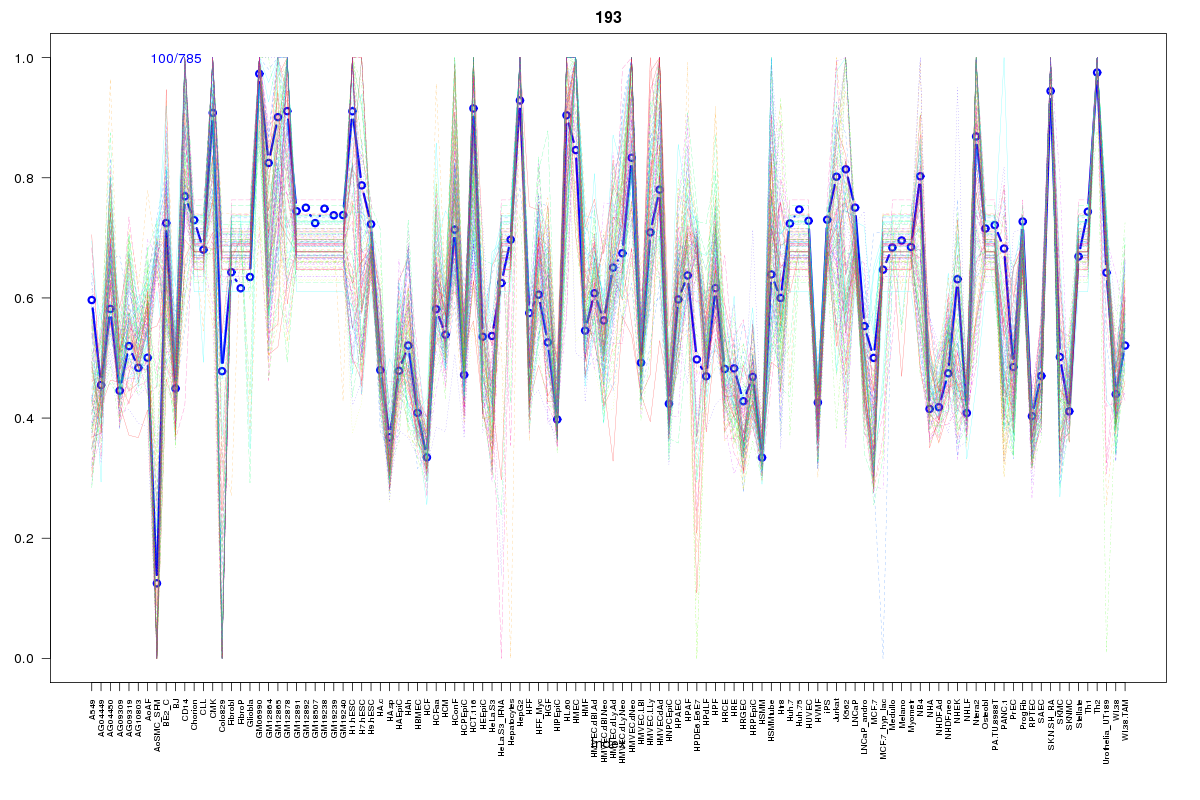 | 193 | 1 |
 | 2017 | 1 |
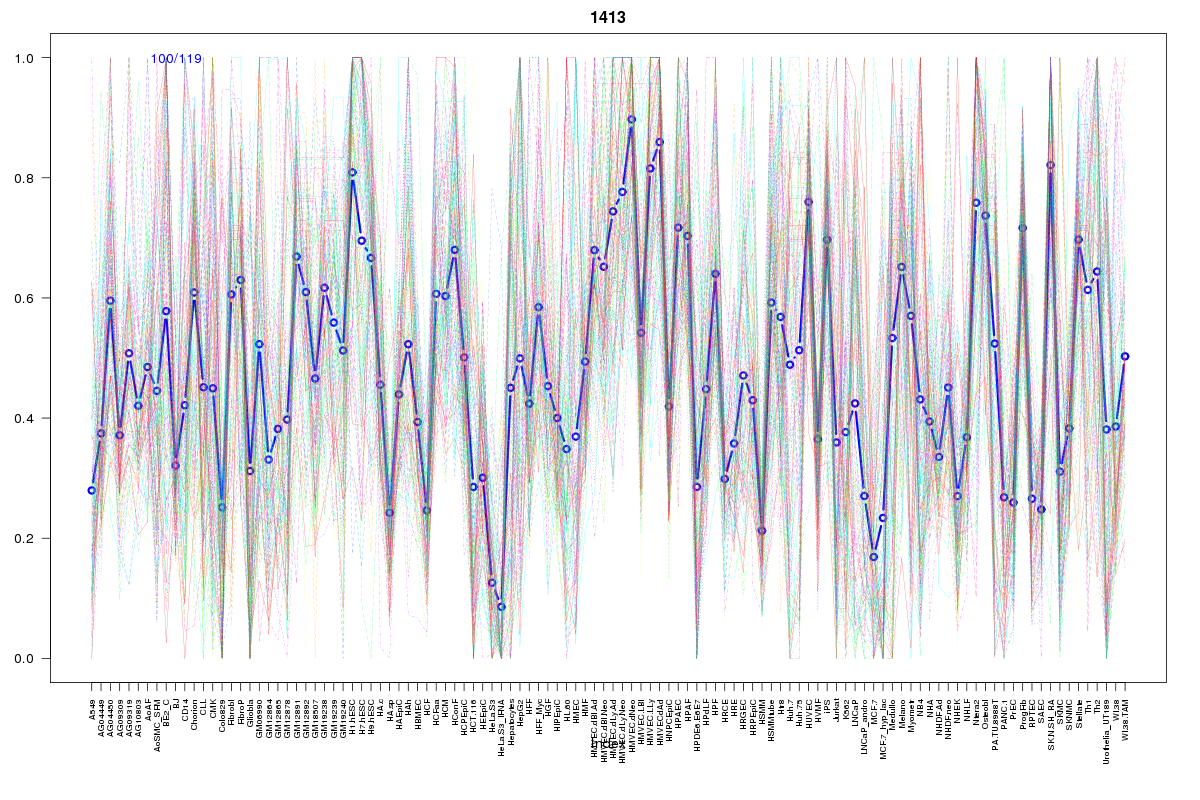 | 1413 | 1 |
 | 568 | 1 |
 | 569 | 1 |
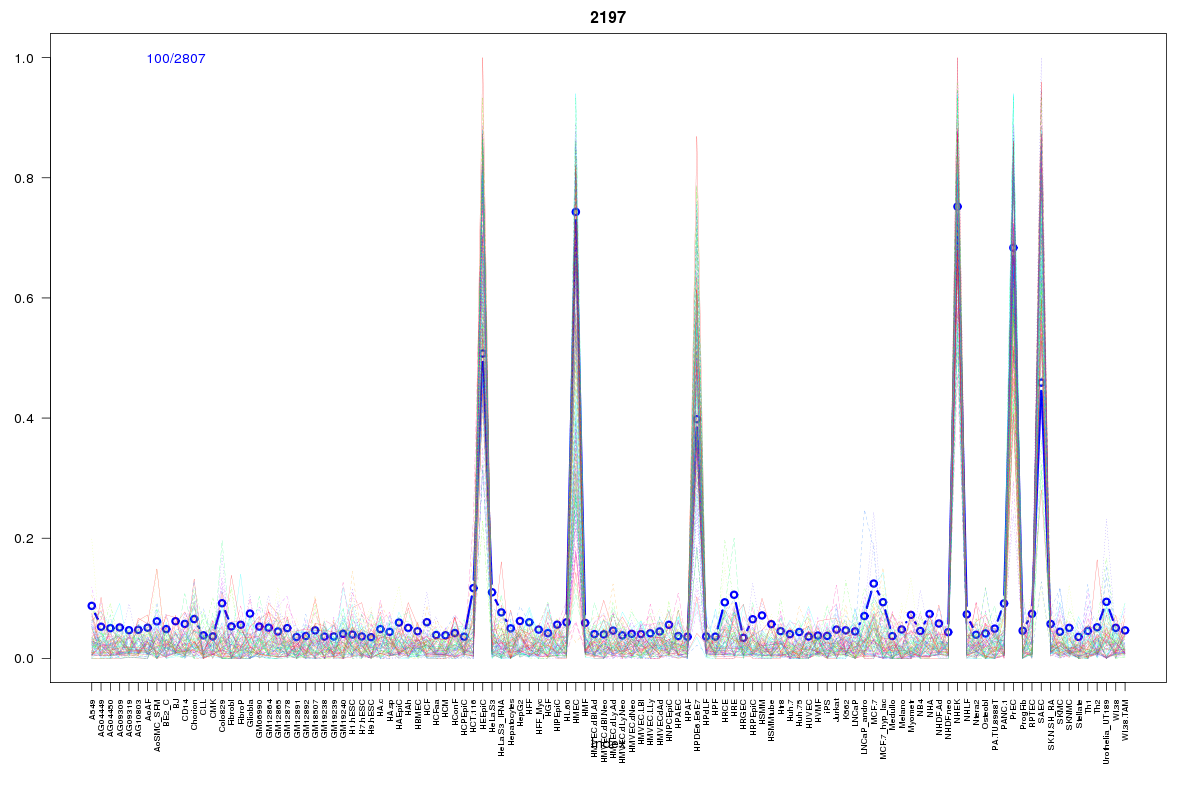 | 2197 | 1 |
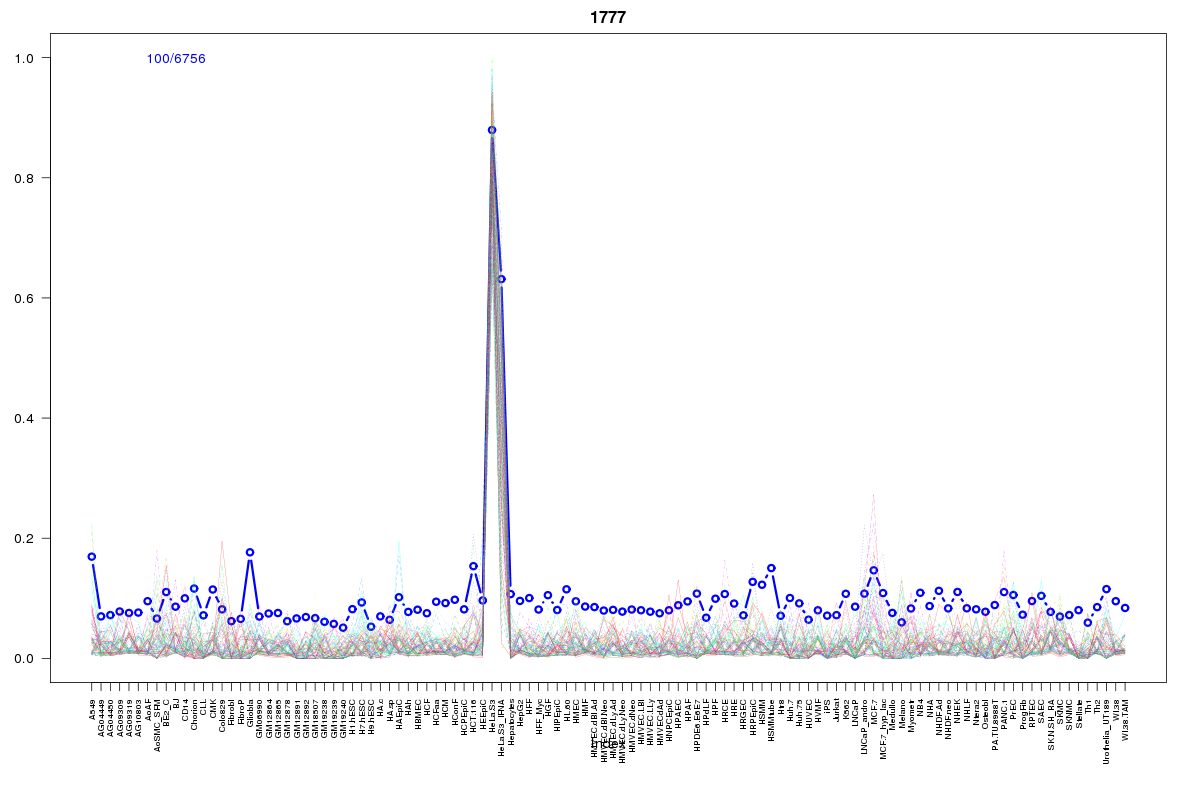 | 1777 | 1 |
 | 2279 | 1 |
 | 1355 | 1 |
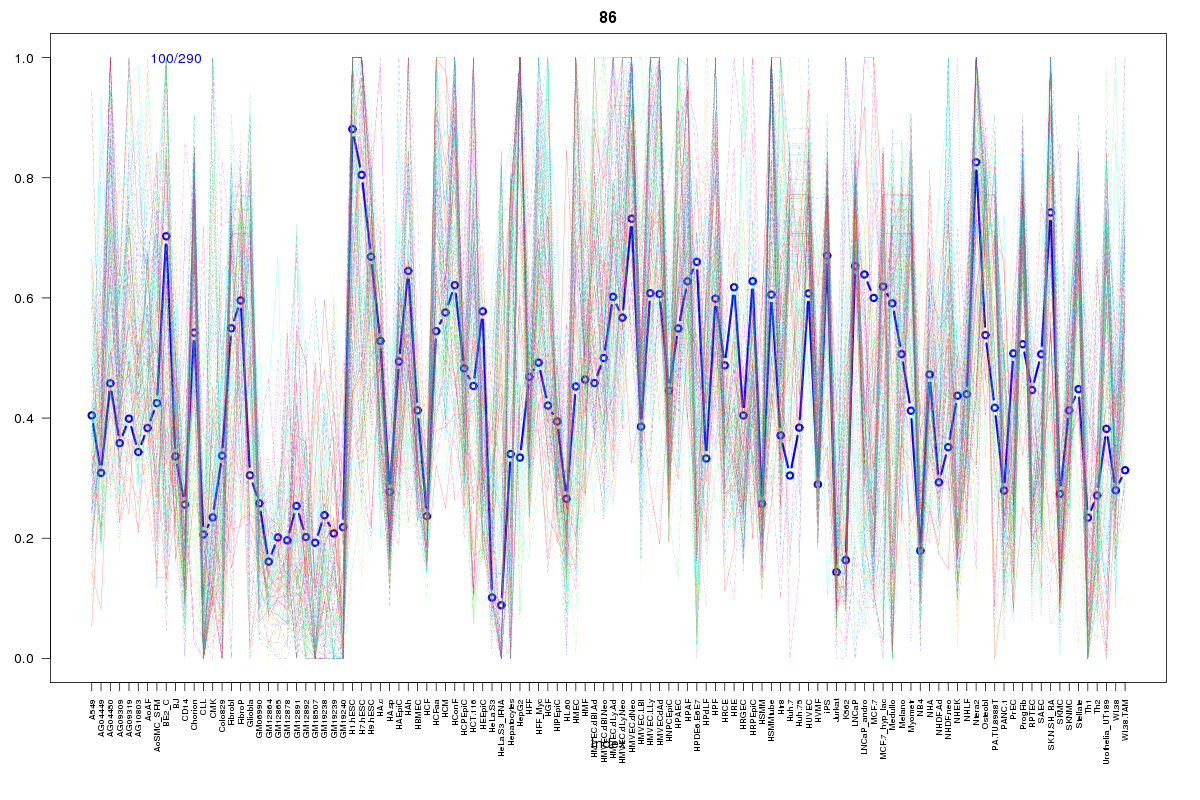 | 86 | 1 |
 | 2122 | 1 |
 | 1115 | 1 |
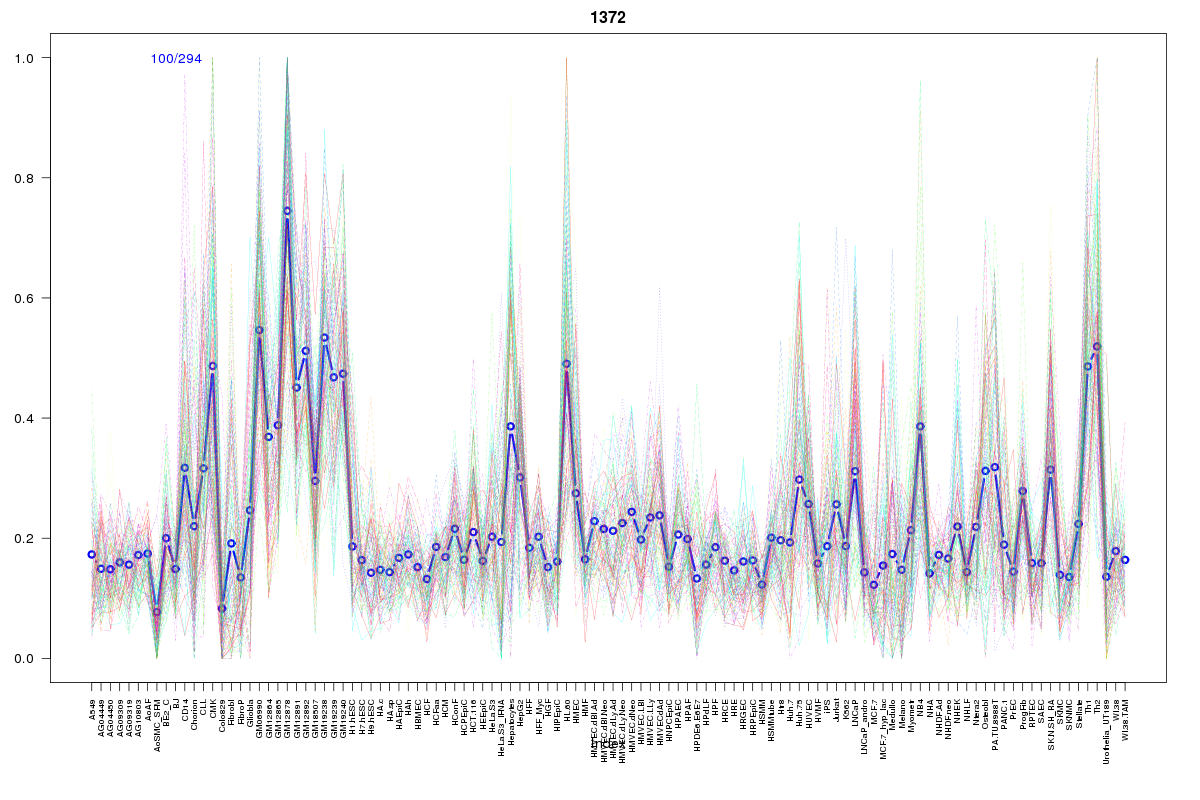 | 1372 | 1 |
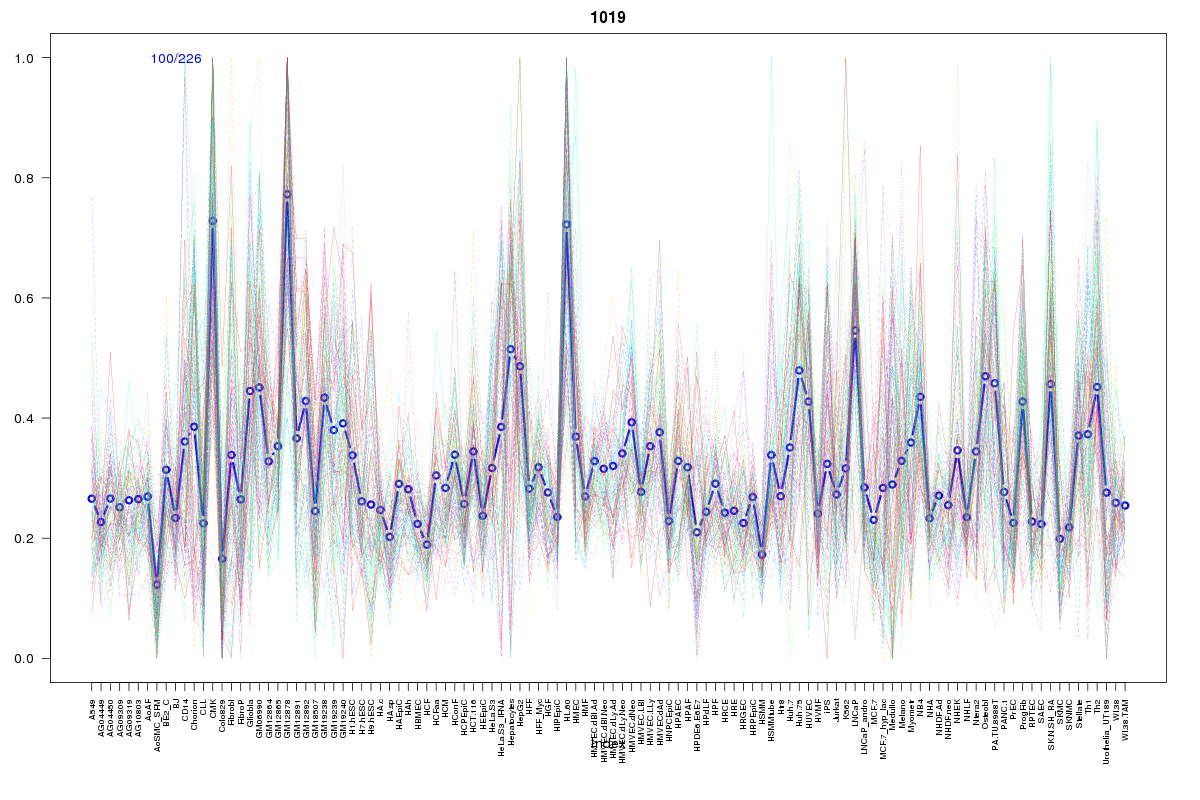 | 1019 | 1 |
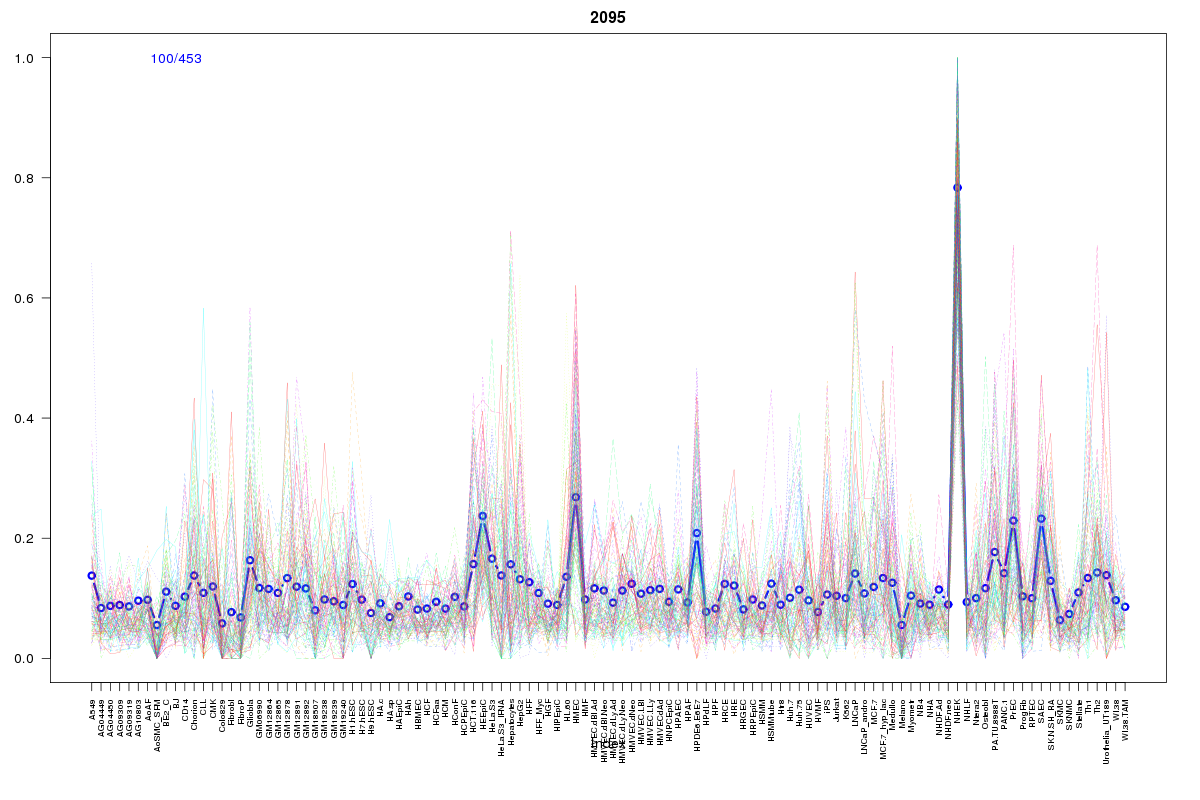 | 2095 | 1 |
Resources
BED file downloads
Connects to 24 DHS sitesTop 10 Correlated DHS Sites
p-values indiciate significant higher or lower correlation| Location | Cluster | P-value |
|---|---|---|
| chr1:1564245-1564395 | 1222 | 0.001 |
| chr1:1407965-1408115 | 824 | 0.001 |
| chr1:1511500-1511650 | 1777 | 0.001 |
| chr1:1532525-1532675 | 2122 | 0.001 |
| chr1:1563040-1563190 | 2095 | 0.001 |
| chr1:1508125-1508275 | 569 | 0.002 |
| chr1:1532700-1532850 | 1372 | 0.003 |
| chr1:1441040-1441190 | 912 | 0.004 |
| chr1:1467460-1467610 | 2017 | 0.005 |
| chr1:1373520-1373670 | 1019 | 0.006 |
| chr1:1446460-1446610 | 1981 | 0.015 |
External Databases
UCSCEnsembl (ENSG00000197785)