Gene: RNA5SP307
chr10: 26798517-26798633Expression Profile
(log scale)
Graphical Connections
Distribution of linked clusters:
You may find it interesting if many of the connected DHS sites belong to the same cluster.| Cluster Profile | Cluster ID | Number of DHS sites in this cluster |
|---|---|---|
 | 73 | 2 |
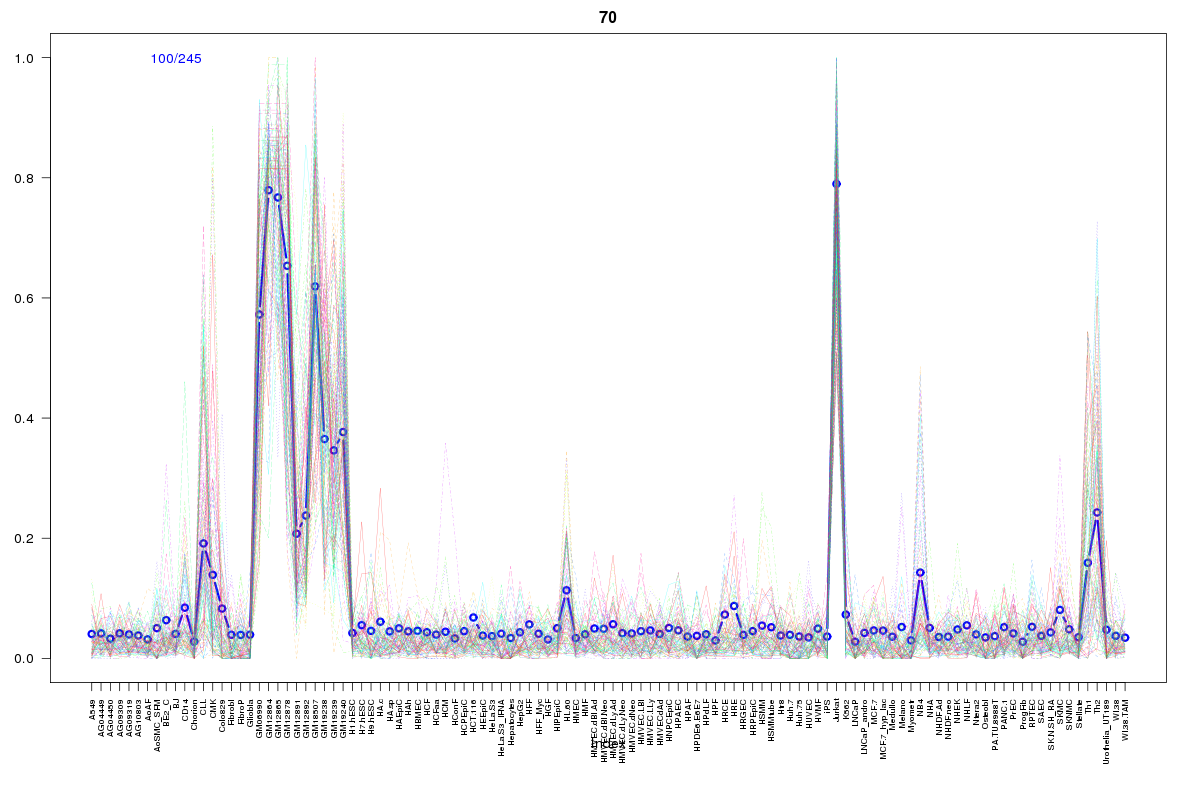 | 70 | 1 |
 | 2211 | 1 |
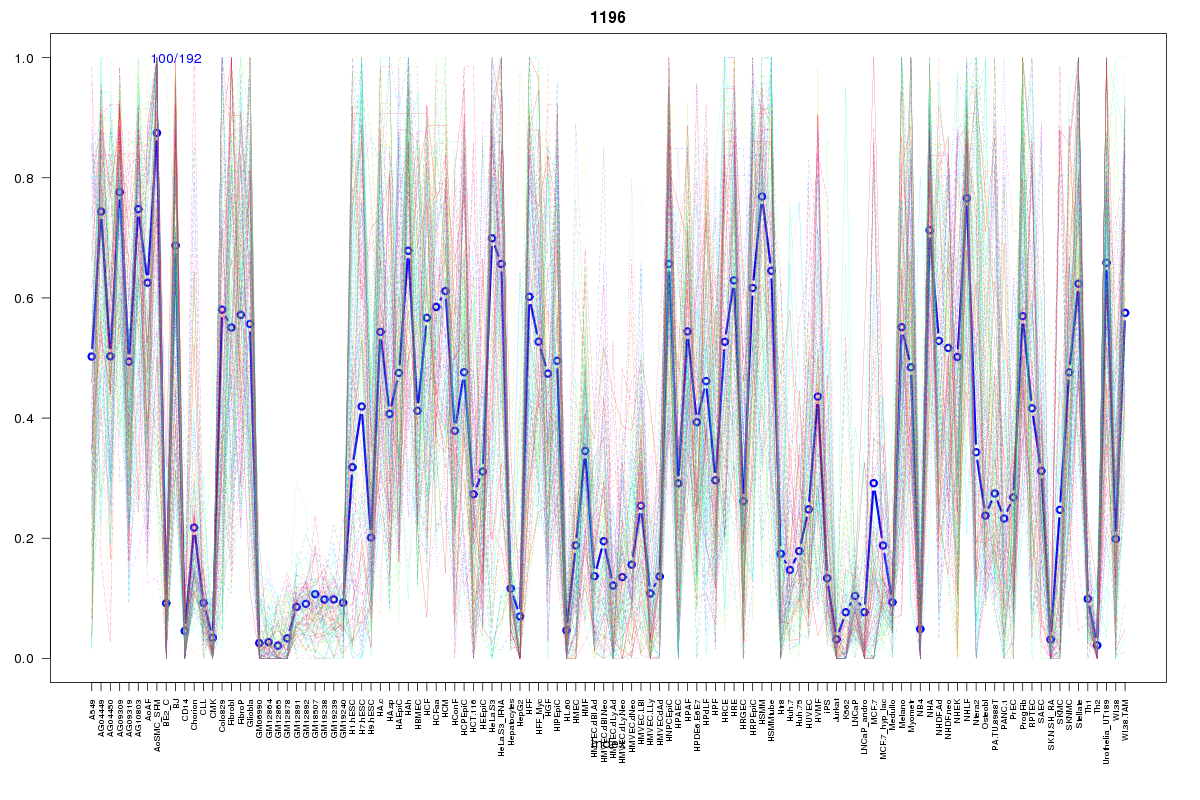 | 1196 | 1 |
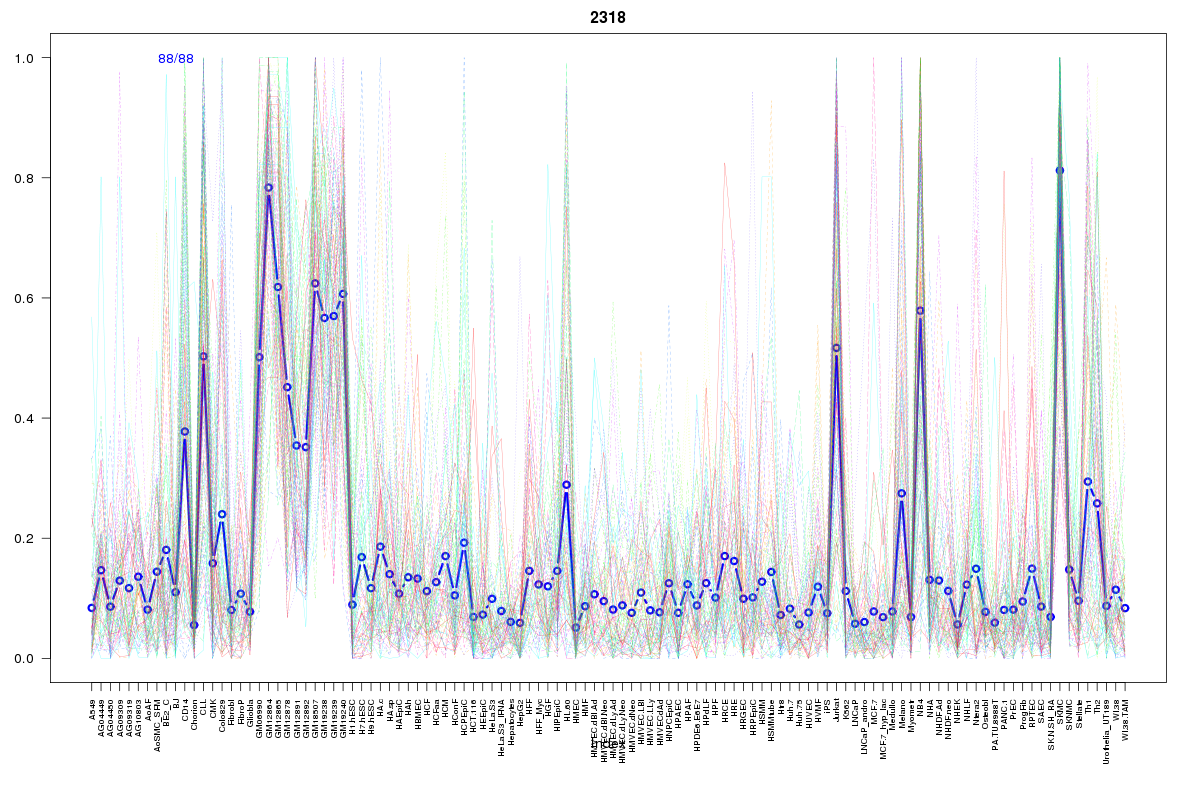 | 2318 | 1 |
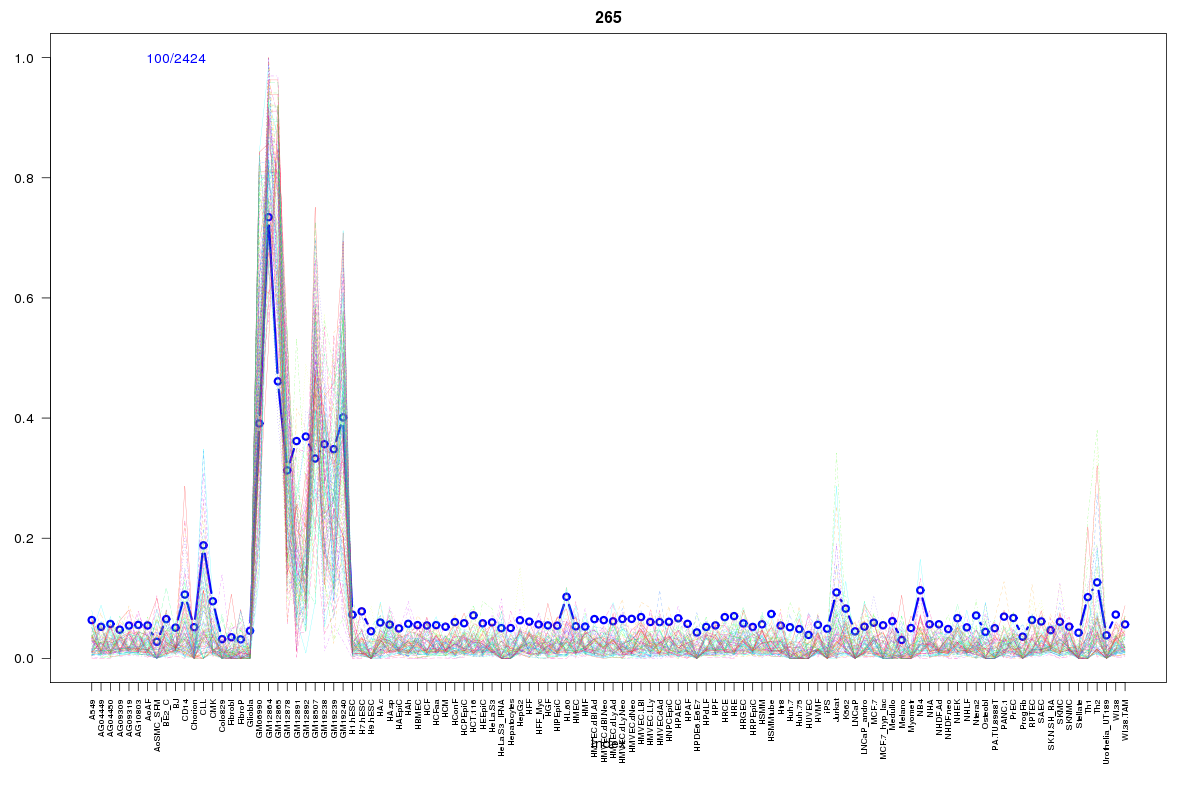 | 265 | 1 |
 | 2406 | 1 |
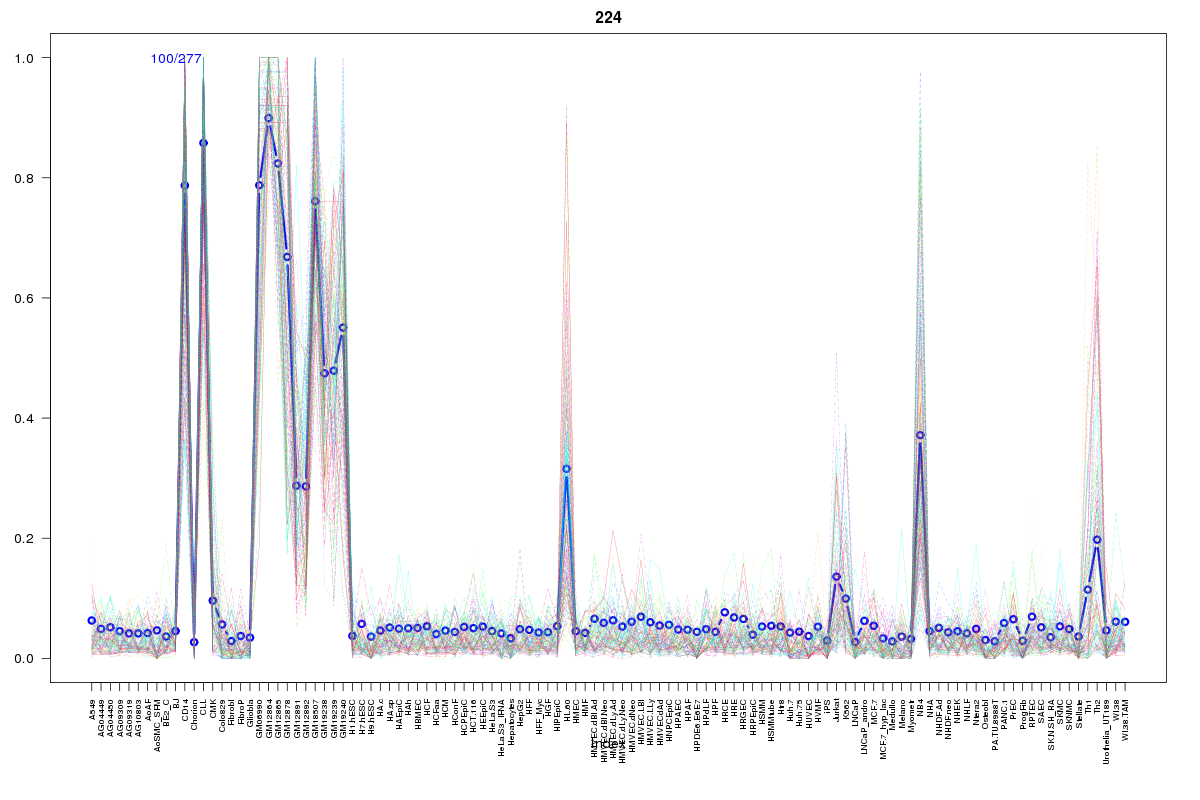 | 224 | 1 |
 | 860 | 1 |
 | 15 | 1 |
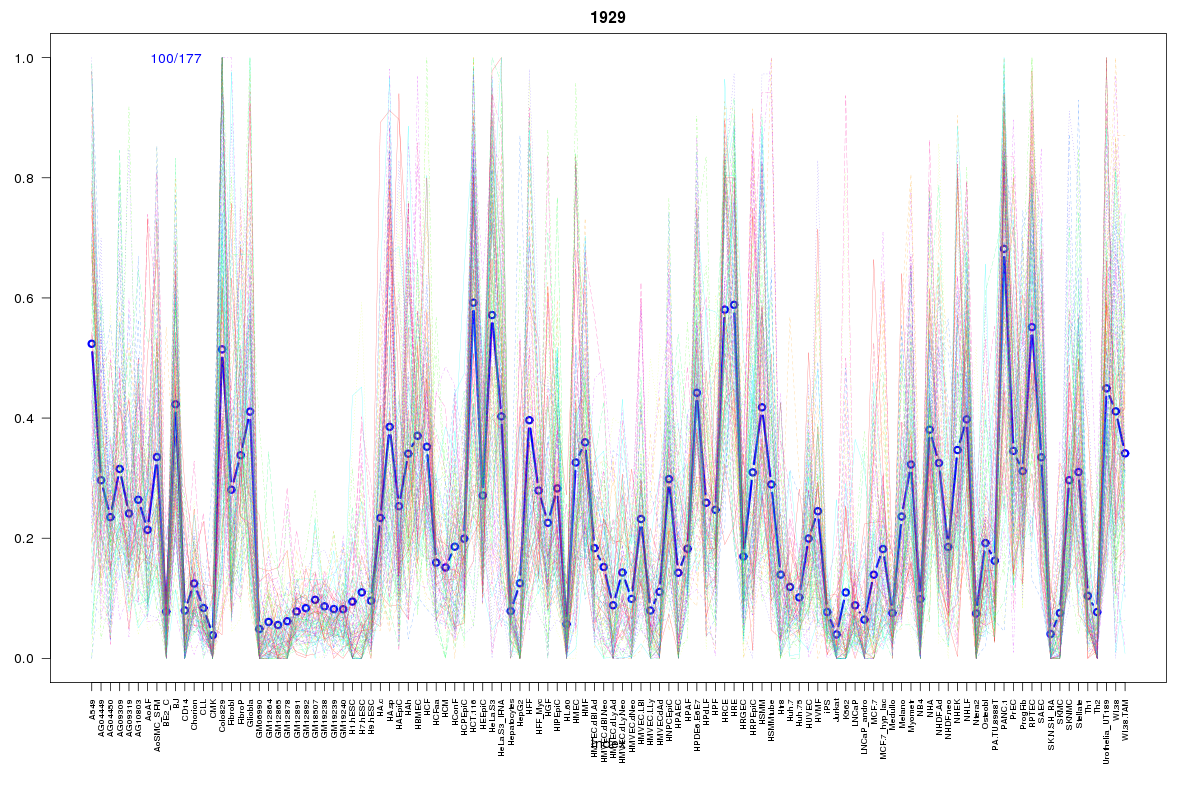 | 1929 | 1 |
 | 220 | 1 |
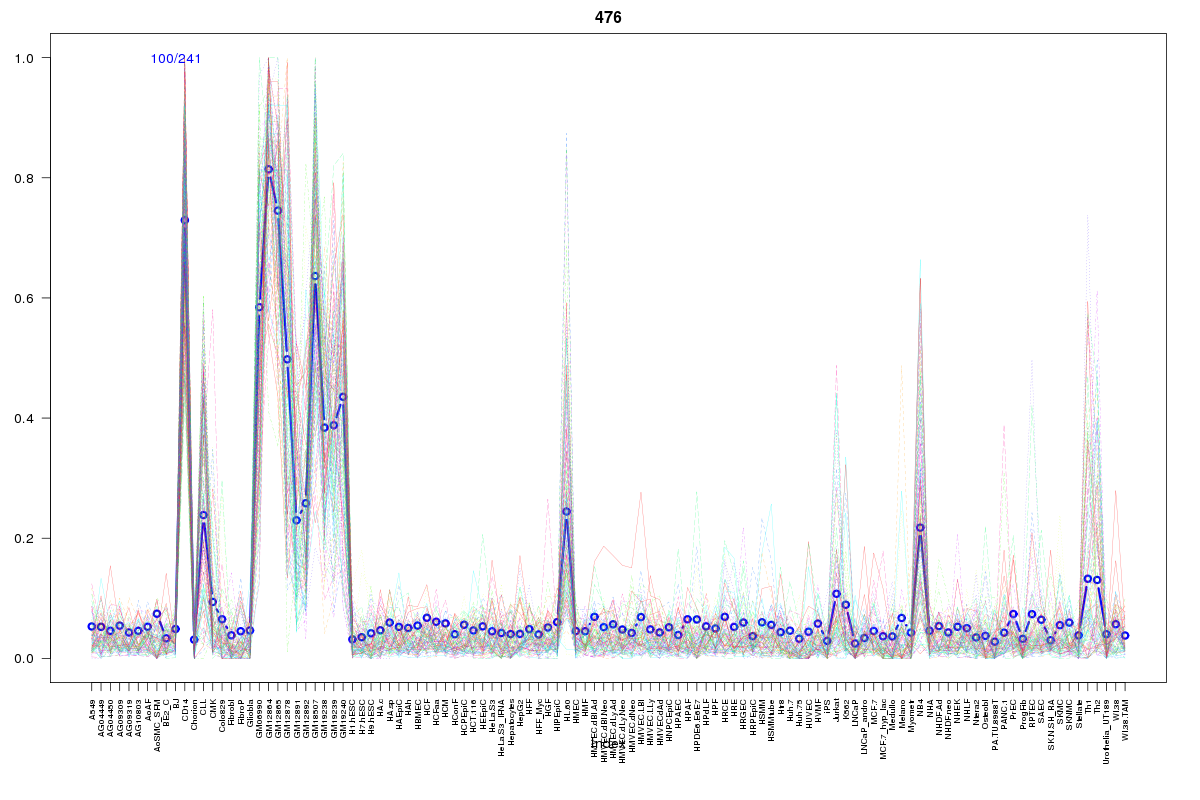 | 476 | 1 |
 | 2062 | 1 |
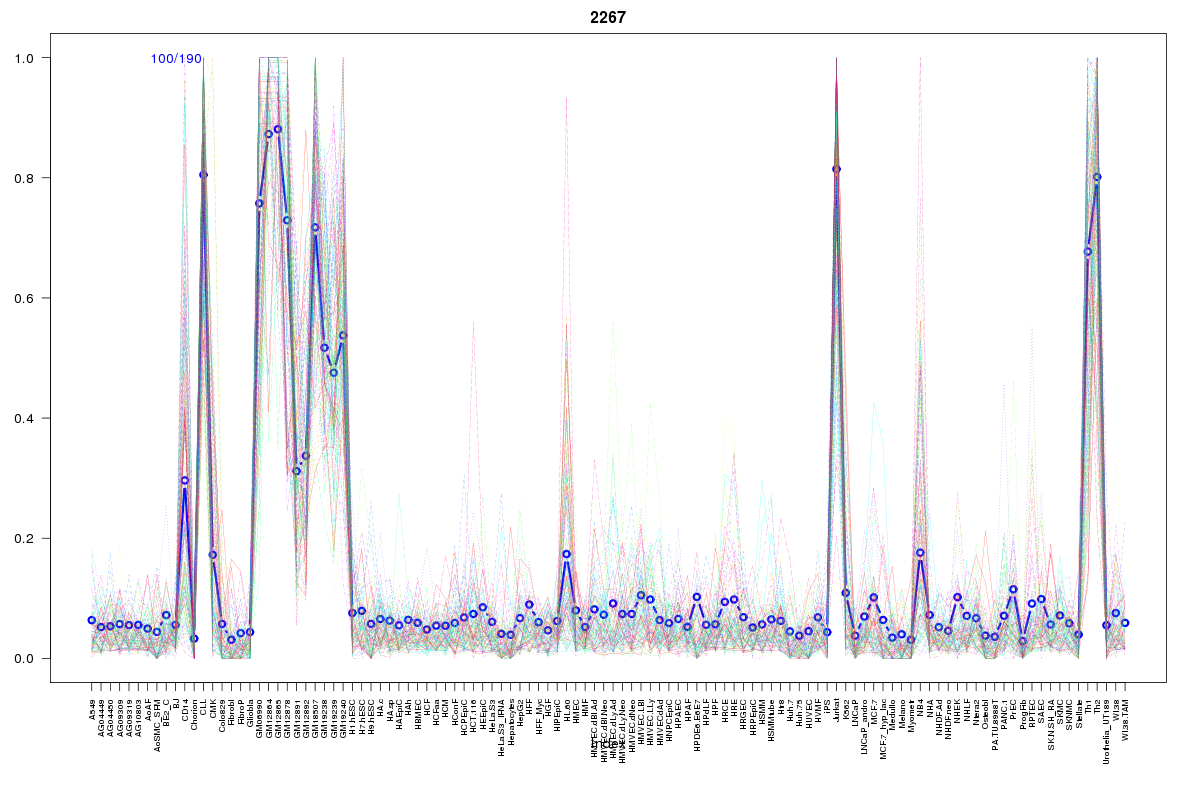 | 2267 | 1 |
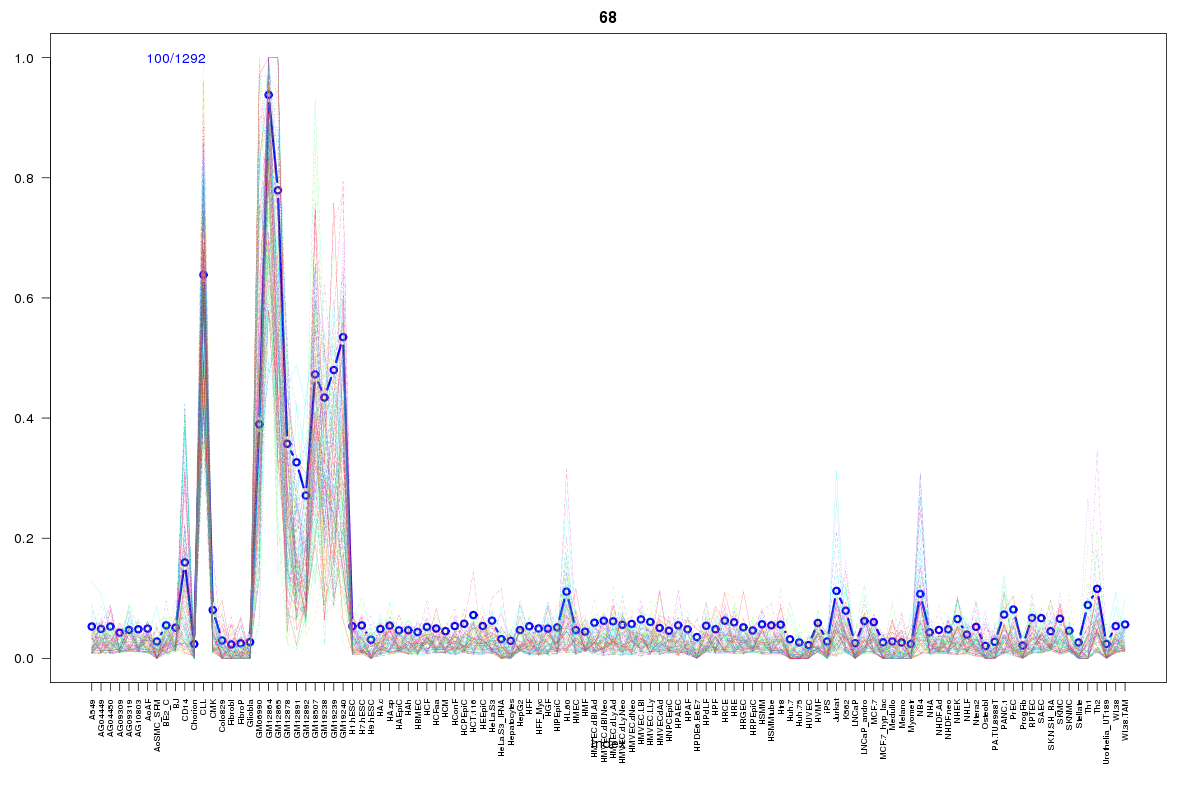 | 68 | 1 |
Resources
BED file downloads
Connects to 17 DHS sitesTop 10 Correlated DHS Sites
p-values indiciate significant higher or lower correlation| Location | Cluster | P-value |
|---|---|---|
| chr10:26874980-26875130 | 860 | 0 |
| chr10:26758280-26758430 | 2211 | 0.007 |
| chr10:26719960-26720110 | 73 | 0.008 |
| chr10:26757840-26757990 | 70 | 0.01 |
| chr10:26737740-26737890 | 2267 | 0.011 |
| chr10:26727540-26727690 | 73 | 0.016 |
| chr10:26719780-26719930 | 476 | 0.016 |
| chr10:26863860-26864010 | 224 | 0.019 |
| chr10:26832940-26833090 | 265 | 0.02 |
| chr10:26829660-26829810 | 2318 | 0.02 |
| chr10:26719540-26719690 | 220 | 0.023 |
External Databases
UCSCEnsembl (ENSG00000199733)