Gene: Y_RNA
chr9: 19089590-19089686Expression Profile
(log scale)
Graphical Connections
Distribution of linked clusters:
You may find it interesting if many of the connected DHS sites belong to the same cluster.| Cluster Profile | Cluster ID | Number of DHS sites in this cluster |
|---|---|---|
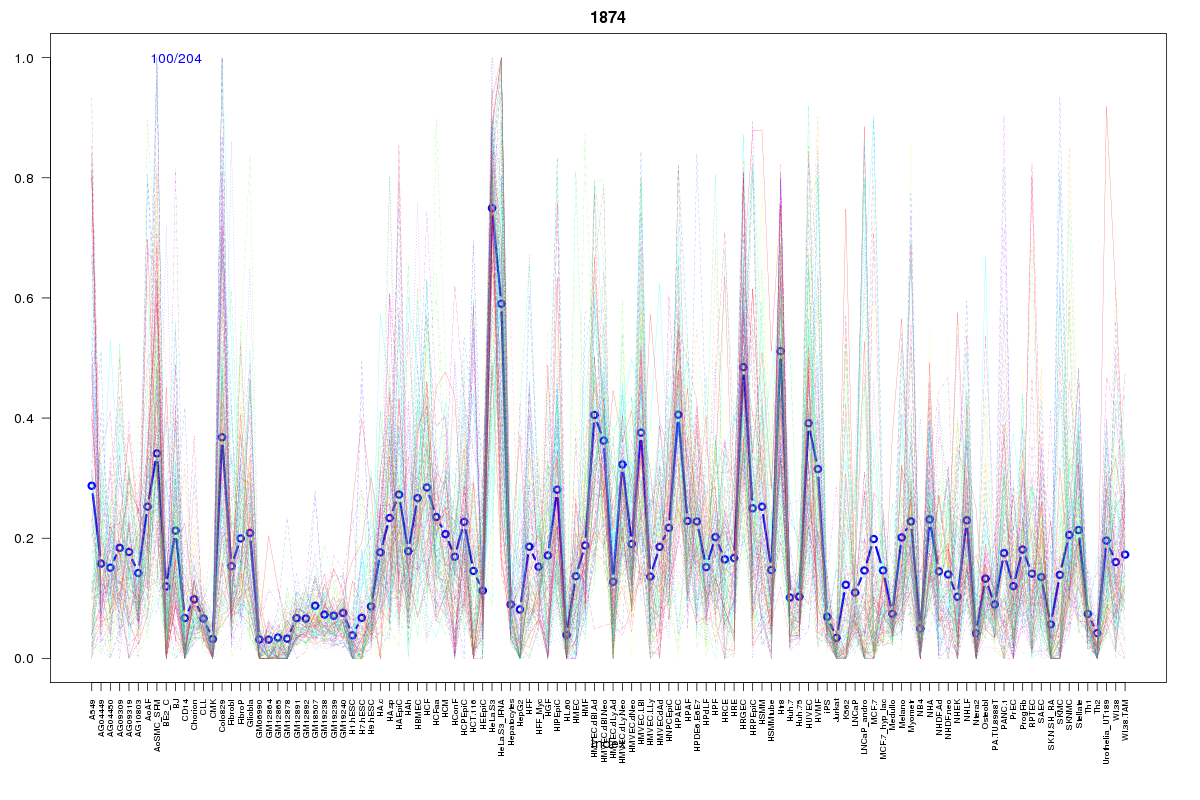 | 1874 | 1 |
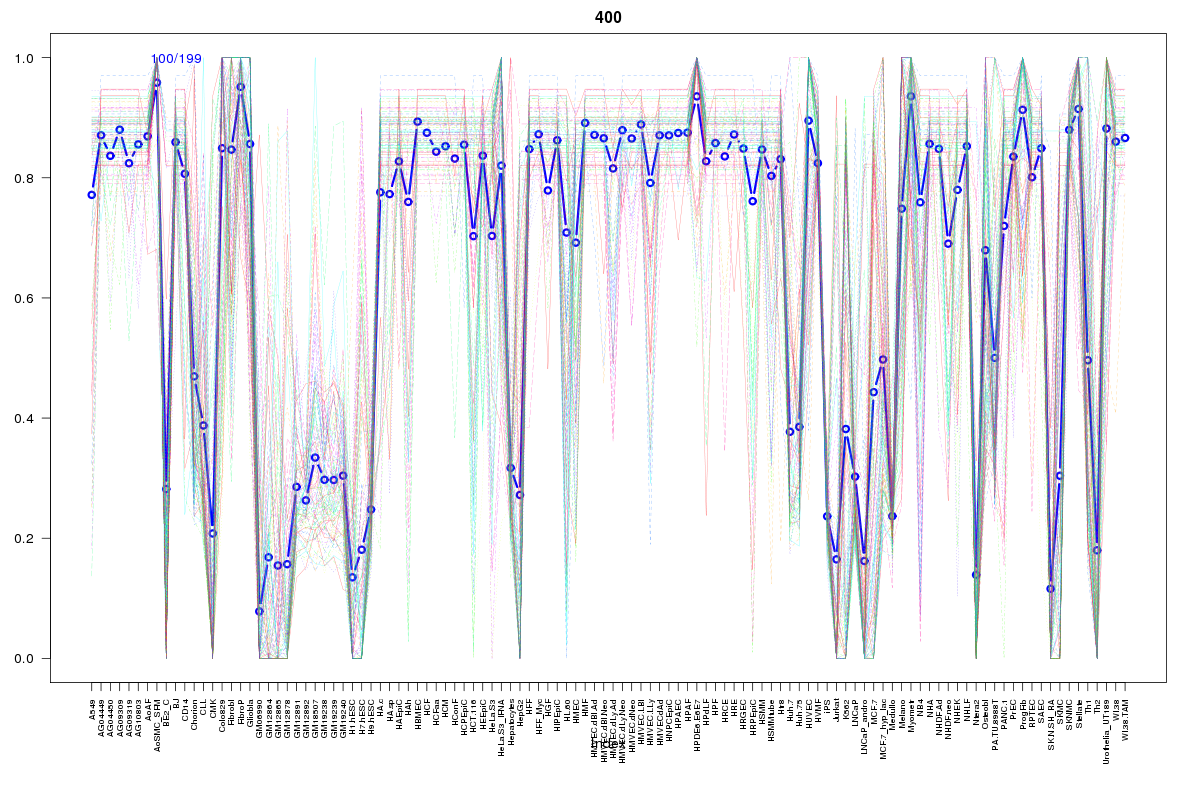 | 400 | 1 |
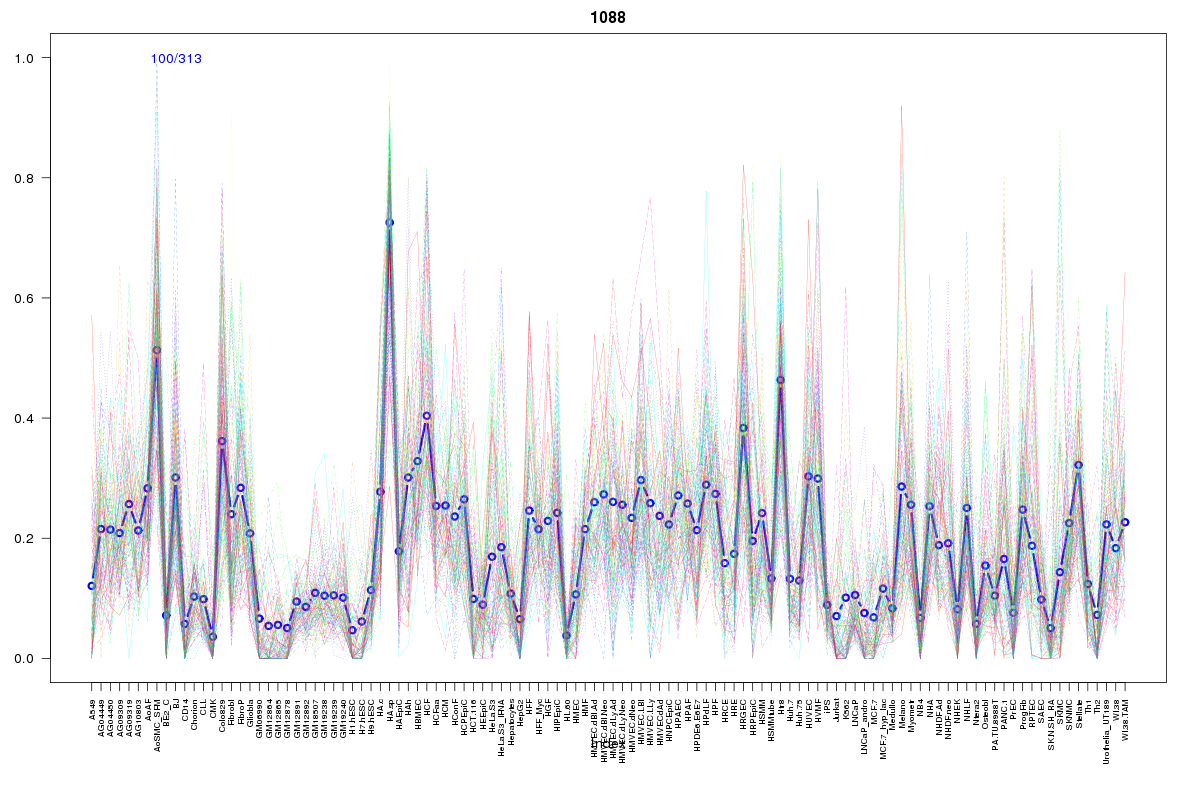 | 1088 | 1 |
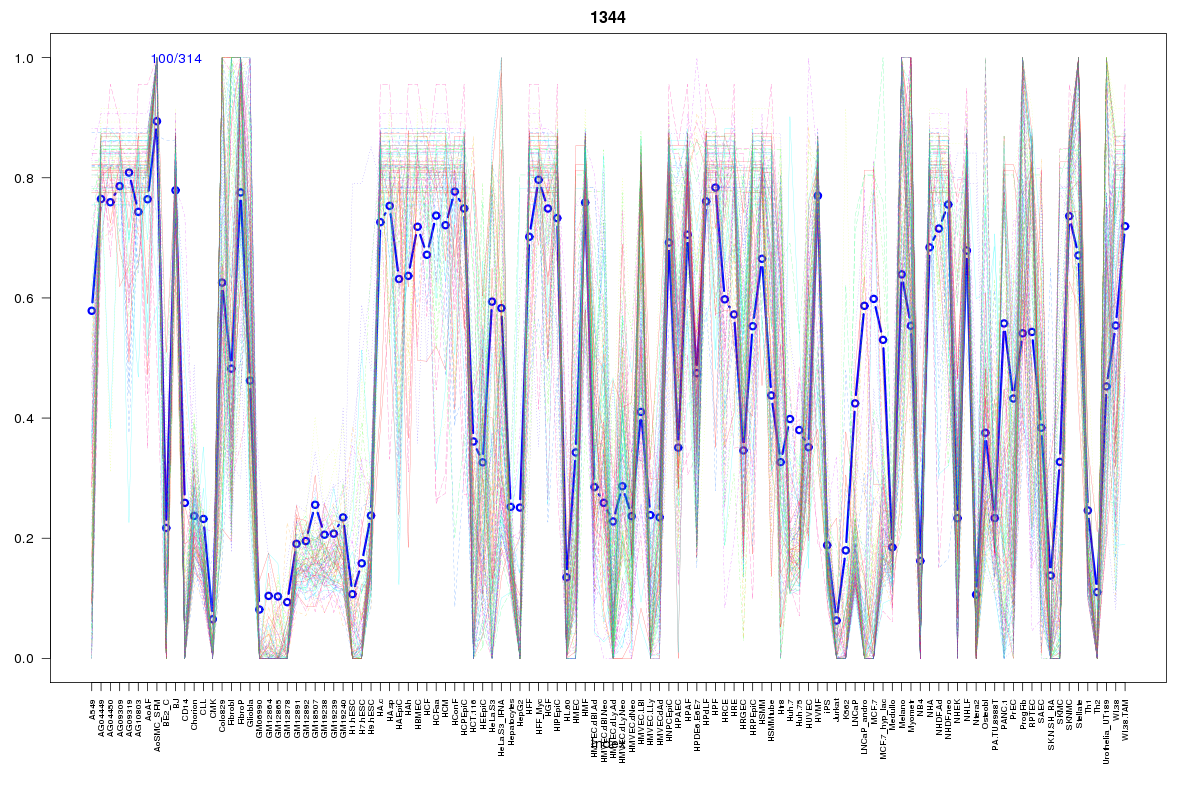 | 1344 | 1 |
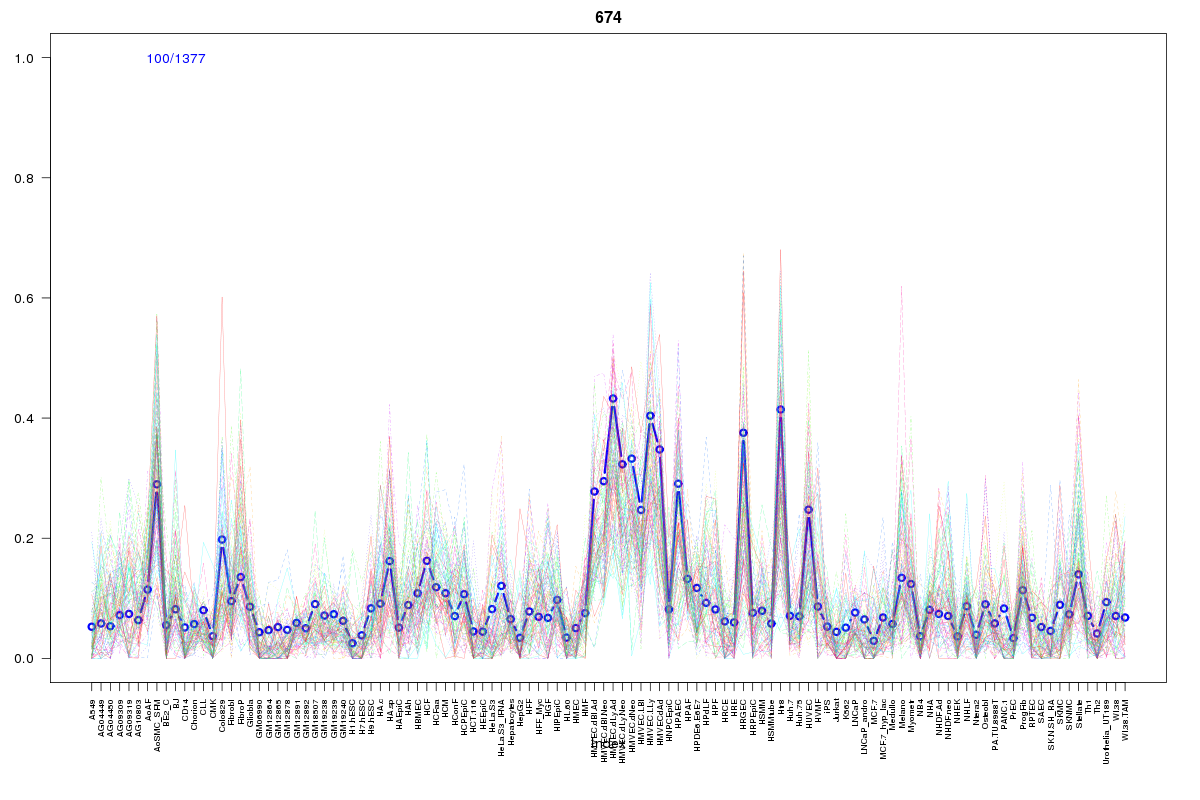 | 674 | 1 |
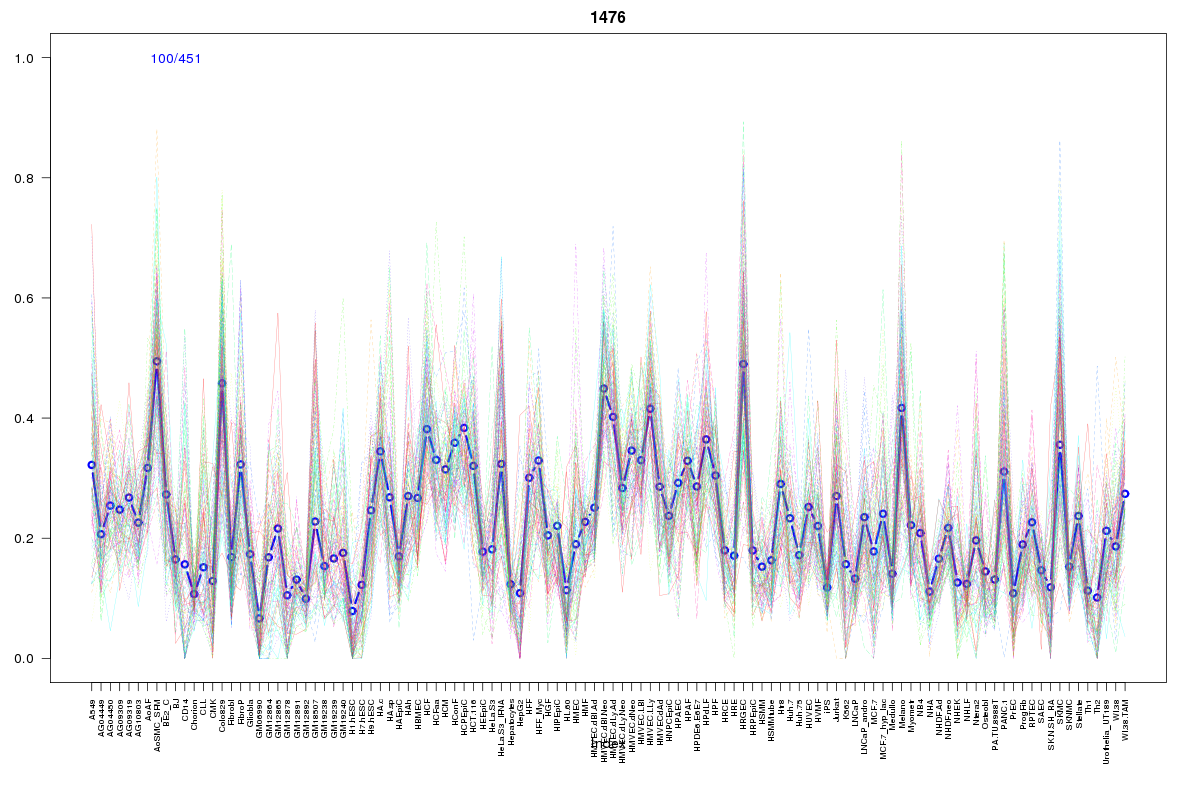 | 1476 | 1 |
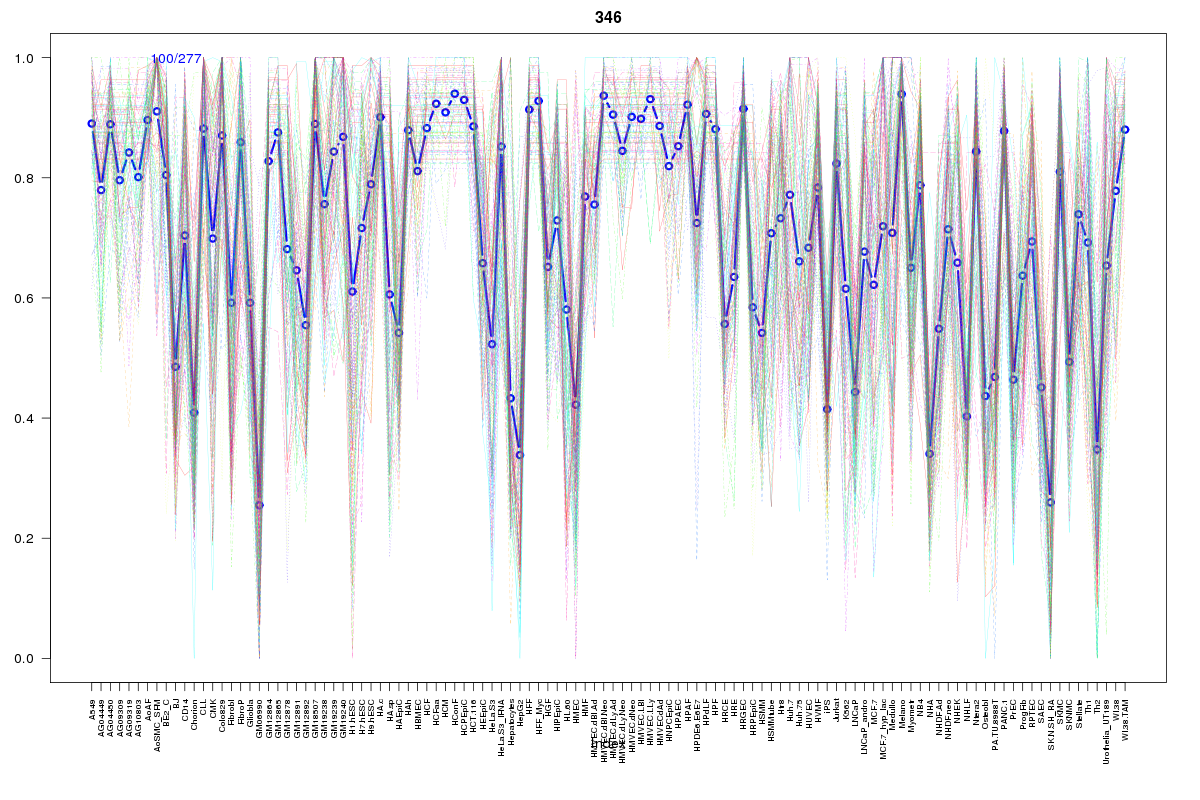 | 346 | 1 |
 | 416 | 1 |
 | 15 | 1 |
 | 568 | 1 |
Resources
BED file downloads
Connects to 10 DHS sitesTop 10 Correlated DHS Sites
p-values indiciate significant higher or lower correlation| Location | Cluster | P-value |
|---|---|---|
| chr9:19101340-19101490 | 15 | 0.004 |
| chr9:19030865-19031015 | 416 | 0.005 |
| chr9:19118285-19118435 | 568 | 0.022 |
| chr9:19119040-19119190 | 1874 | 0.013 |
| chr9:19184120-19184270 | 1088 | 0.009 |
| chr9:19013180-19013330 | 674 | 0.007 |
| chr9:19028980-19029130 | 346 | 0.007 |
| chr9:19013340-19013490 | 1476 | 0.007 |
| chr9:19161780-19161930 | 400 | 0 |
| chr9:19184560-19184710 | 1344 | 0 |
External Databases
UCSCEnsembl (ENSG00000201118)