Gene: GGTA1P
chr9: 124207268-124262036Expression Profile
(log scale)
Graphical Connections
Distribution of linked clusters:
You may find it interesting if many of the connected DHS sites belong to the same cluster.| Cluster Profile | Cluster ID | Number of DHS sites in this cluster |
|---|---|---|
 | 626 | 2 |
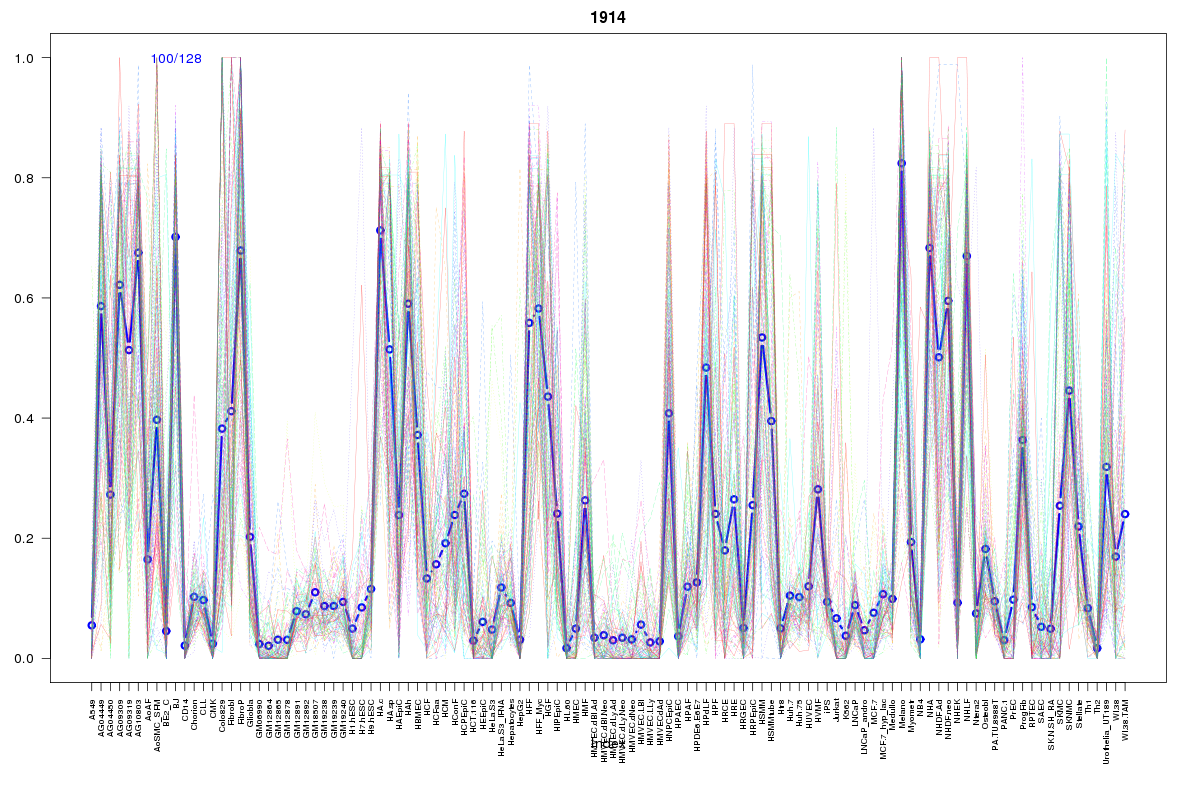 | 1914 | 2 |
 | 687 | 2 |
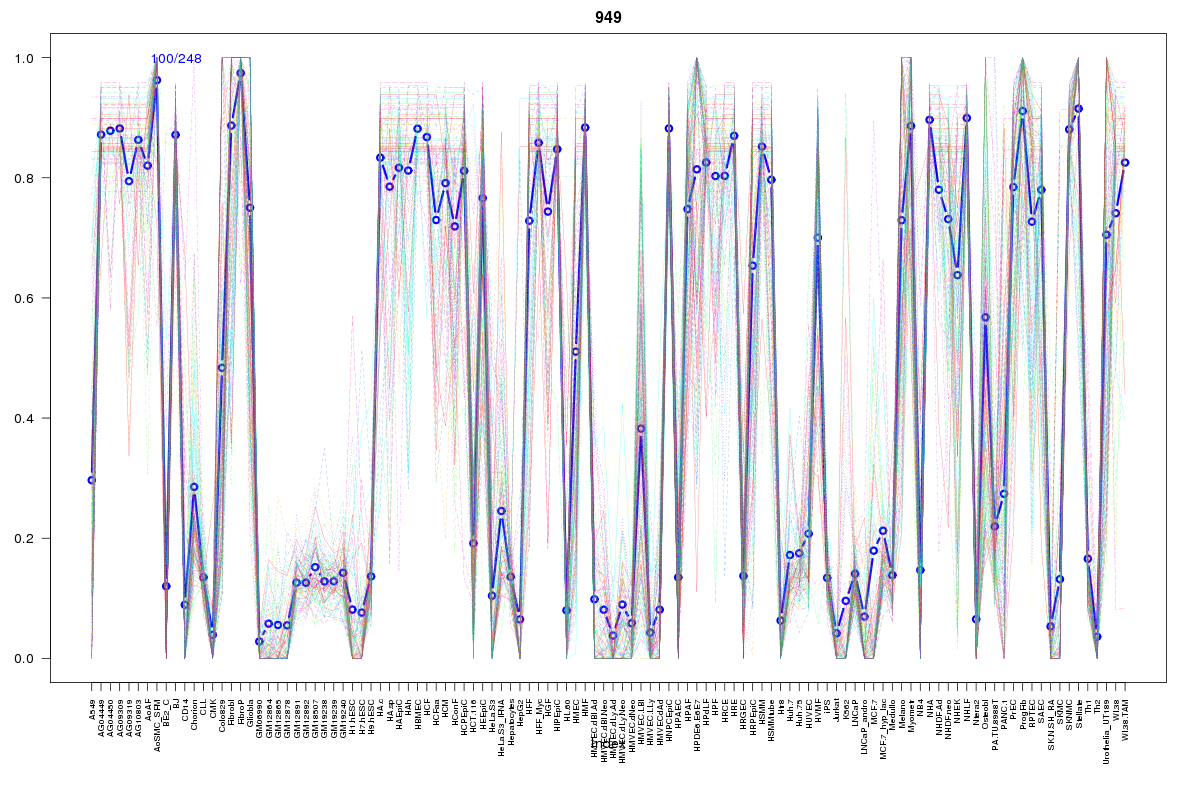 | 949 | 1 |
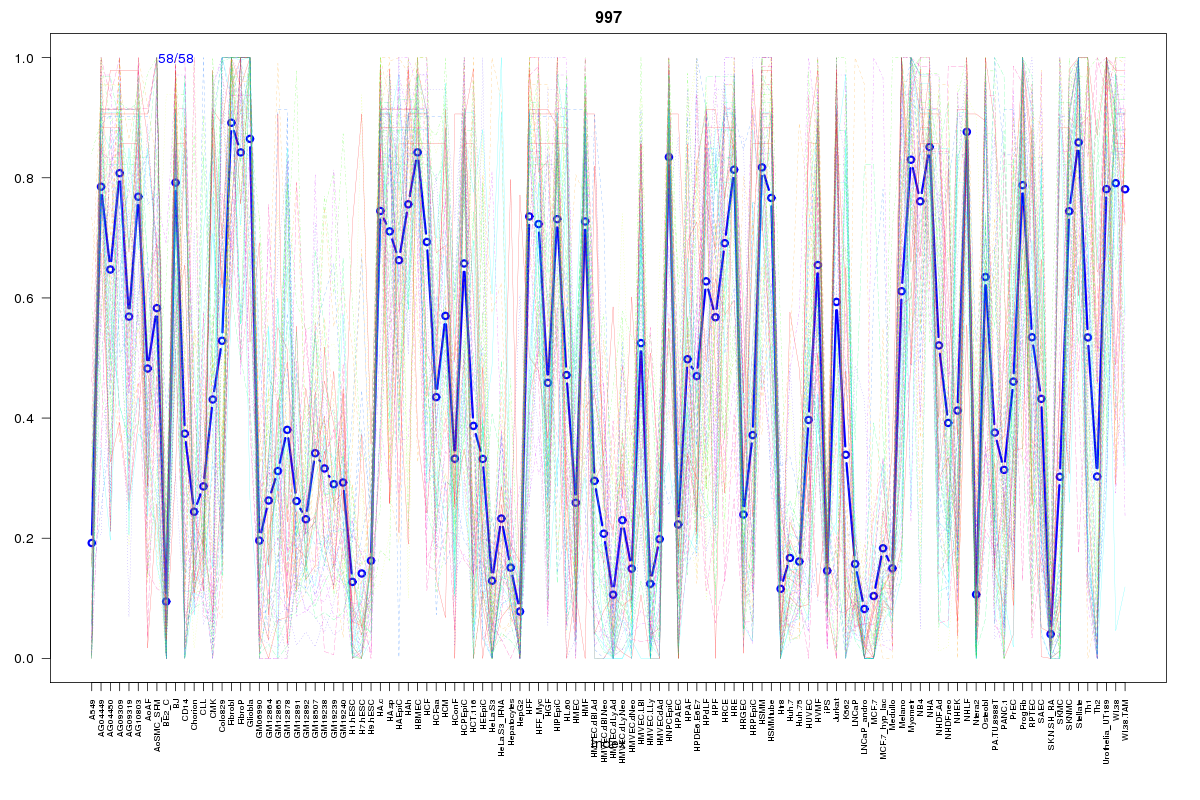 | 997 | 1 |
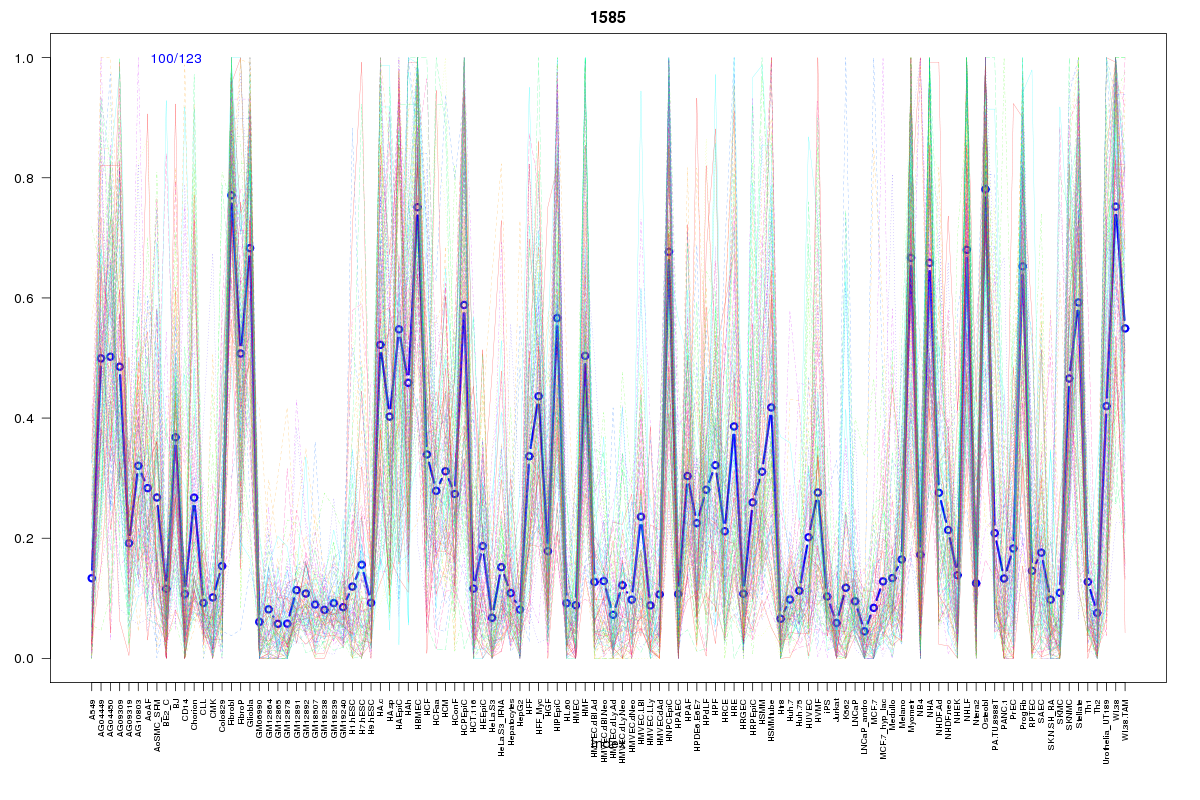 | 1585 | 1 |
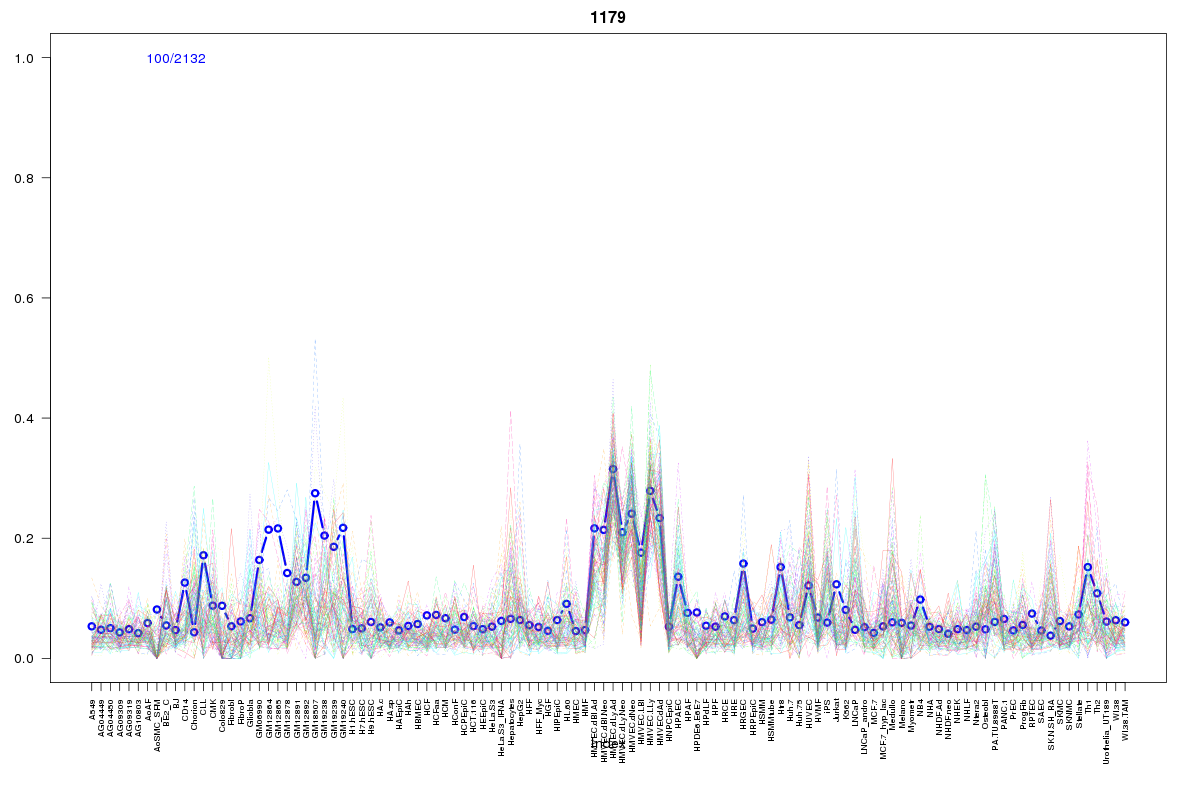 | 1179 | 1 |
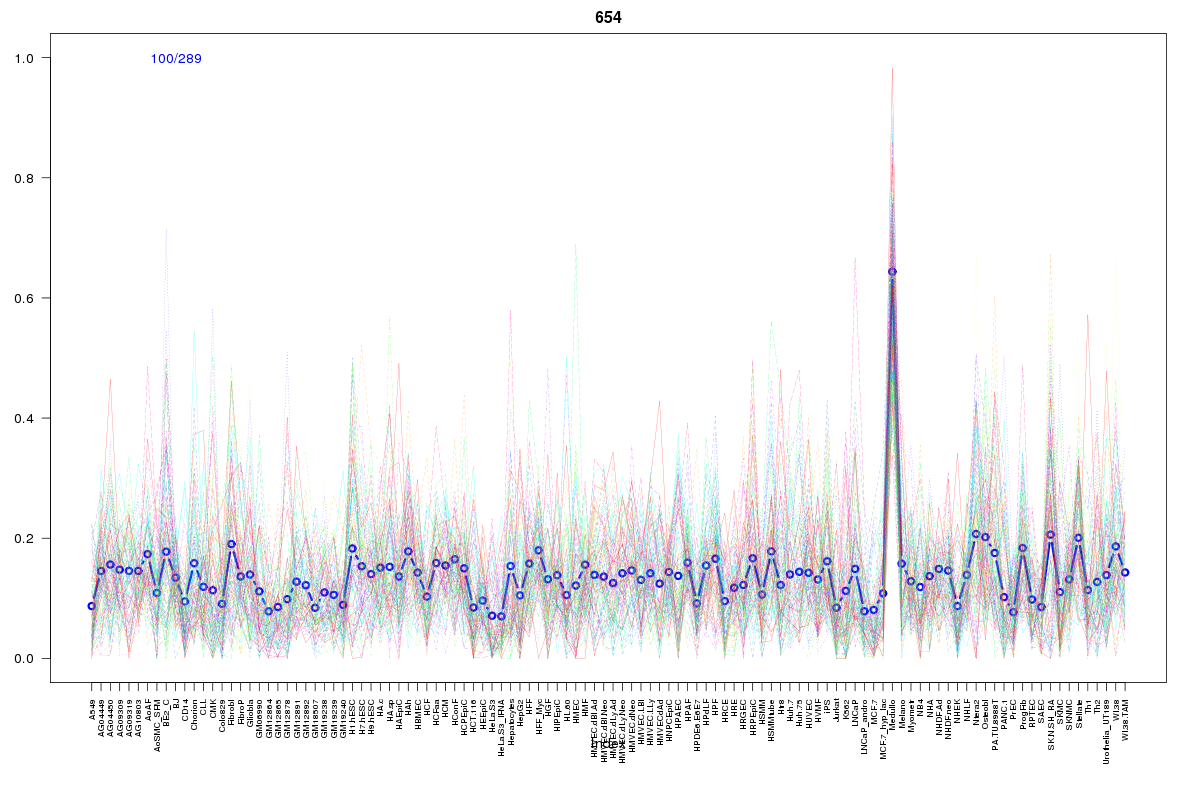 | 654 | 1 |
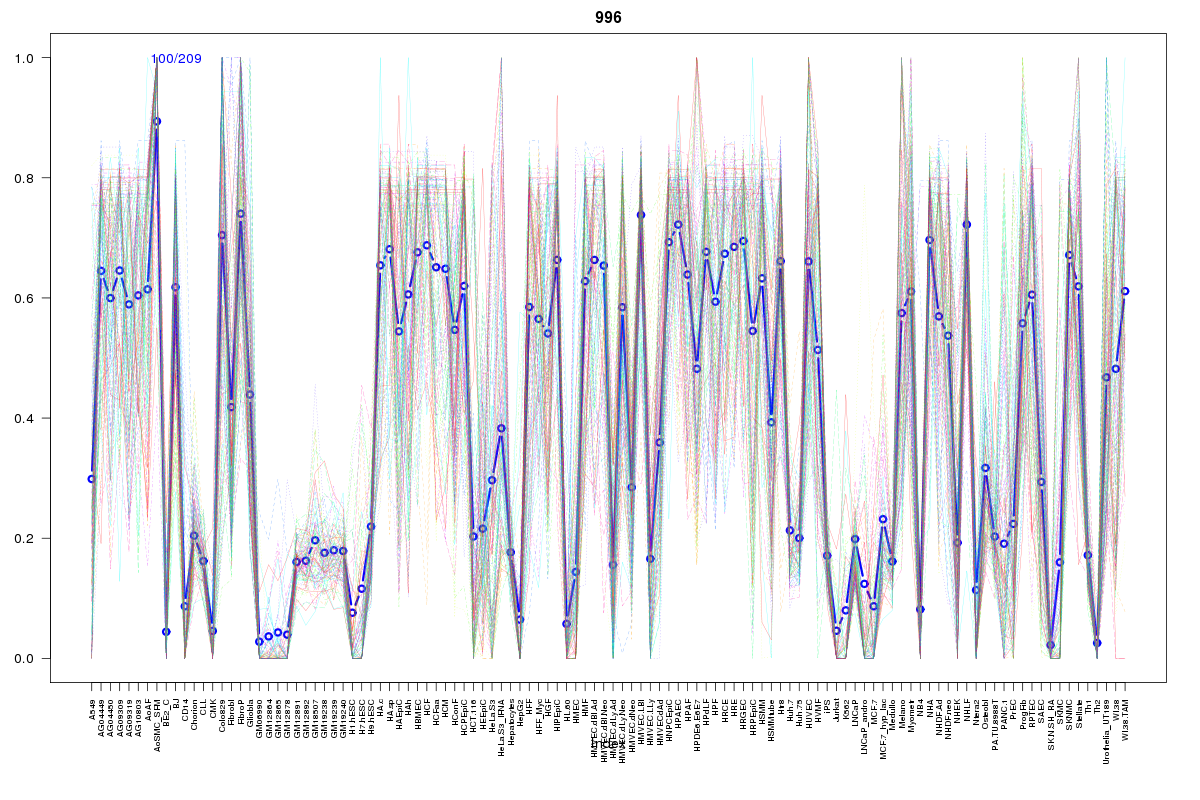 | 996 | 1 |
 | 37 | 1 |
 | 416 | 1 |
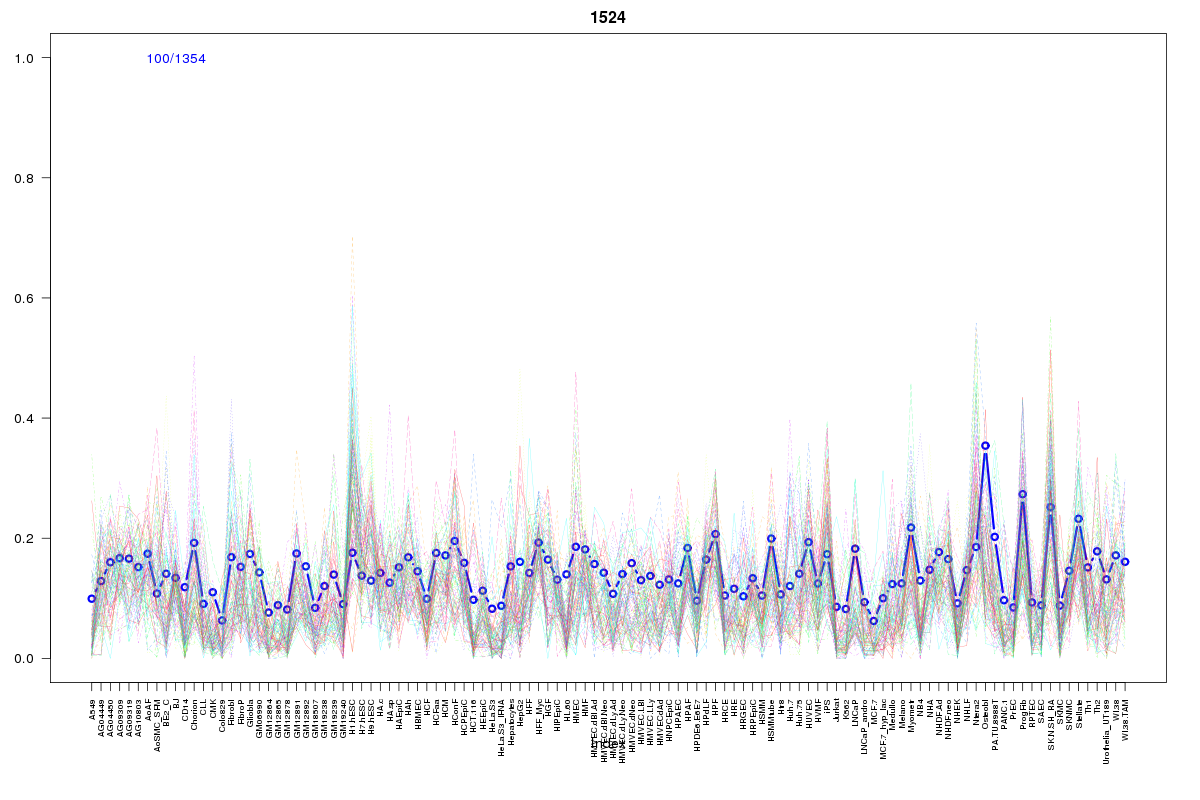 | 1524 | 1 |
 | 2133 | 1 |
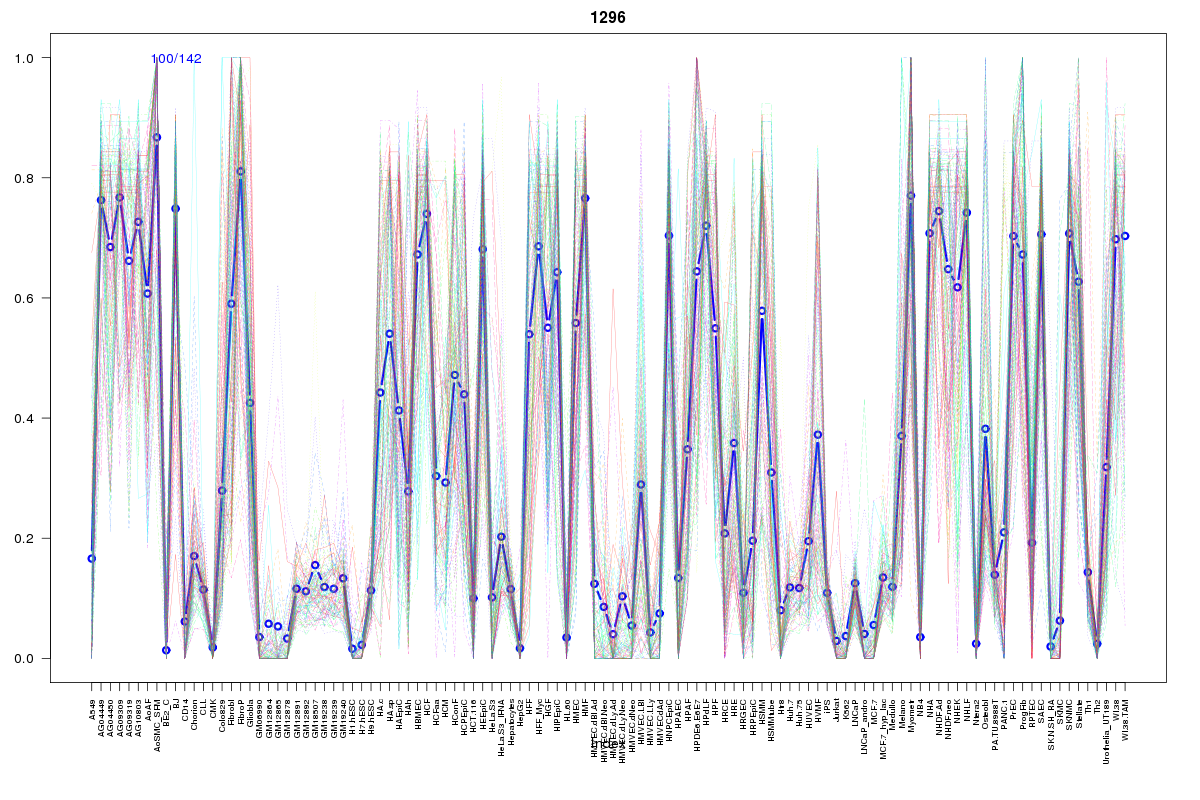 | 1296 | 1 |
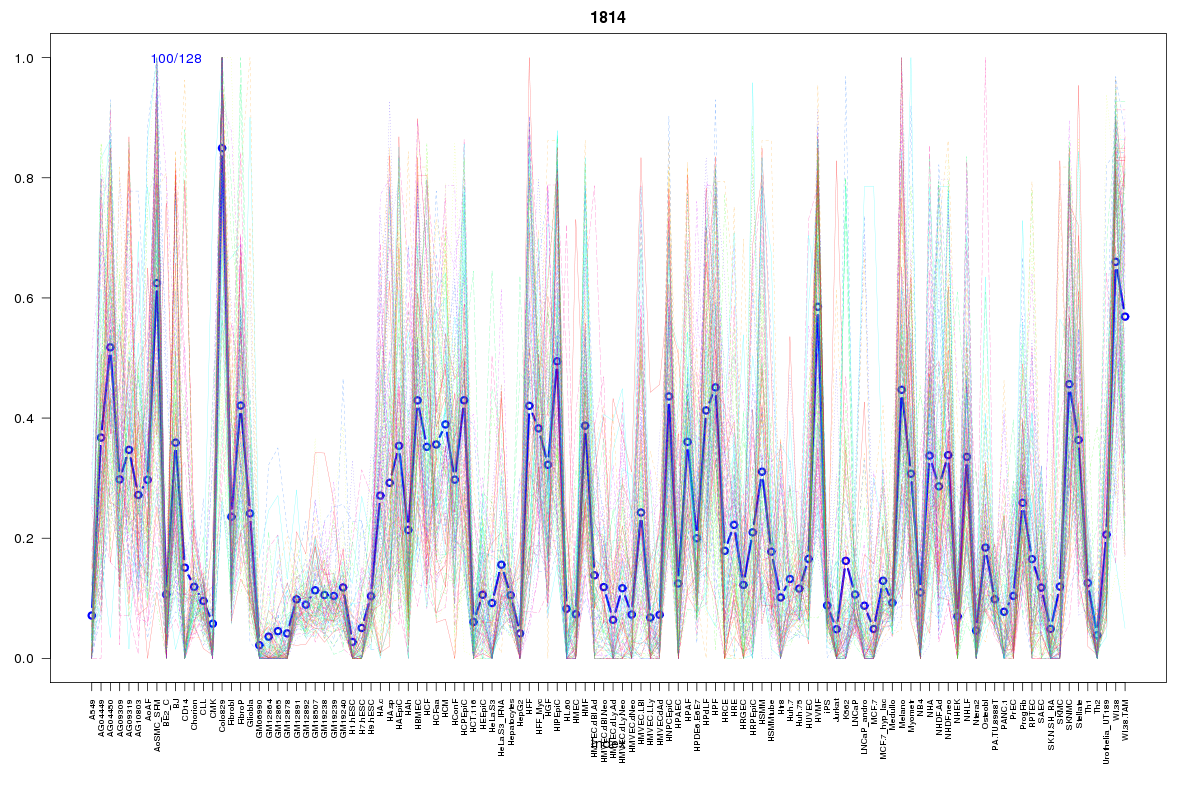 | 1814 | 1 |
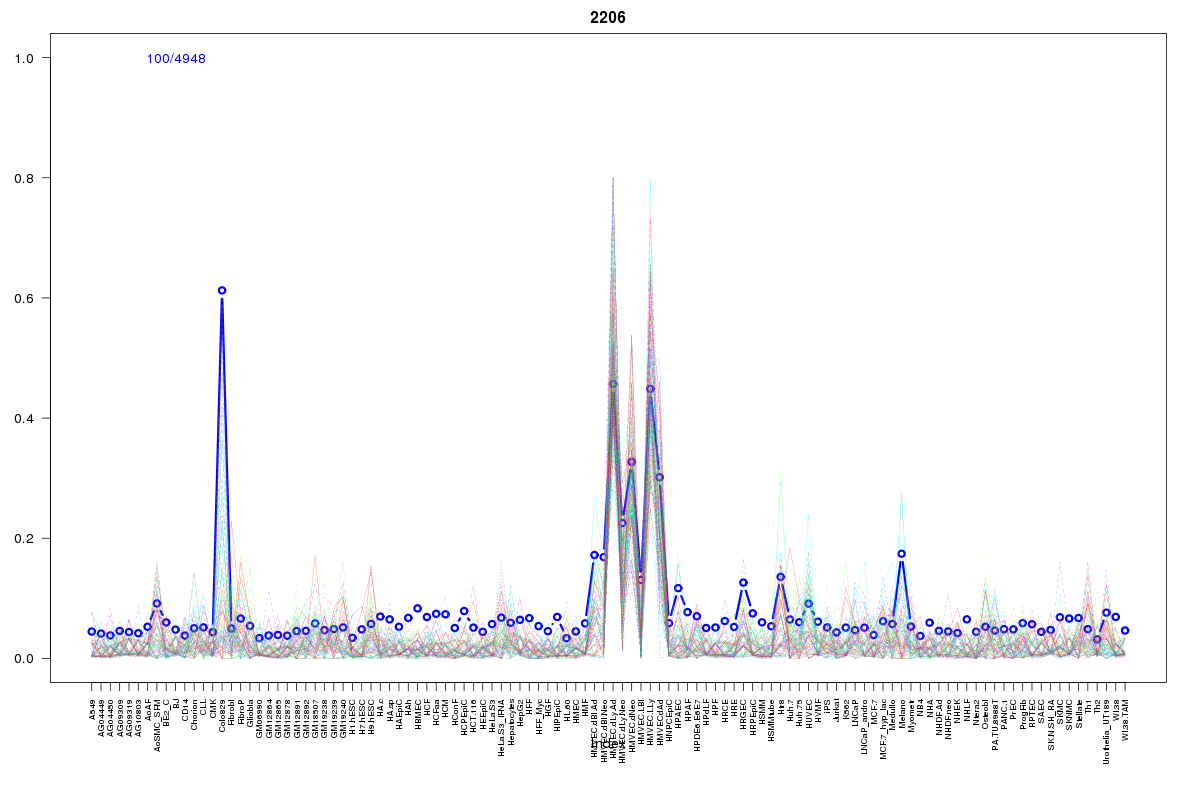 | 2206 | 1 |
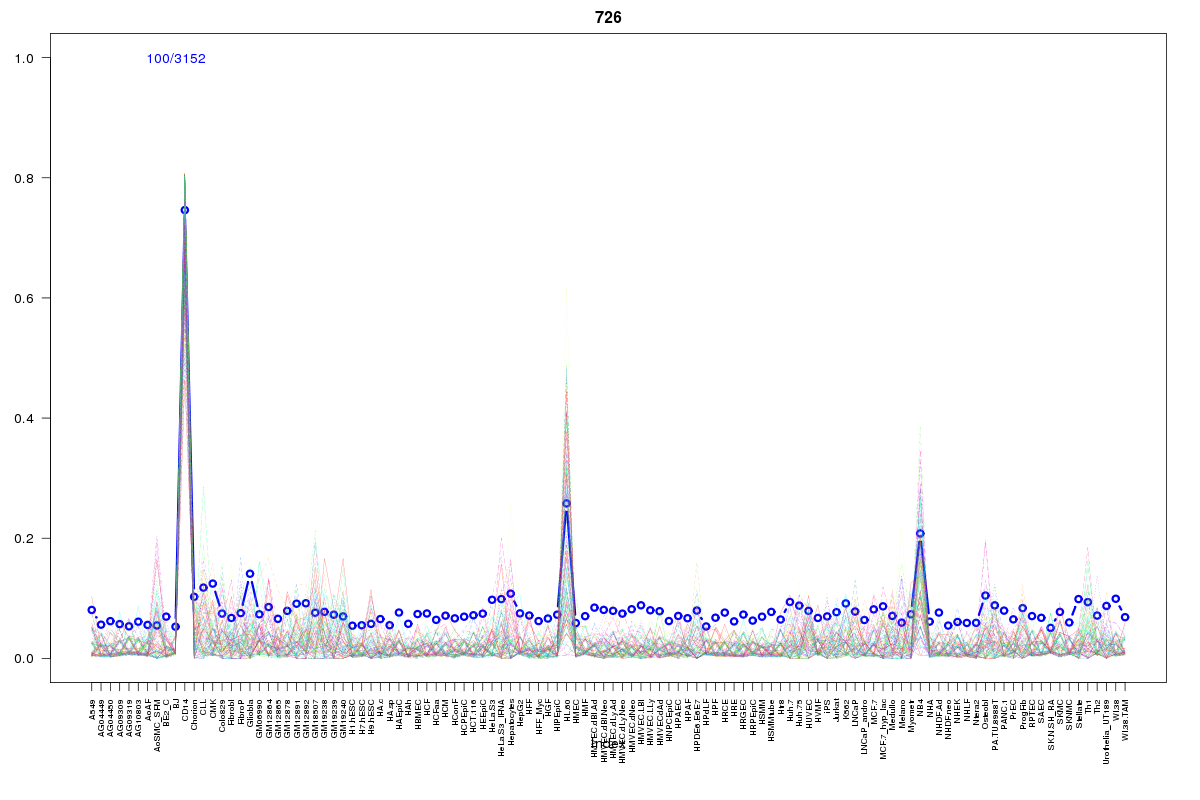 | 726 | 1 |
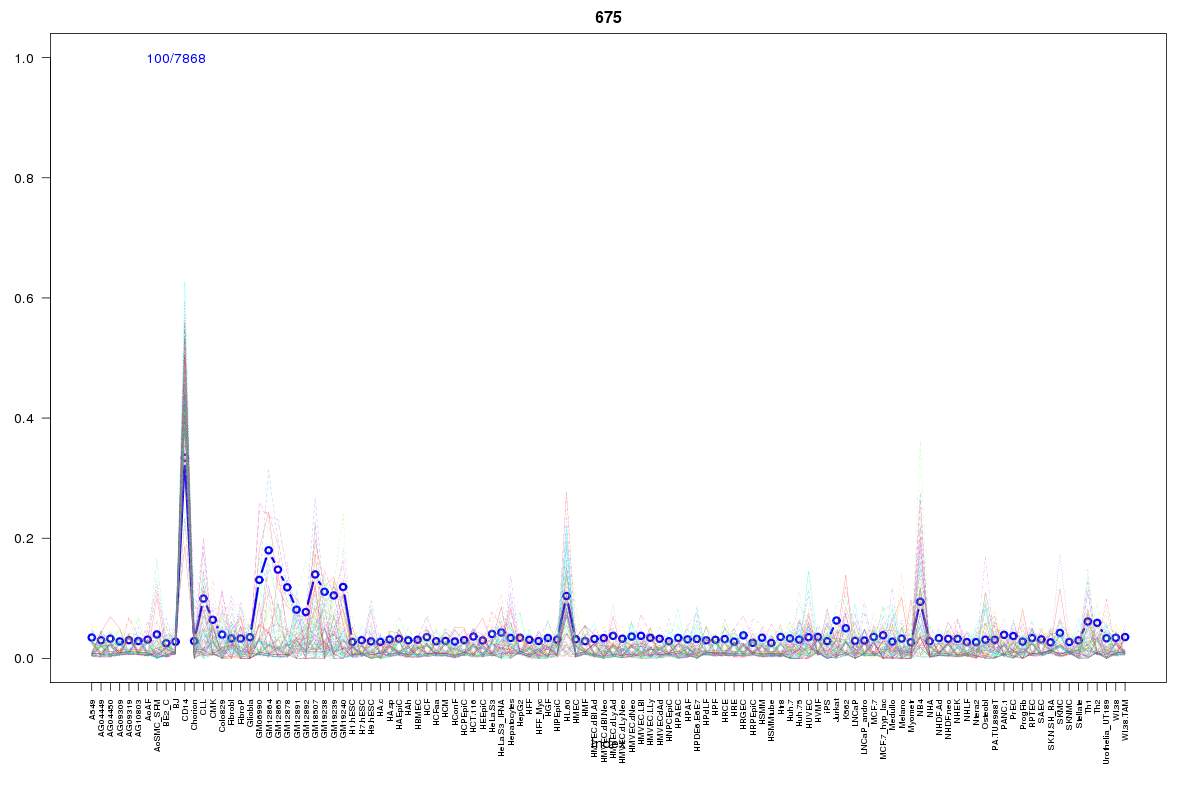 | 675 | 1 |
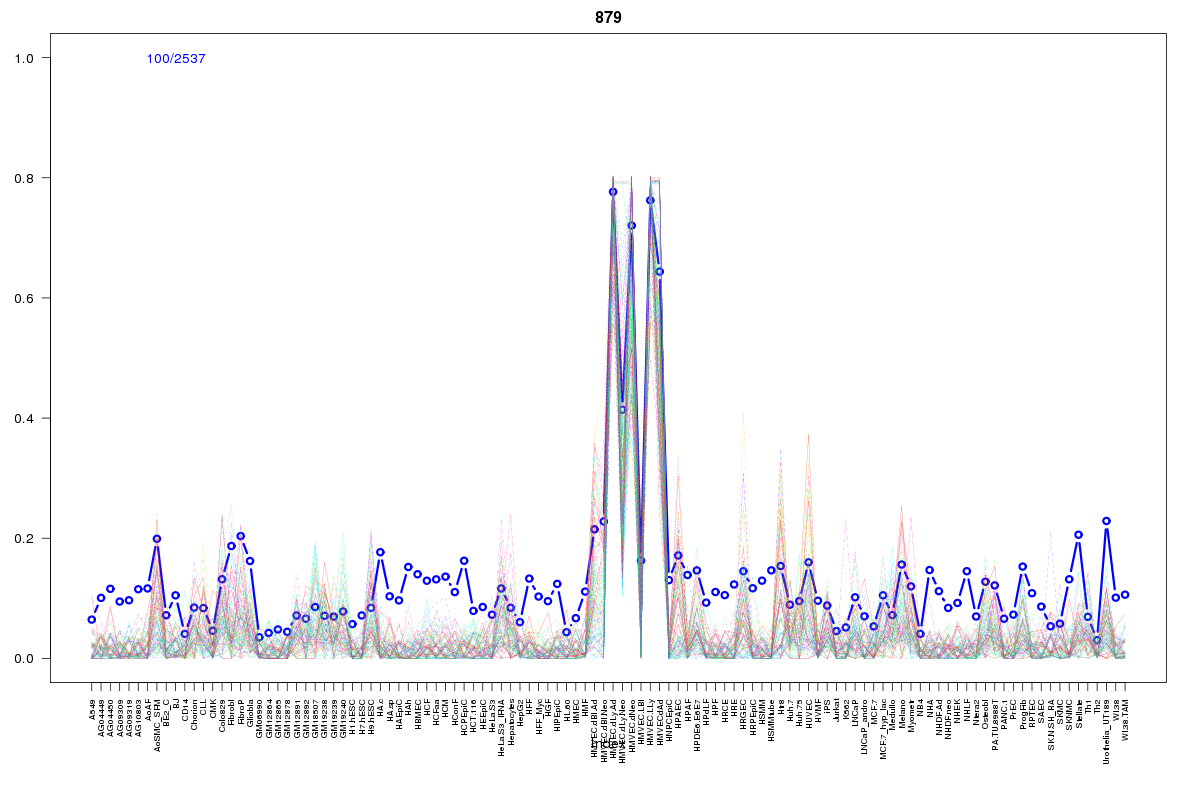 | 879 | 1 |
 | 2055 | 1 |
Resources
BED file downloads
Connects to 23 DHS sitesTop 10 Correlated DHS Sites
p-values indiciate significant higher or lower correlation| Location | Cluster | P-value |
|---|---|---|
| chr9:124265100-124265250 | 675 | 0.011 |
| chr9:124255380-124255530 | 726 | 0.011 |
| chr9:124206400-124206550 | 626 | 0.011 |
| chr9:124306605-124306755 | 2055 | 0.012 |
| chr9:124115560-124115710 | 626 | 0.014 |
| chr9:124248360-124248510 | 2206 | 0.014 |
| chr9:124121160-124121310 | 1179 | 0.019 |
| chr9:124131380-124131530 | 416 | 0.021 |
| chr9:124259600-124259750 | 687 | 0.021 |
| chr9:124233480-124233630 | 687 | 0.022 |
| chr9:124273180-124273330 | 879 | 0.024 |
External Databases
UCSCEnsembl (ENSG00000204136)