Gene: TCEA3
chr1: 23707553-23751233Expression Profile
(log scale)
Graphical Connections
Distribution of linked clusters:
You may find it interesting if many of the connected DHS sites belong to the same cluster.| Cluster Profile | Cluster ID | Number of DHS sites in this cluster |
|---|---|---|
 | 1113 | 1 |
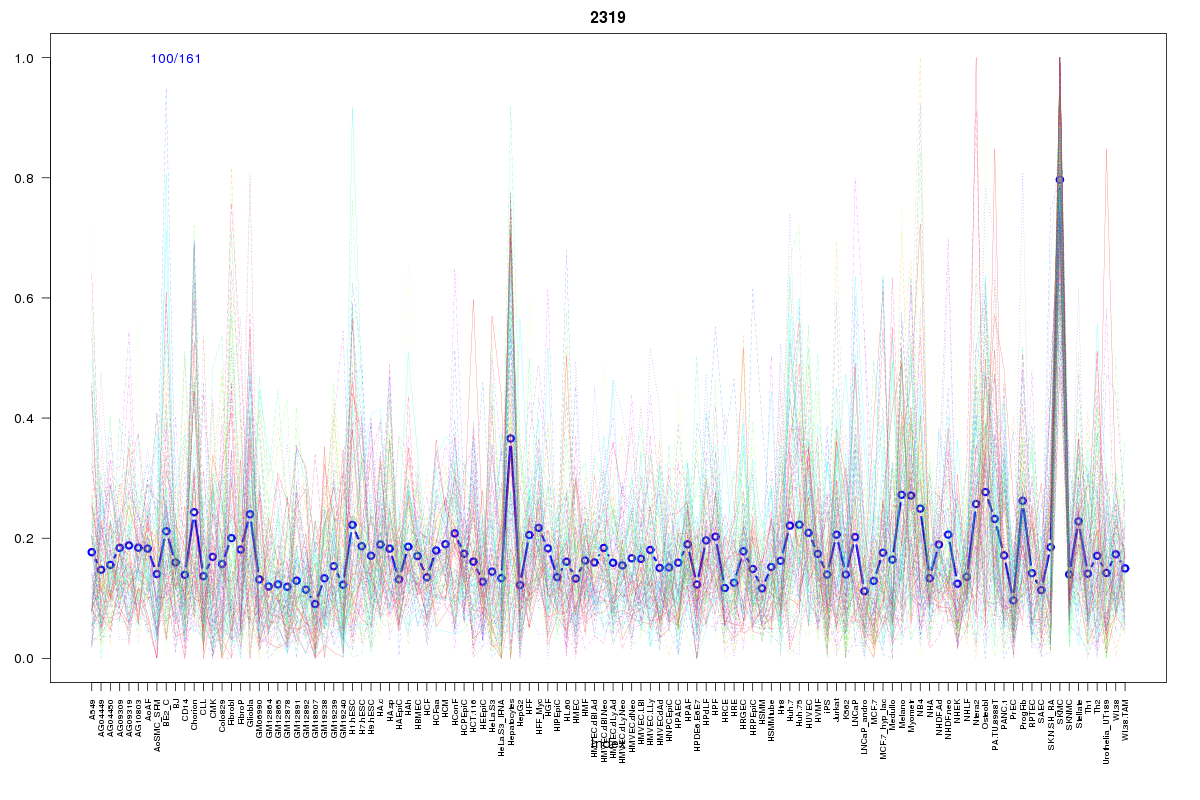 | 2319 | 1 |
 | 881 | 1 |
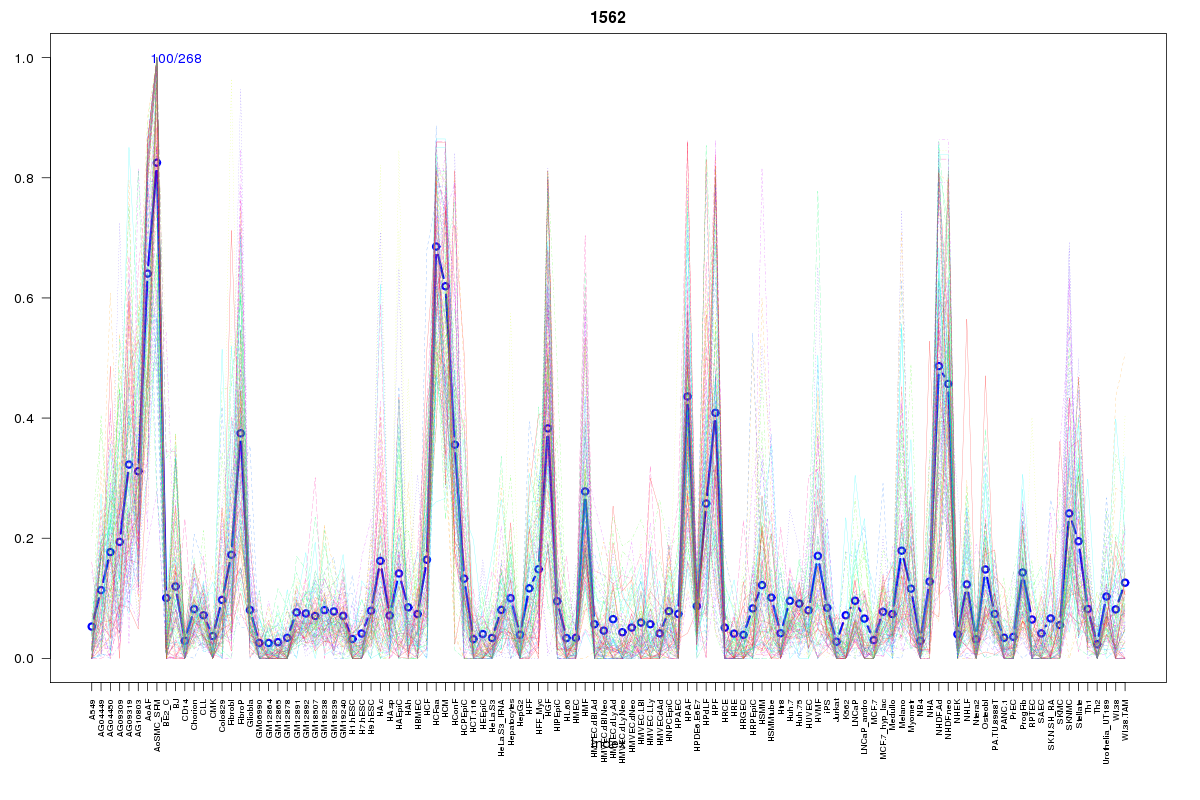 | 1562 | 1 |
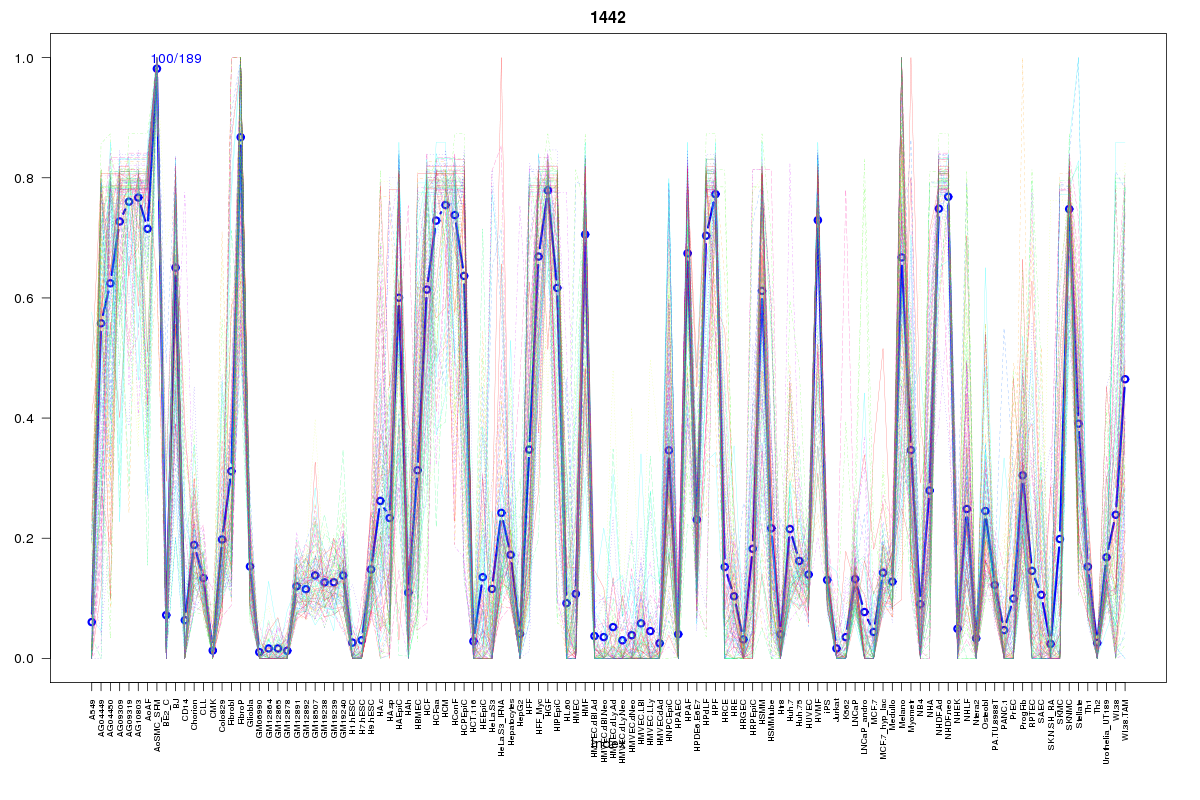 | 1442 | 1 |
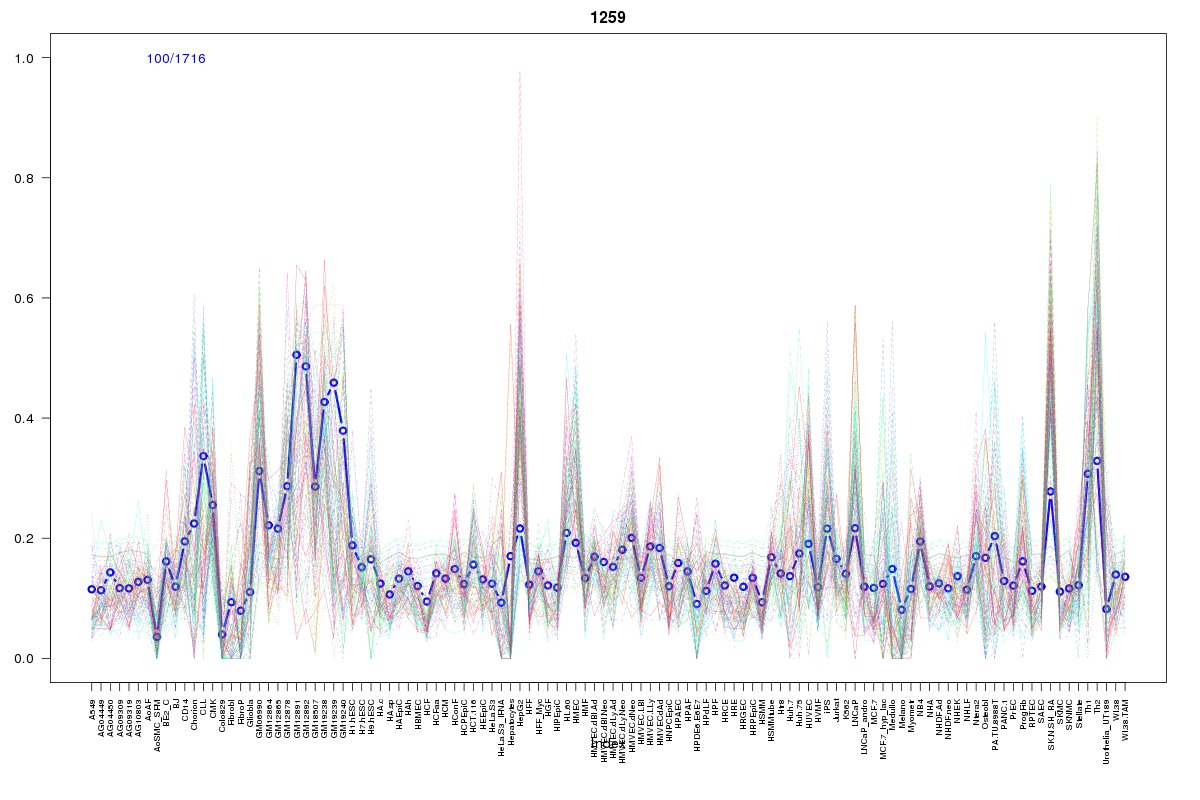 | 1259 | 1 |
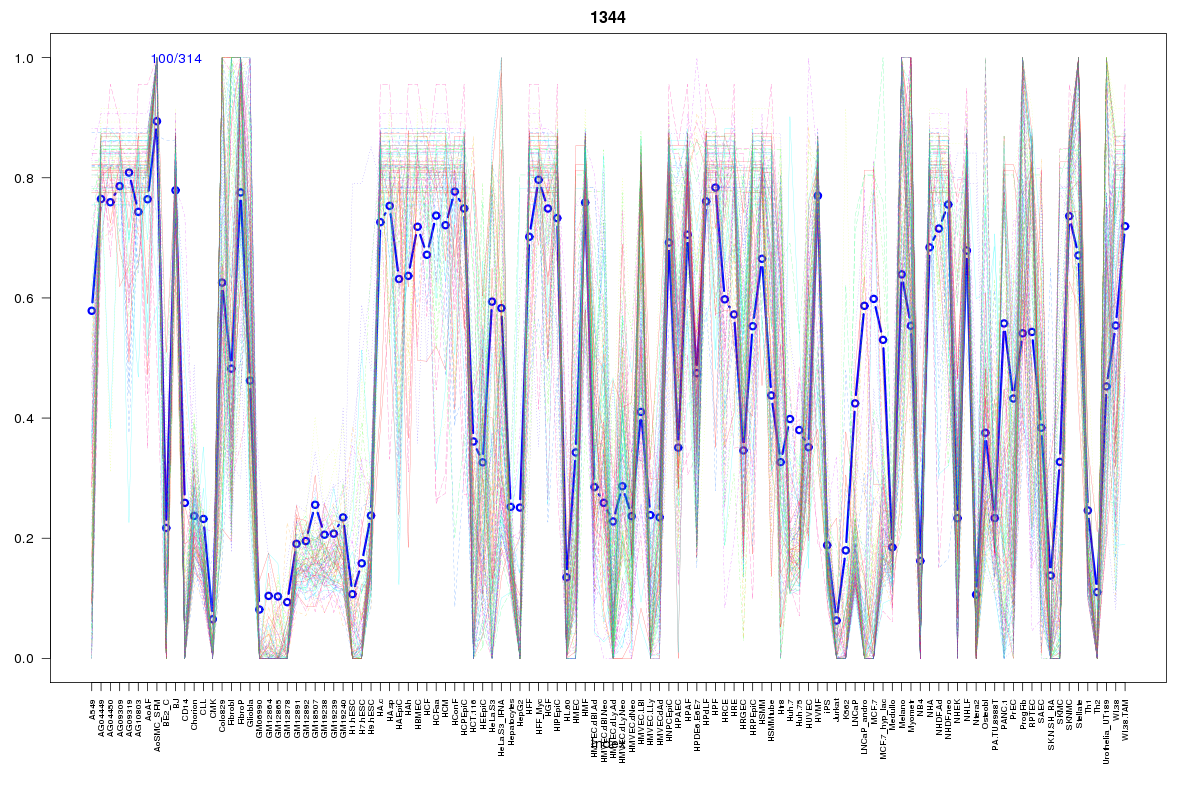 | 1344 | 1 |
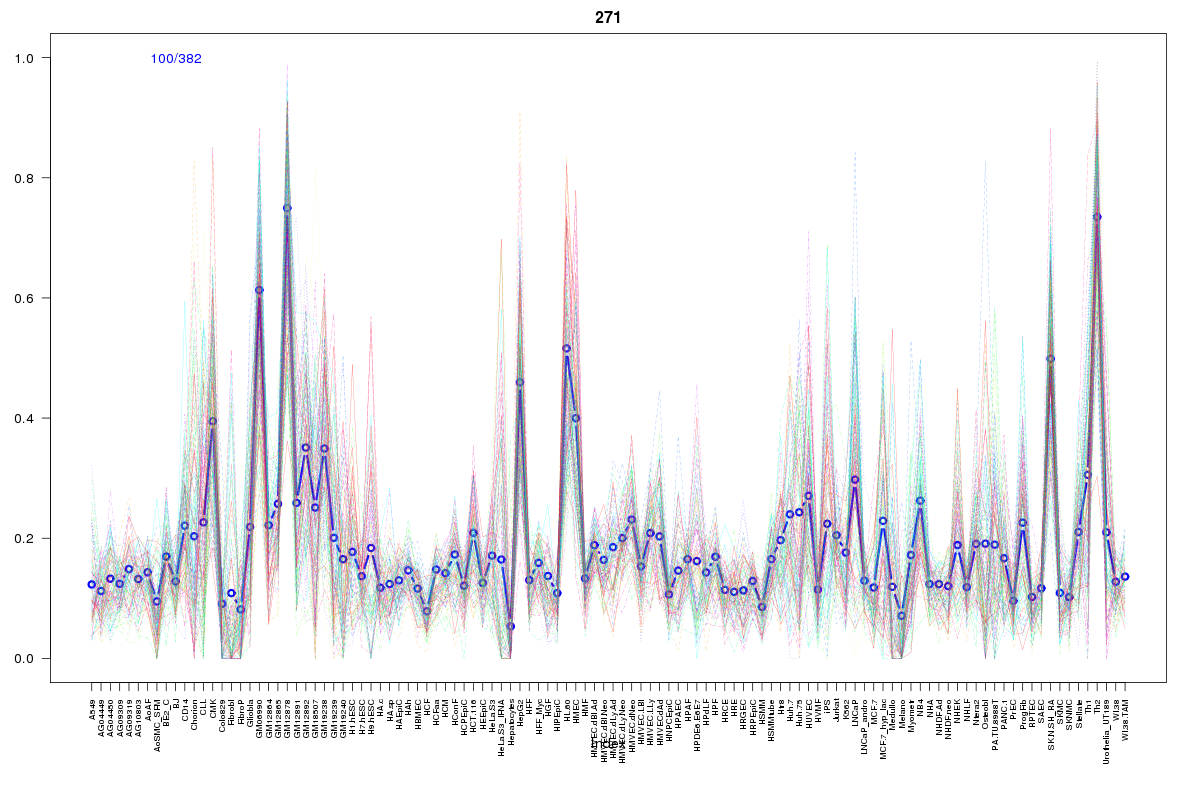 | 271 | 1 |
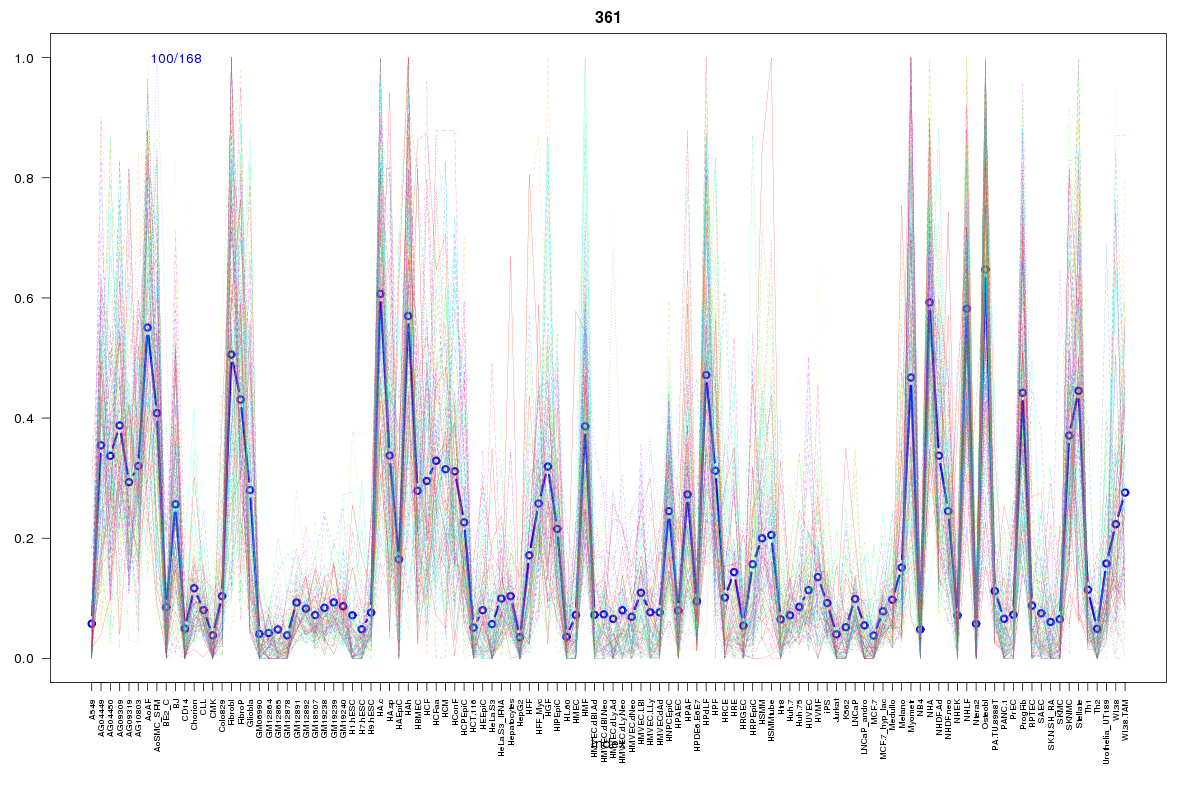 | 361 | 1 |
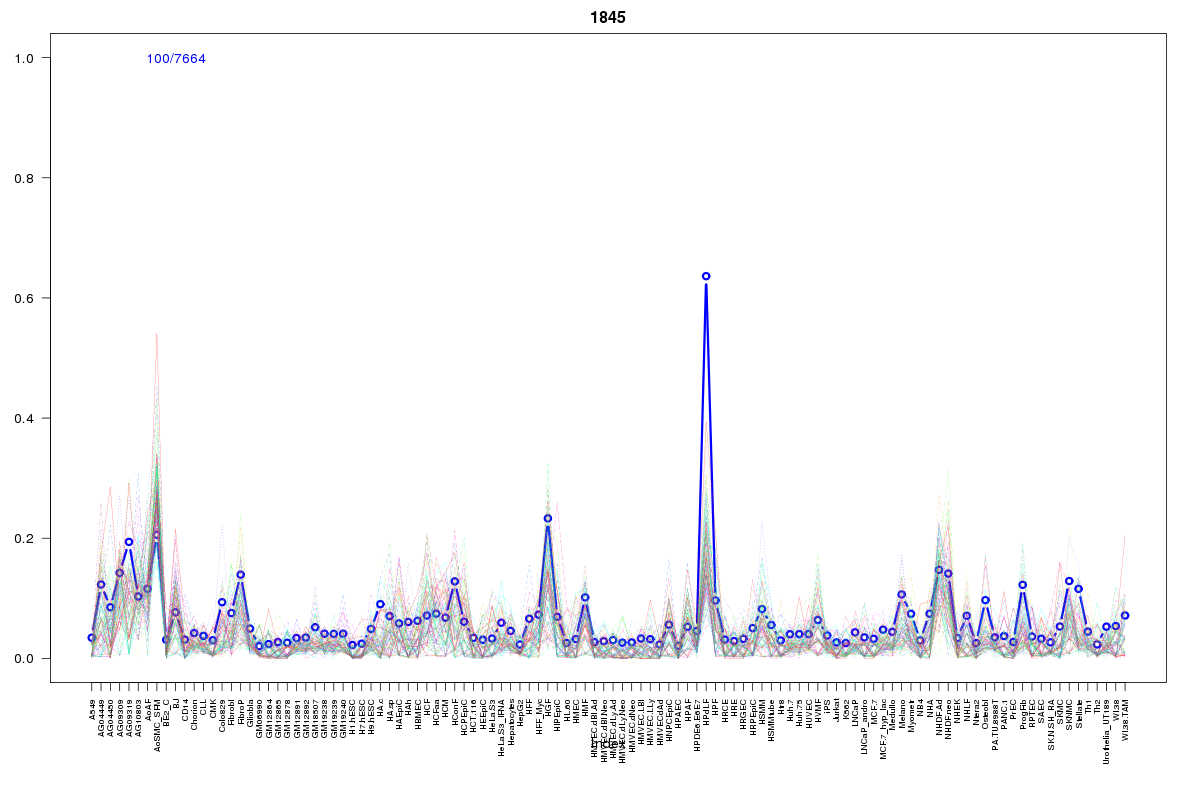 | 1845 | 1 |
 | 913 | 1 |
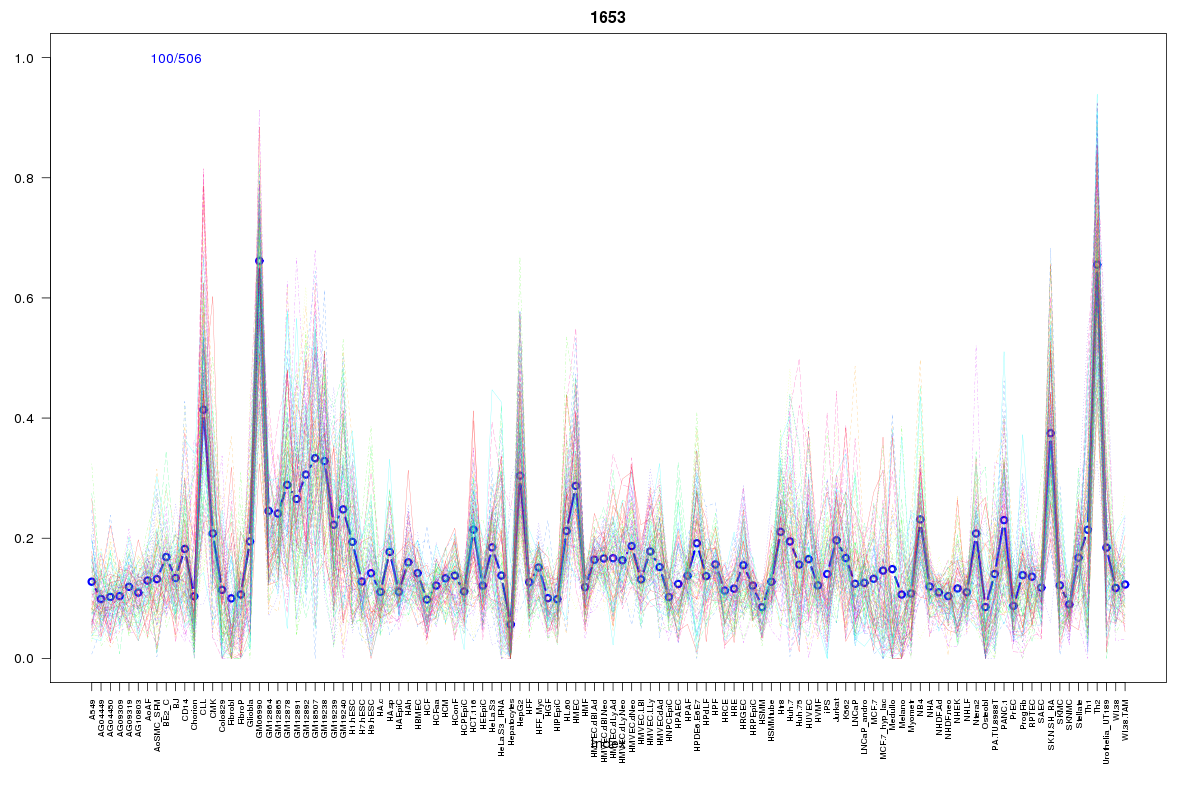 | 1653 | 1 |
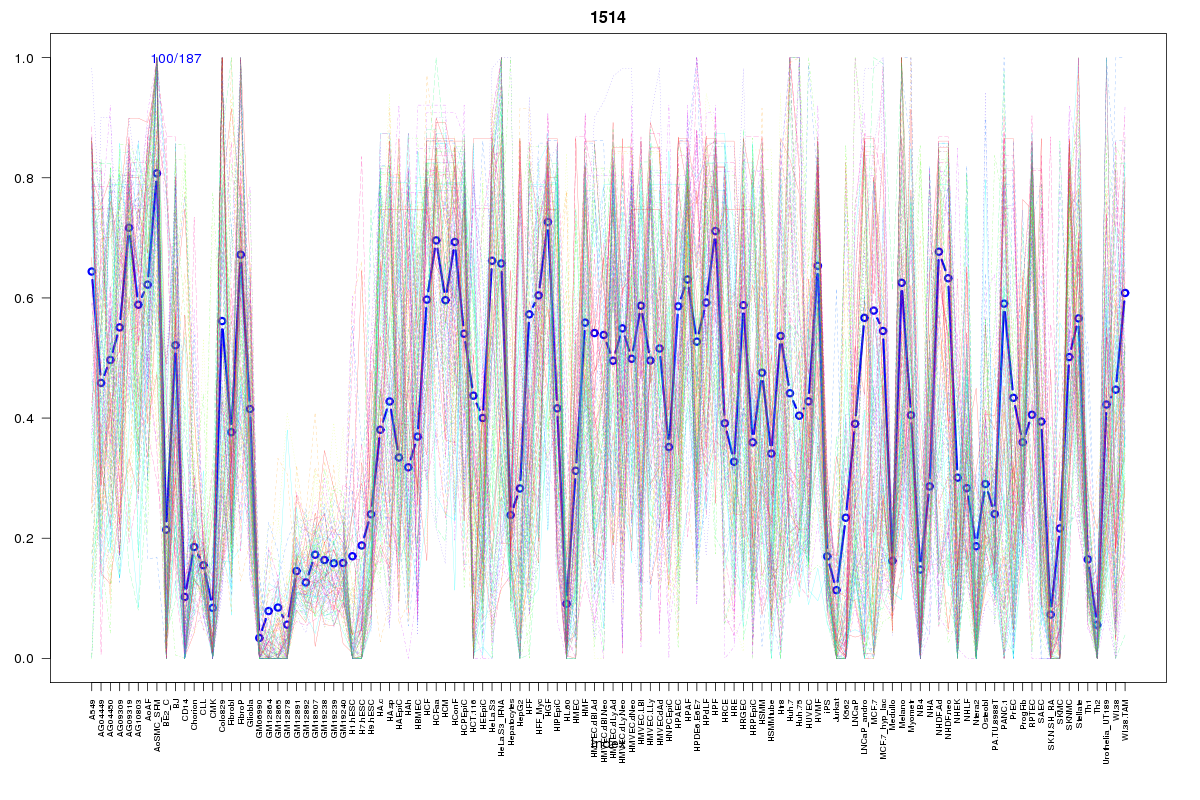 | 1514 | 1 |
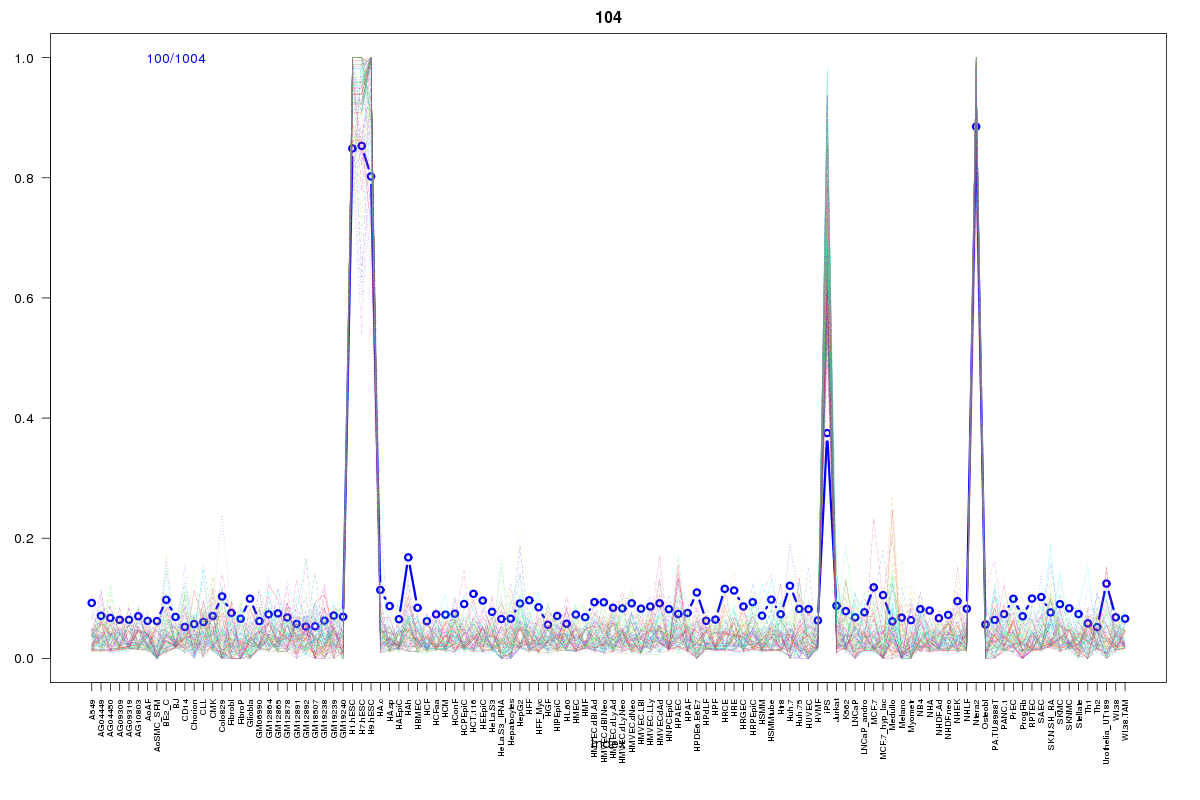 | 104 | 1 |
 | 1056 | 1 |
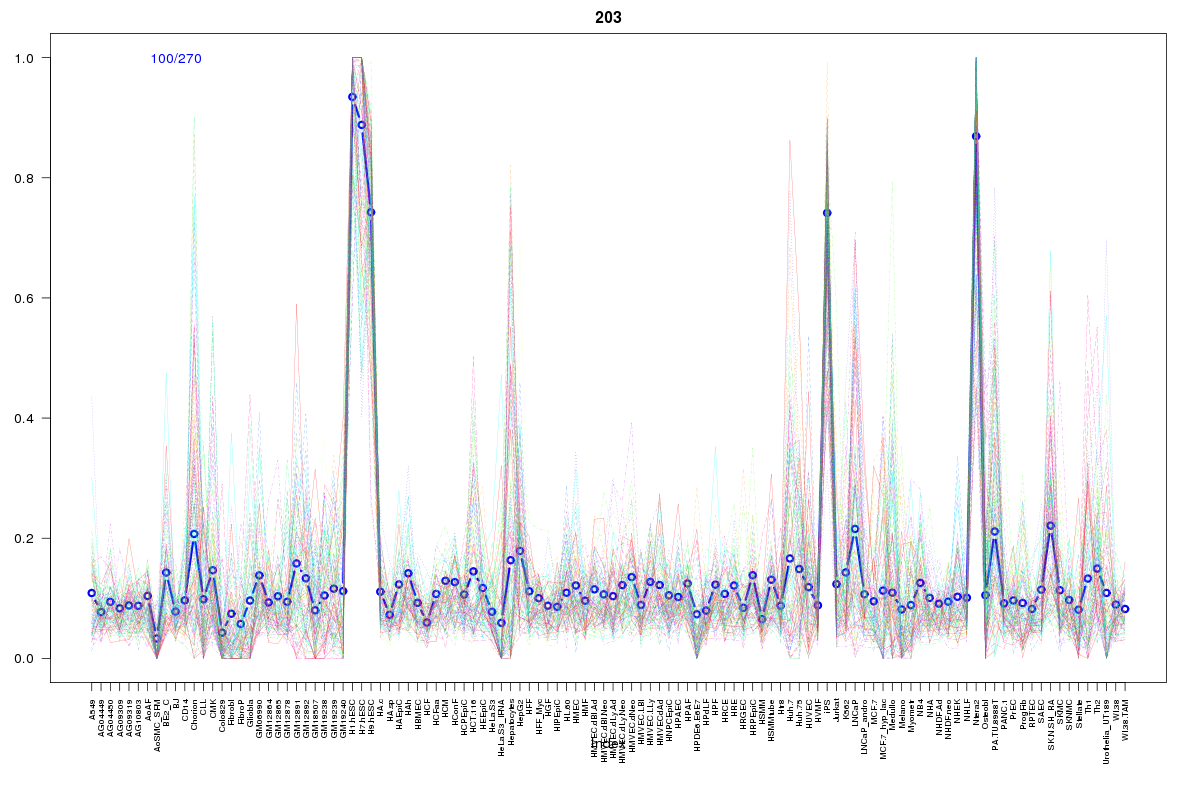 | 203 | 1 |
 | 927 | 1 |
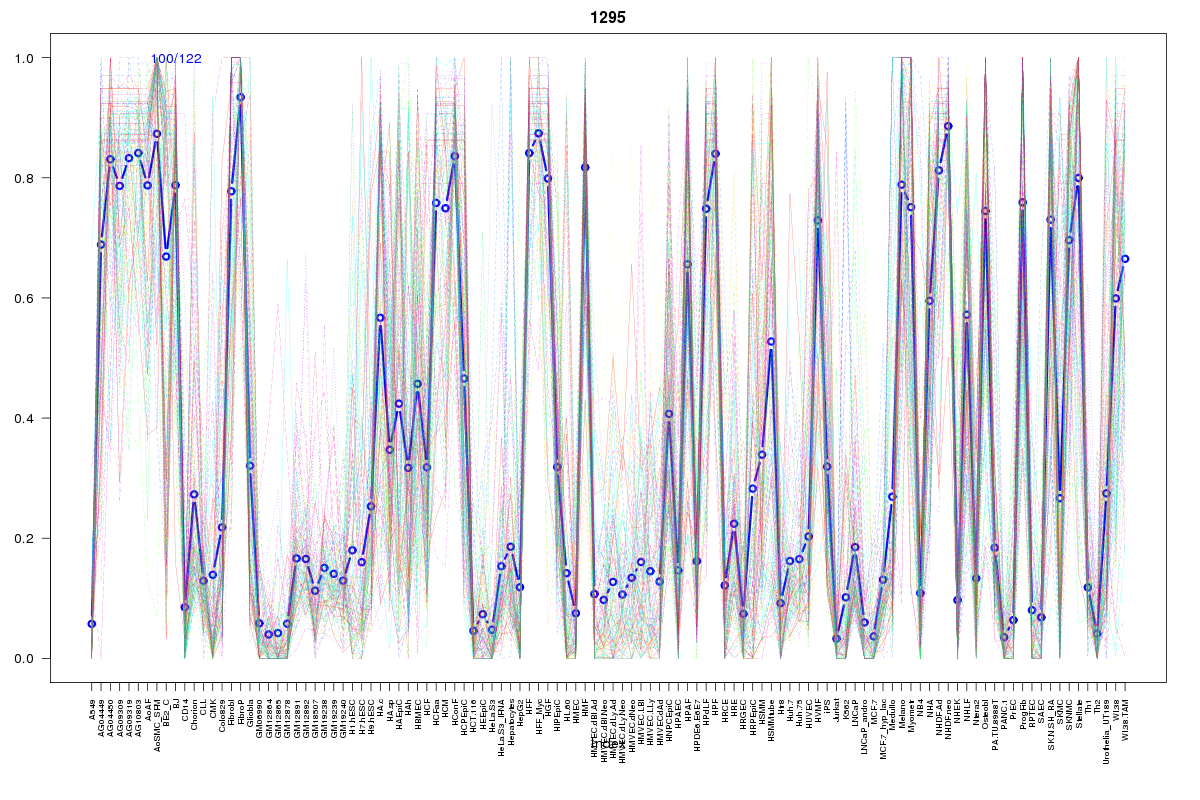 | 1295 | 1 |
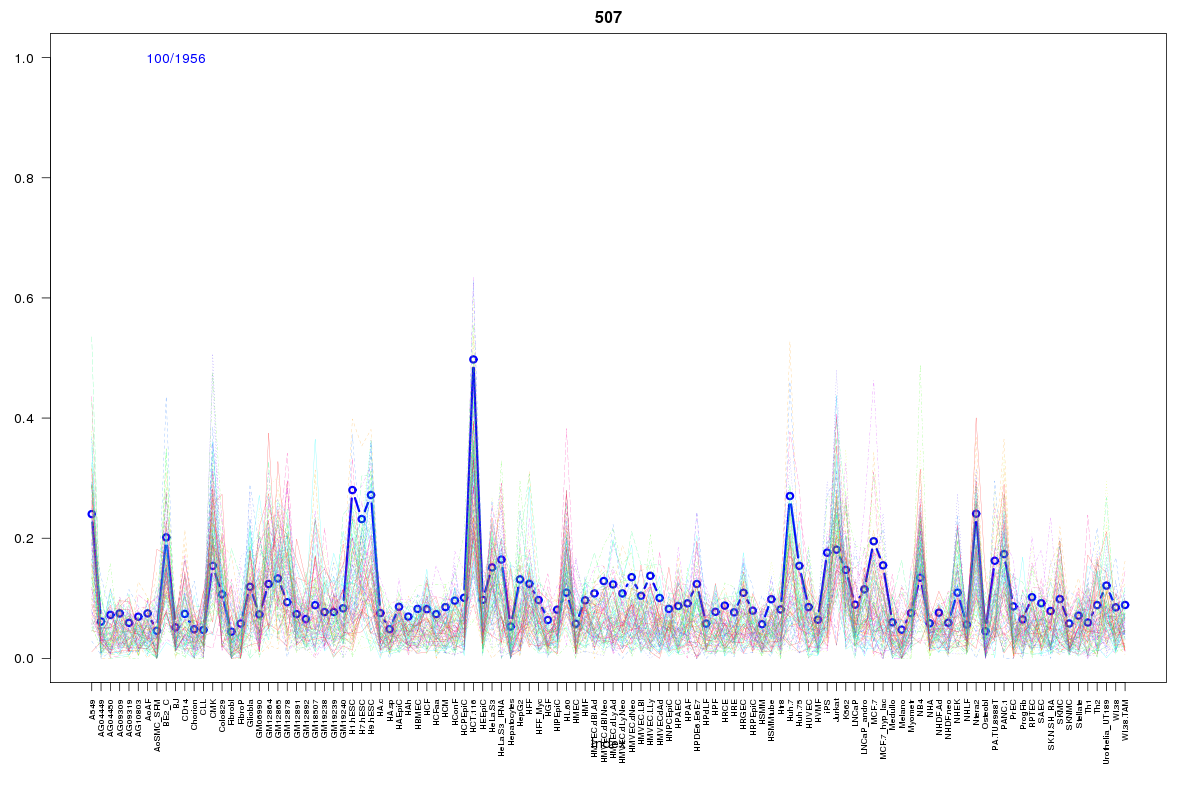 | 507 | 1 |
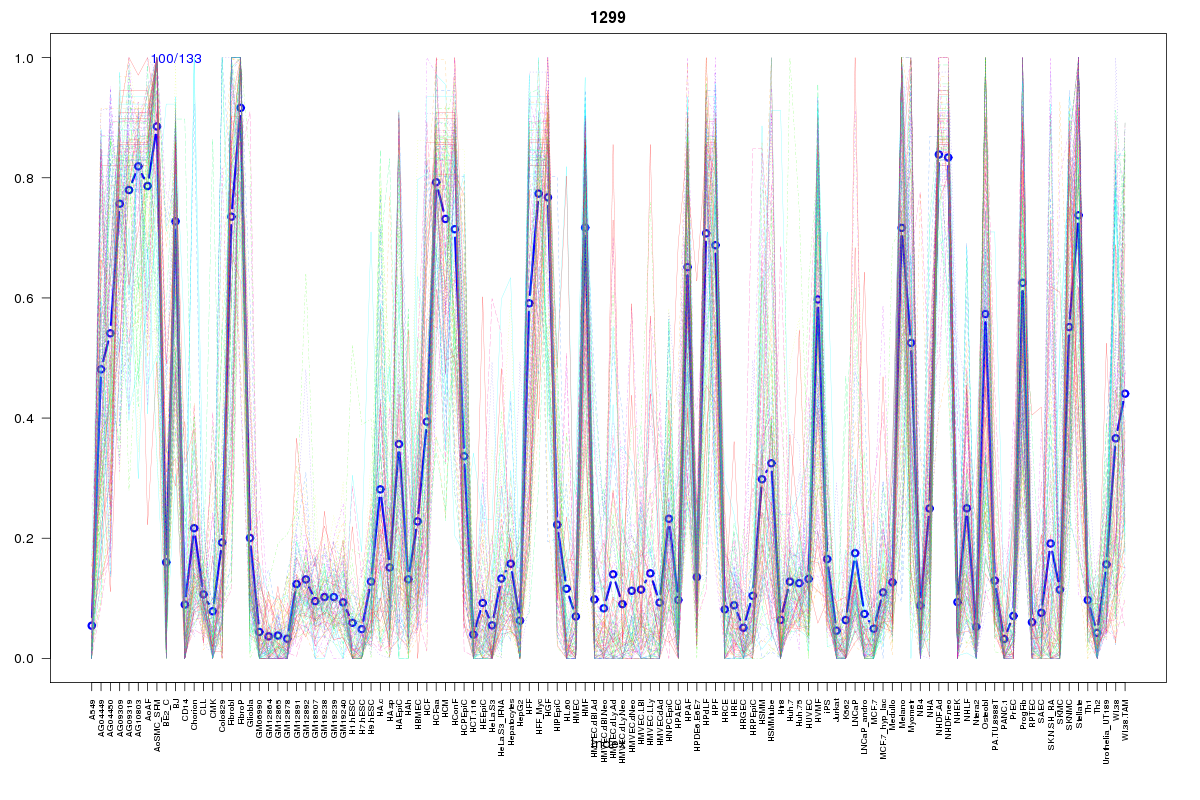 | 1299 | 1 |
 | 1011 | 1 |
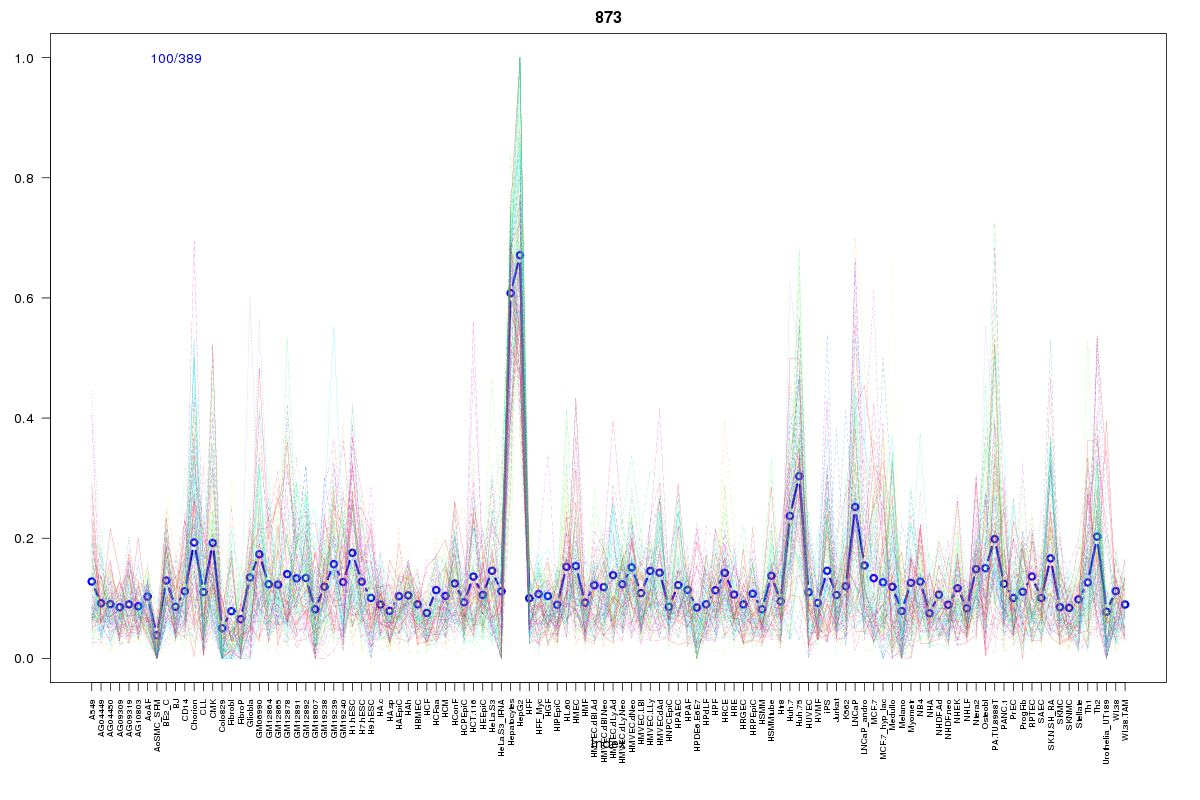 | 873 | 1 |
 | 1058 | 1 |
Resources
BED file downloads
Connects to 23 DHS sitesTop 10 Correlated DHS Sites
p-values indiciate significant higher or lower correlation| Location | Cluster | P-value |
|---|---|---|
| chr1:23748340-23748490 | 1299 | 0 |
| chr1:23770740-23770890 | 1442 | 0 |
| chr1:23751685-23751835 | 2319 | 0 |
| chr1:23749925-23750075 | 1011 | 0.003 |
| chr1:23721280-23721430 | 1295 | 0.003 |
| chr1:23801940-23802090 | 1344 | 0.004 |
| chr1:23751160-23751310 | 1058 | 0.004 |
| chr1:23805640-23805790 | 1514 | 0.004 |
| chr1:23805485-23805635 | 913 | 0.006 |
| chr1:23802260-23802410 | 361 | 0.006 |
| chr1:23770565-23770715 | 1562 | 0.007 |
External Databases
UCSCEnsembl (ENSG00000204219)