Gene: PSORS1C3
chr6: 31141511-31145676Expression Profile
(log scale)
Graphical Connections
Distribution of linked clusters:
You may find it interesting if many of the connected DHS sites belong to the same cluster.| Cluster Profile | Cluster ID | Number of DHS sites in this cluster |
|---|---|---|
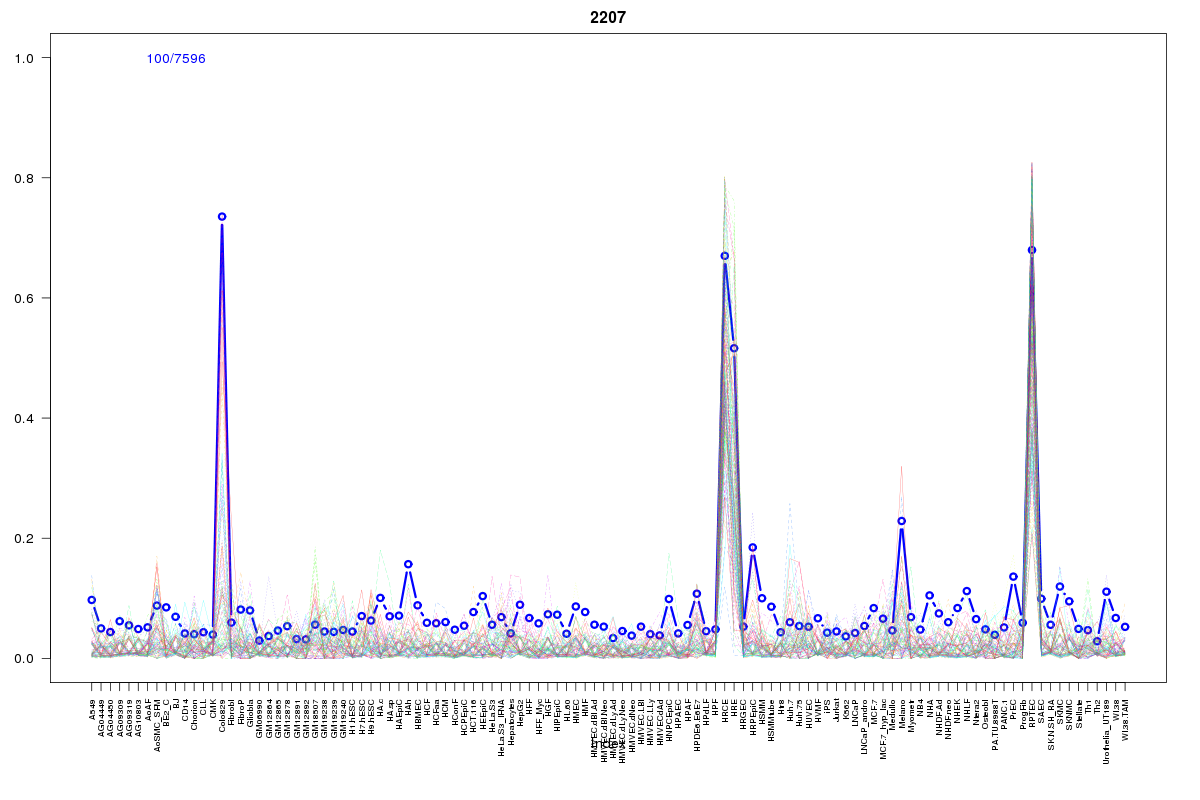 | 2207 | 2 |
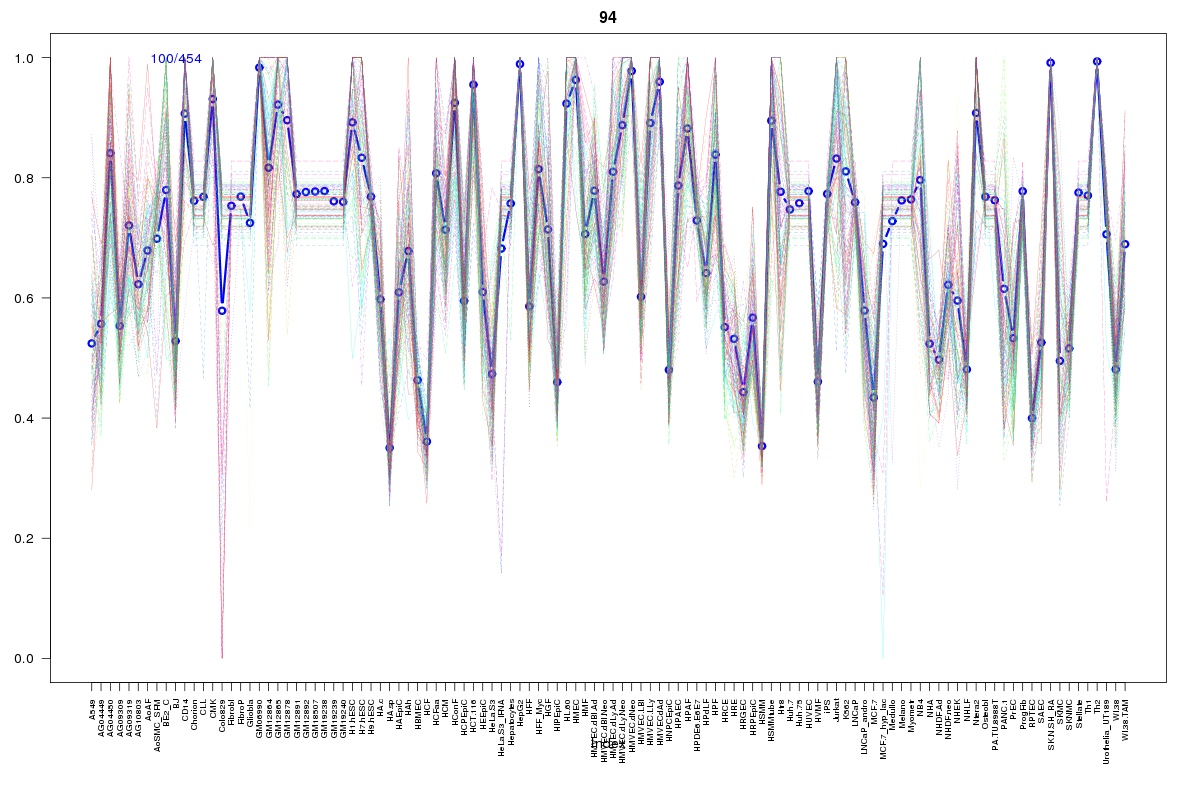 | 94 | 1 |
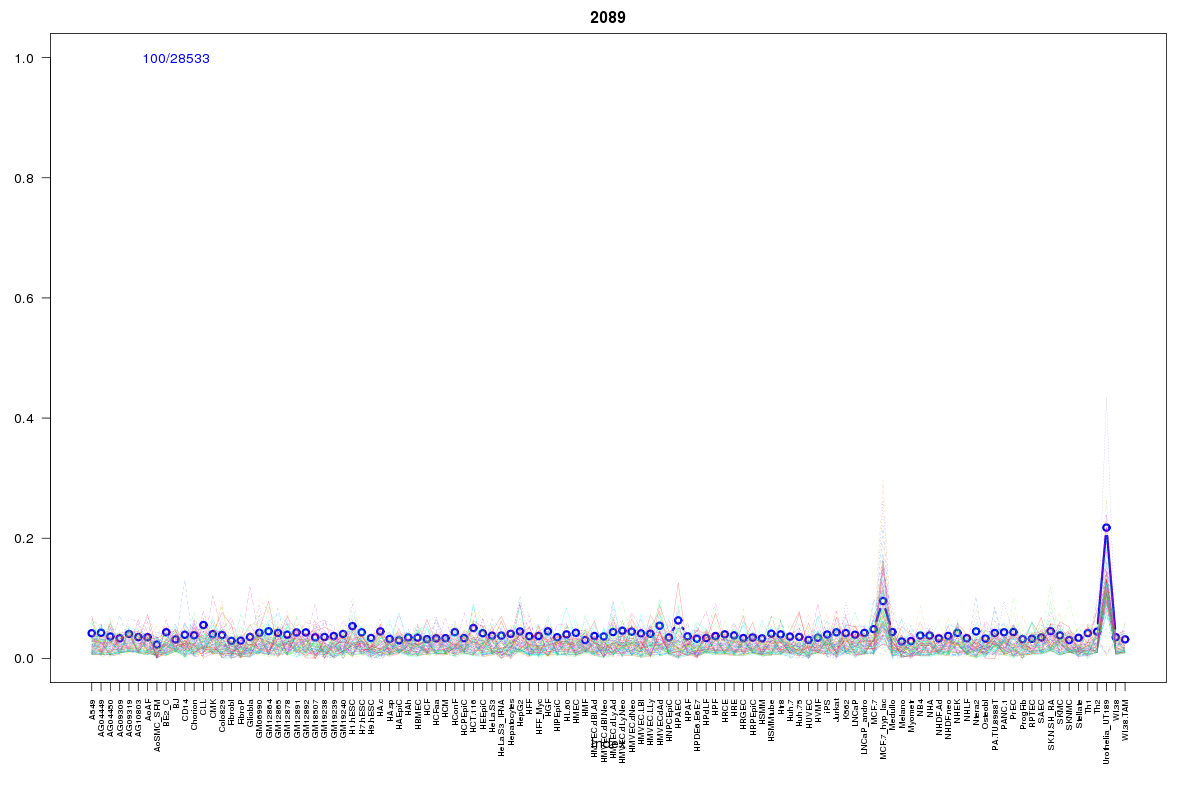 | 2089 | 1 |
 | 2211 | 1 |
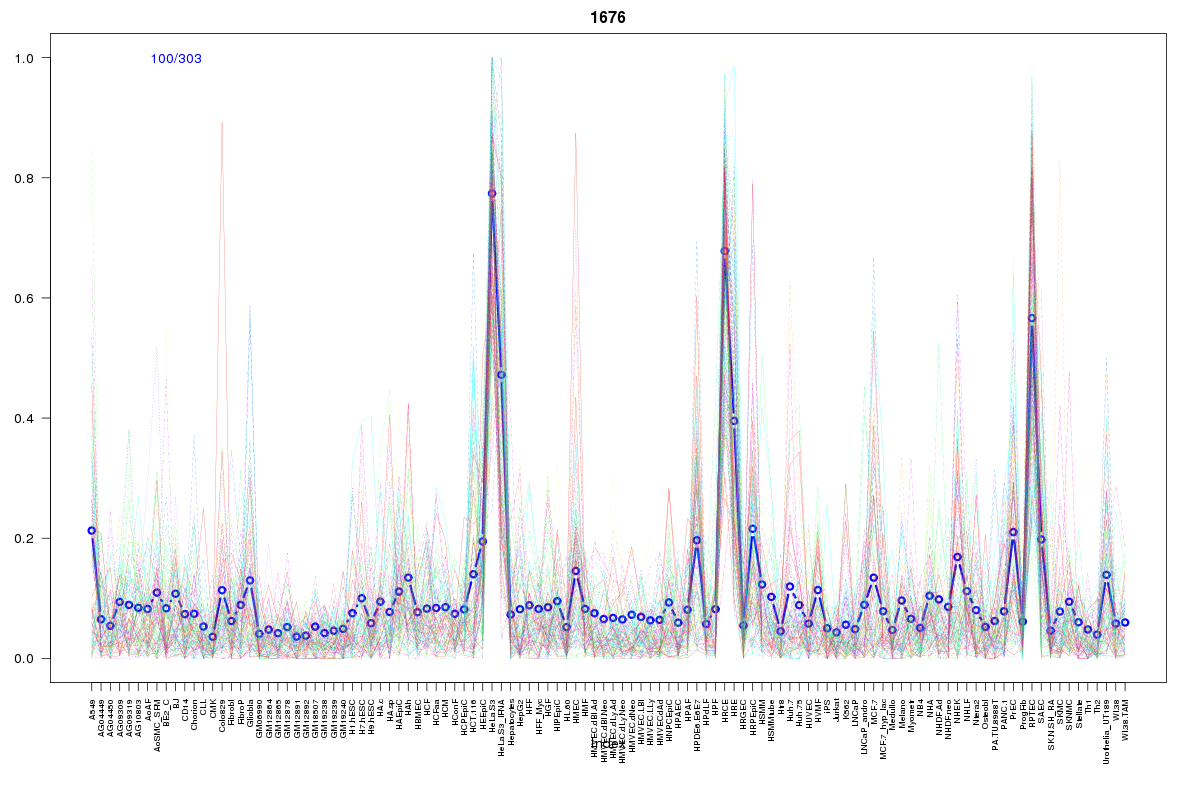 | 1676 | 1 |
 | 1420 | 1 |
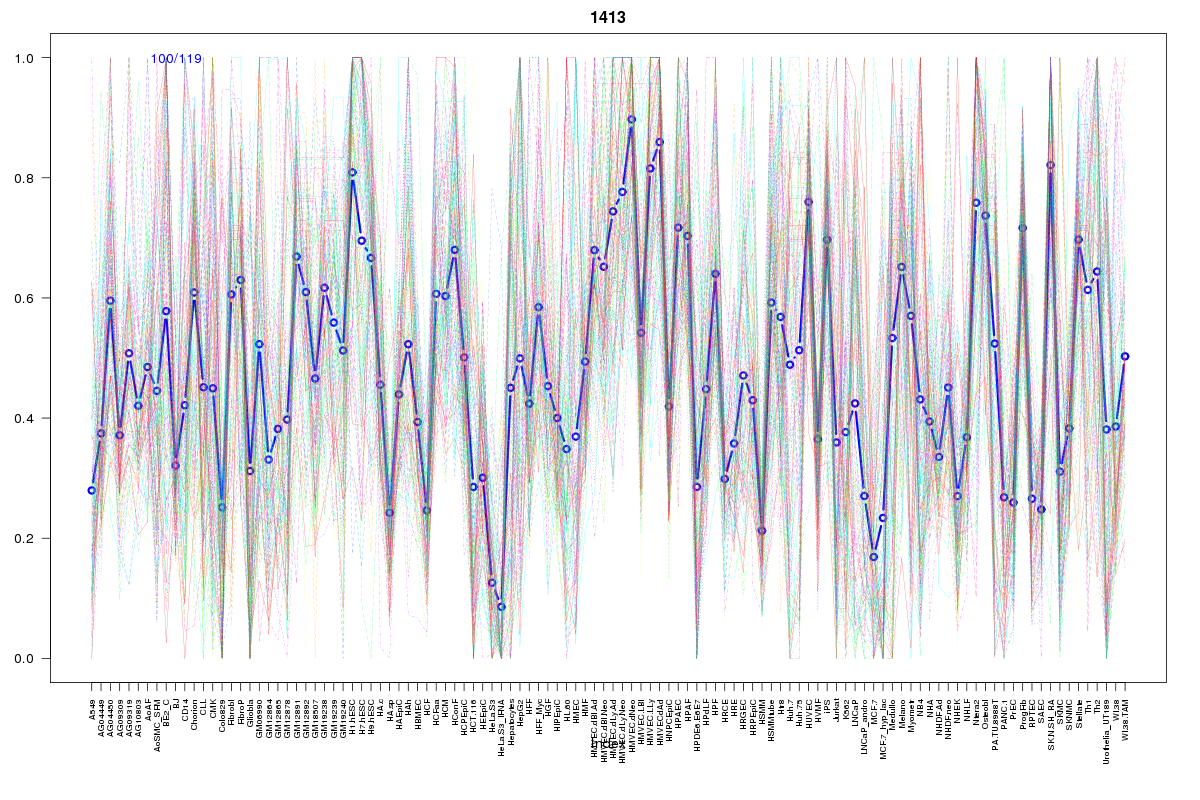 | 1413 | 1 |
 | 1605 | 1 |
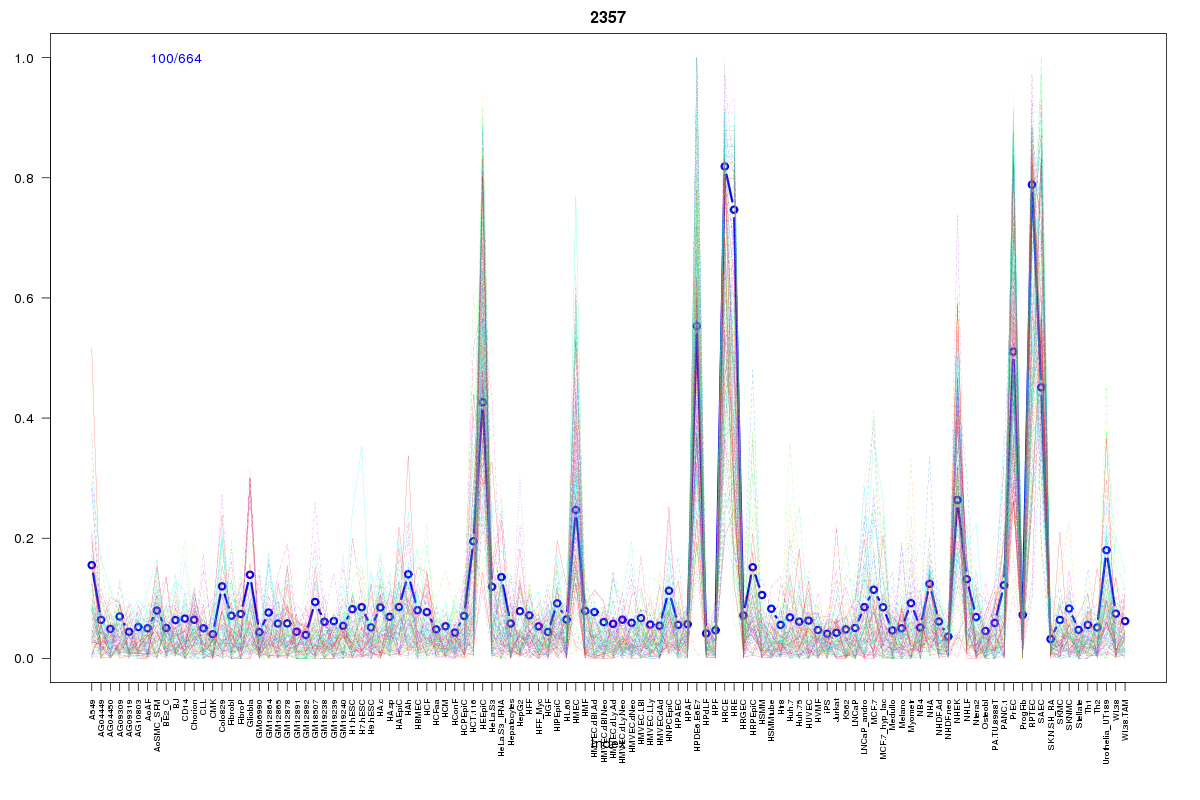 | 2357 | 1 |
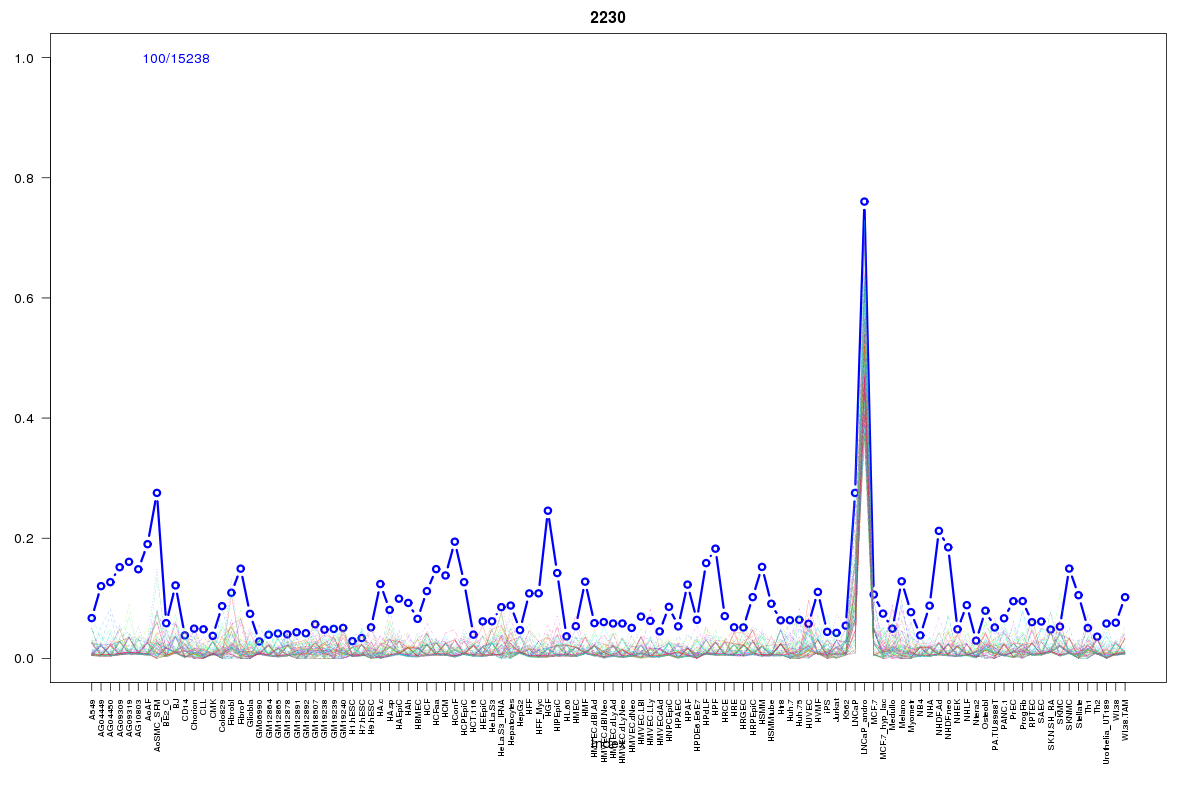 | 2230 | 1 |
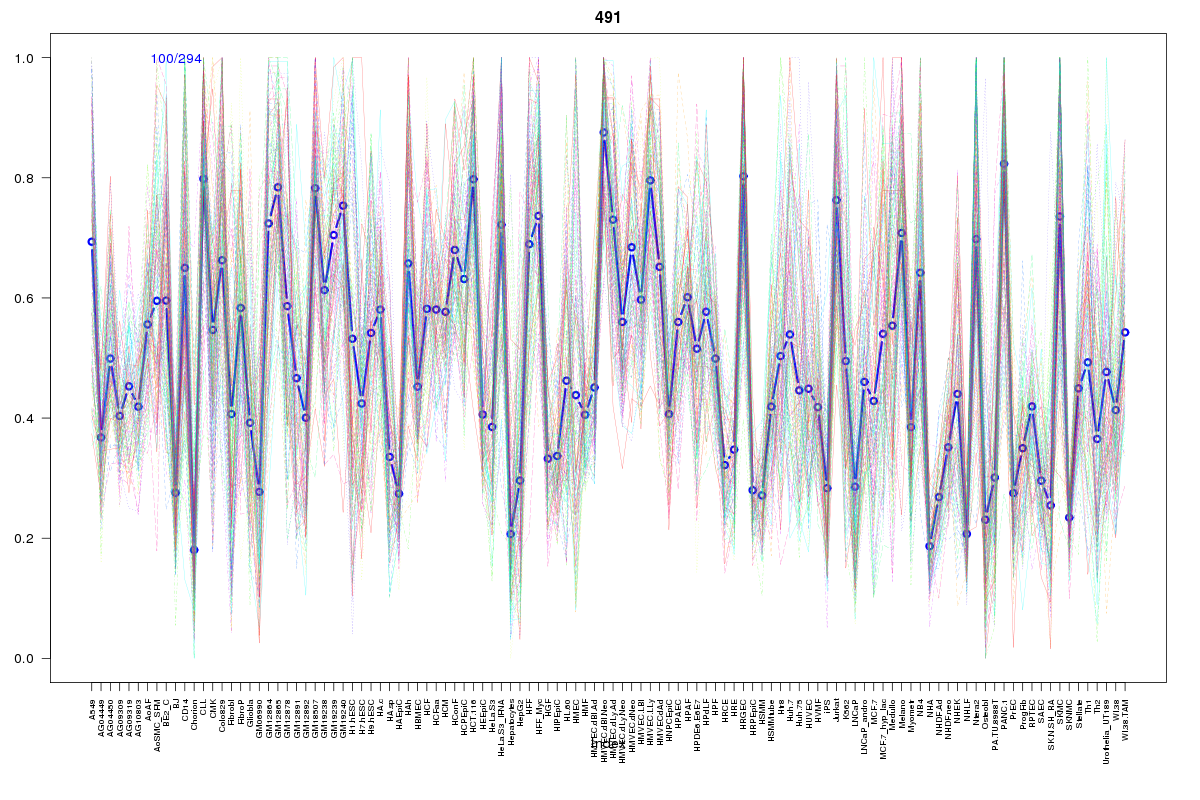 | 491 | 1 |
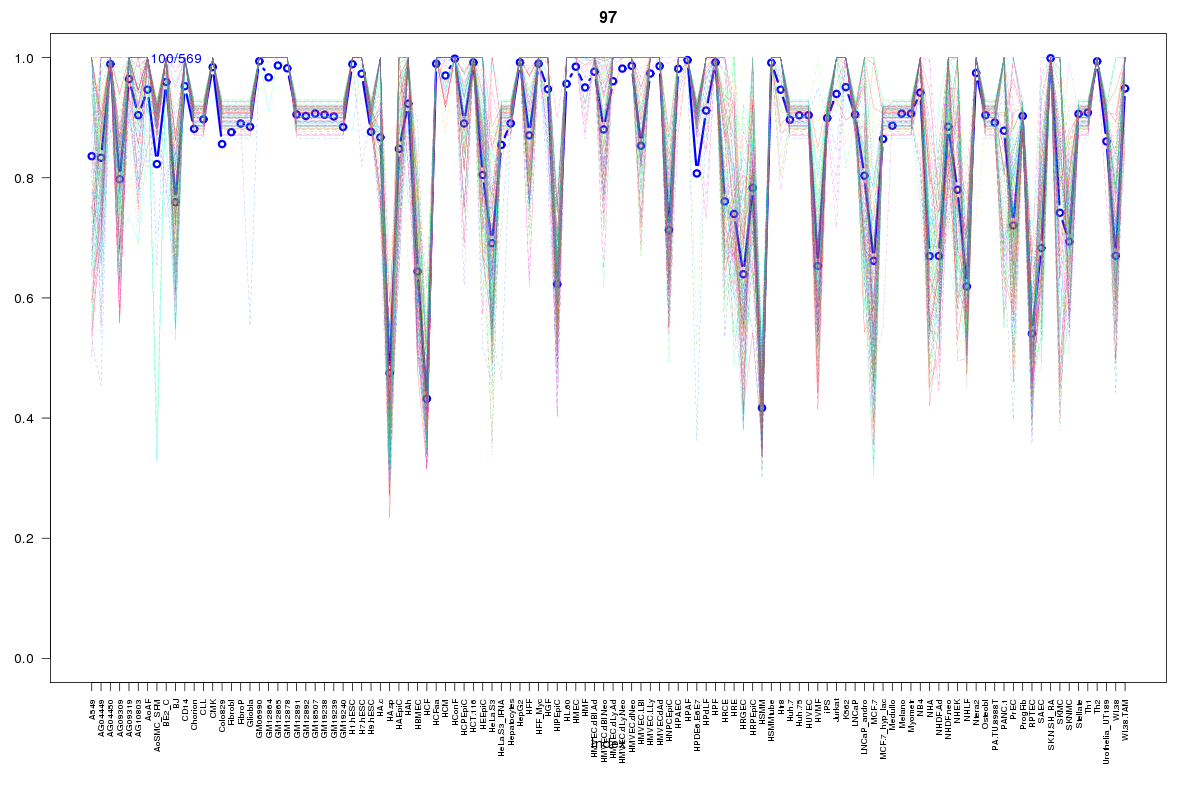 | 97 | 1 |
 | 1636 | 1 |
 | 421 | 1 |
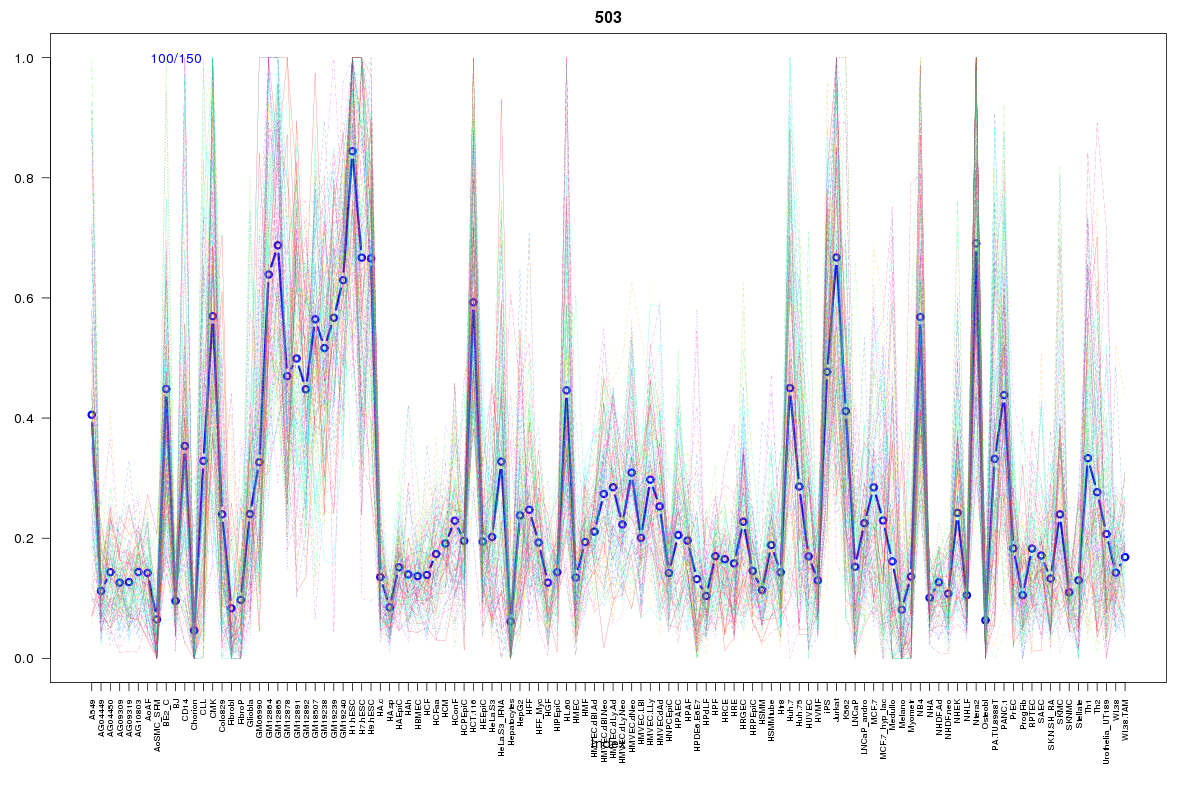 | 503 | 1 |
 | 2489 | 1 |
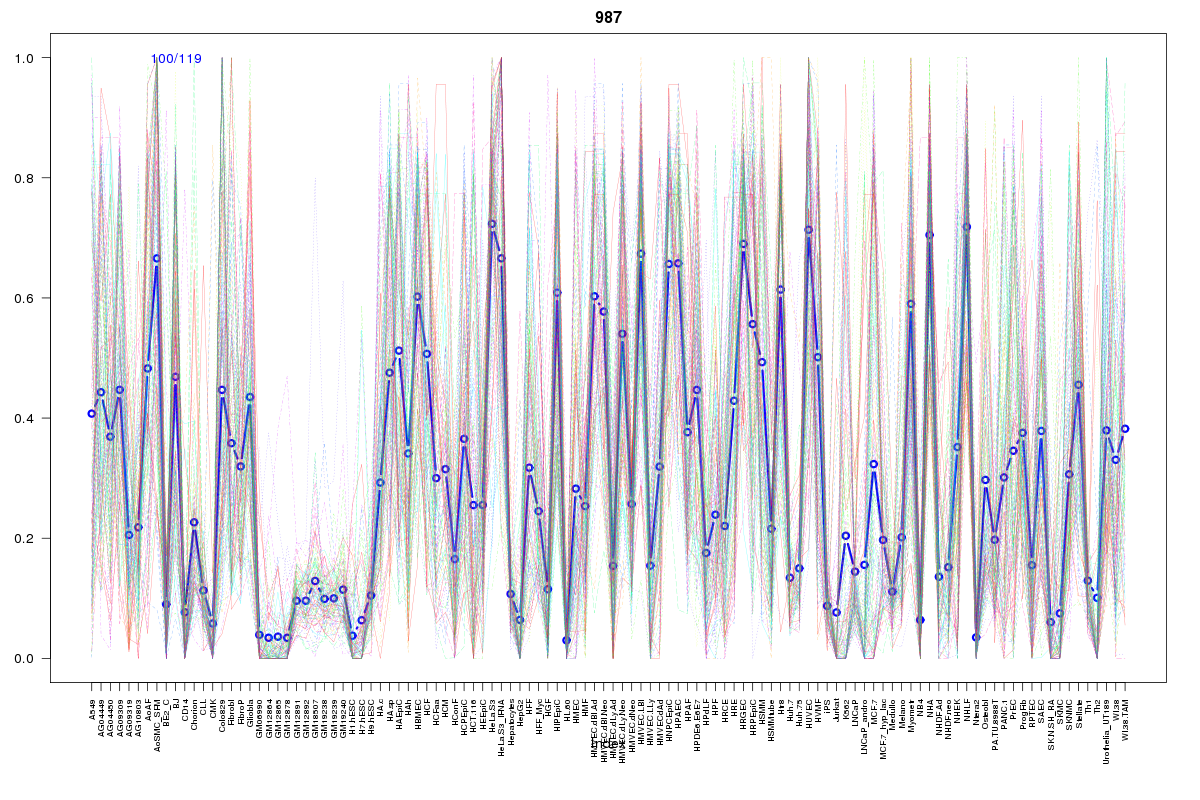 | 987 | 1 |
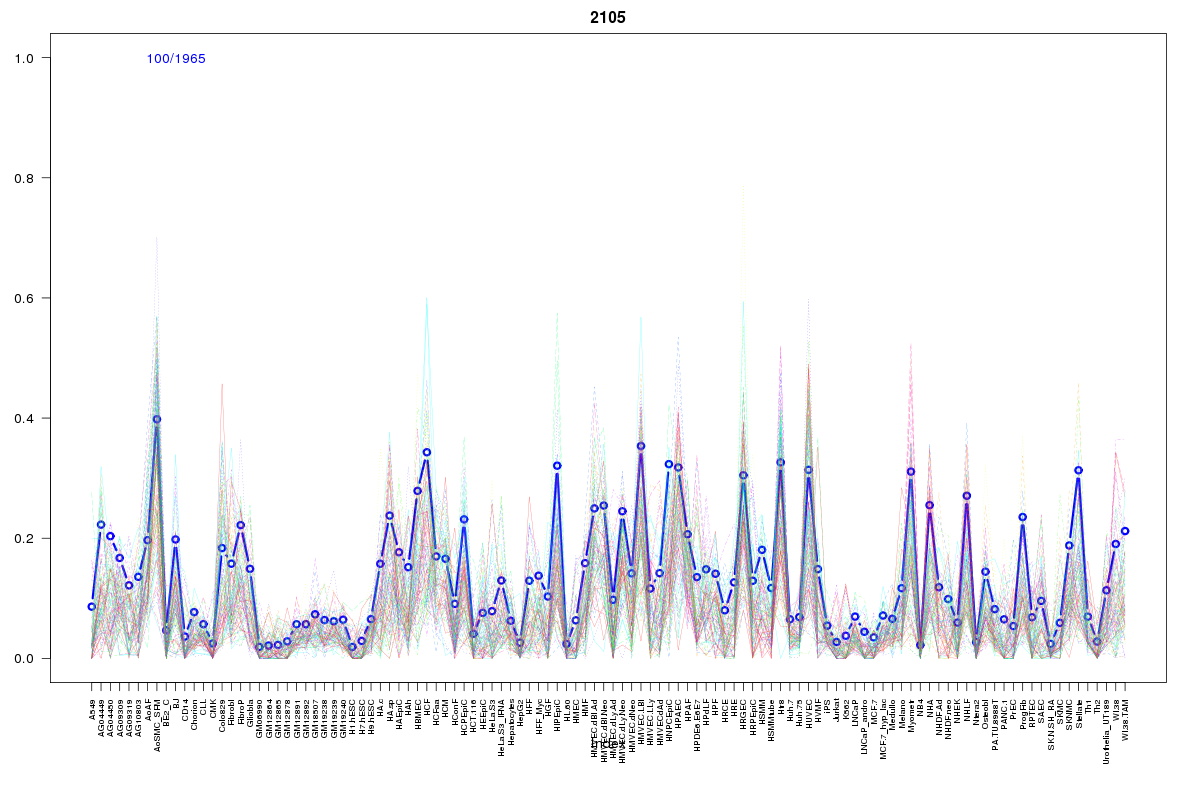 | 2105 | 1 |
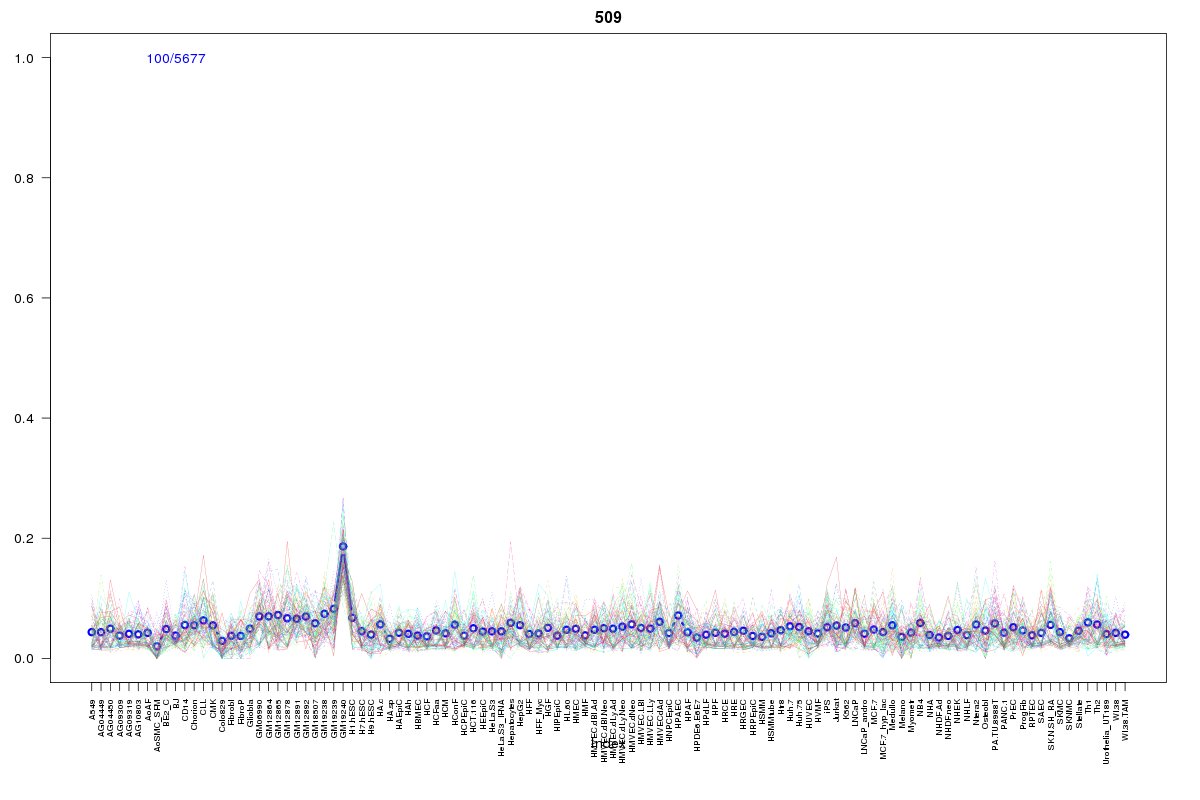 | 509 | 1 |
Resources
BED file downloads
Connects to 20 DHS sitesTop 10 Correlated DHS Sites
p-values indiciate significant higher or lower correlation| Location | Cluster | P-value |
|---|---|---|
| chr6:31151145-31151295 | 1605 | 0 |
| chr6:31120680-31120830 | 2207 | 0.005 |
| chr6:31154240-31154390 | 2207 | 0.007 |
| chr6:31131860-31132010 | 1676 | 0.008 |
| chr6:31153880-31154030 | 2357 | 0.012 |
| chr6:31155660-31155810 | 2230 | 0.013 |
| chr6:31124545-31124695 | 2089 | 0.013 |
| chr6:31077805-31077955 | 509 | 0.015 |
| chr6:31131705-31131855 | 2211 | 0.017 |
| chr6:31171065-31171215 | 2489 | 0.021 |
| chr6:31047660-31047810 | 491 | 0.022 |
External Databases
UCSCEnsembl (ENSG00000204528)