Gene: ITGA1
chr5: 52083729-52255040Expression Profile
(log scale)
Graphical Connections
Distribution of linked clusters:
You may find it interesting if many of the connected DHS sites belong to the same cluster.| Cluster Profile | Cluster ID | Number of DHS sites in this cluster |
|---|---|---|
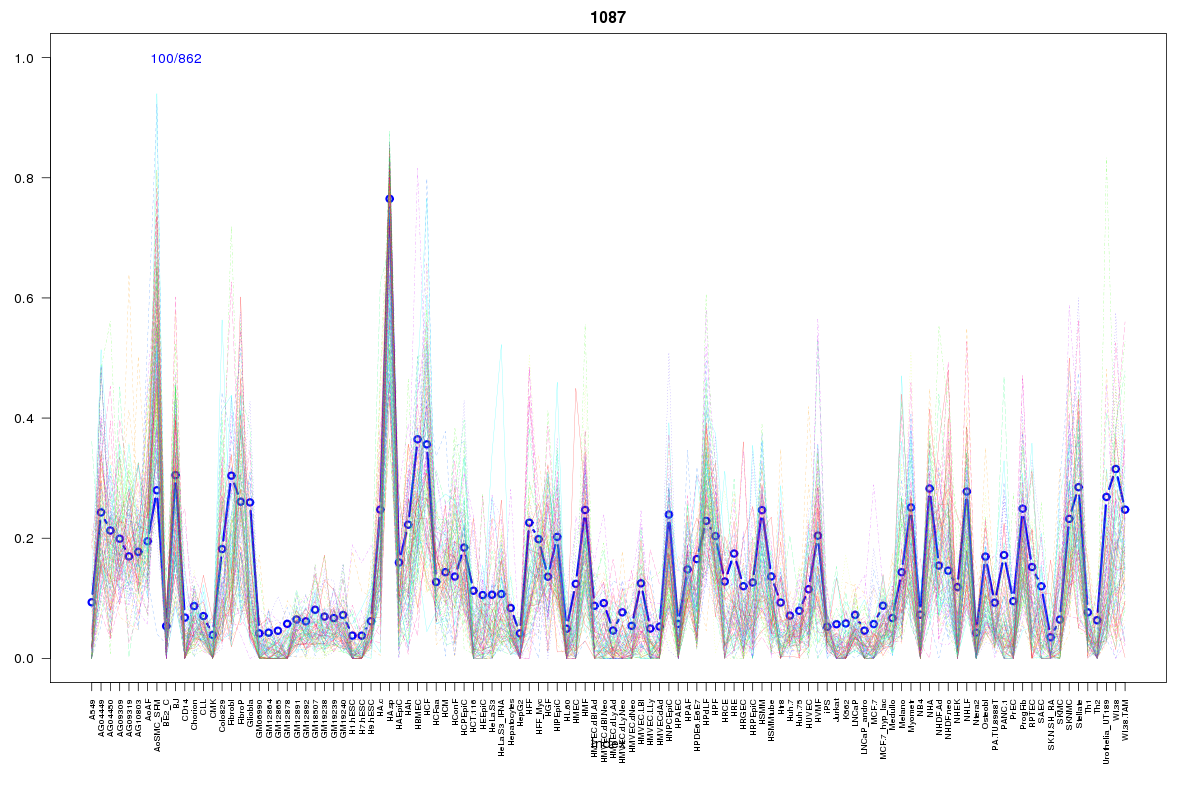 | 1087 | 3 |
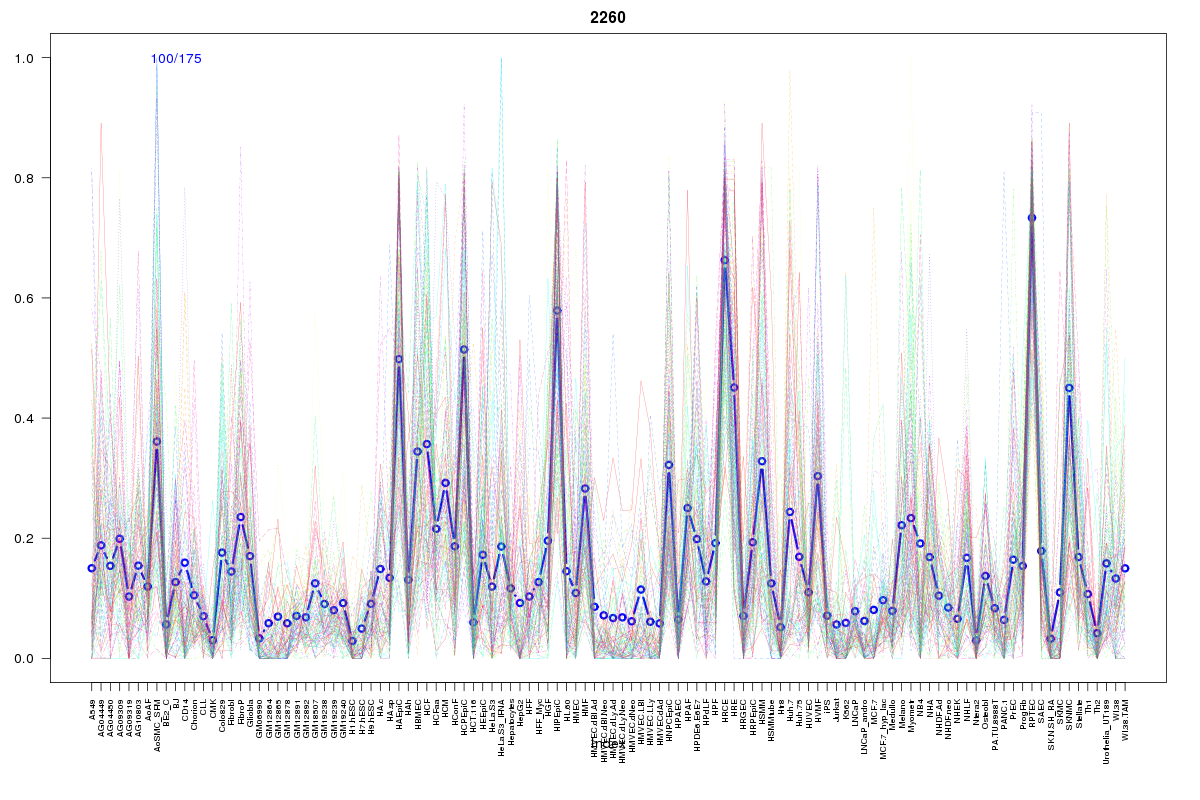 | 2260 | 2 |
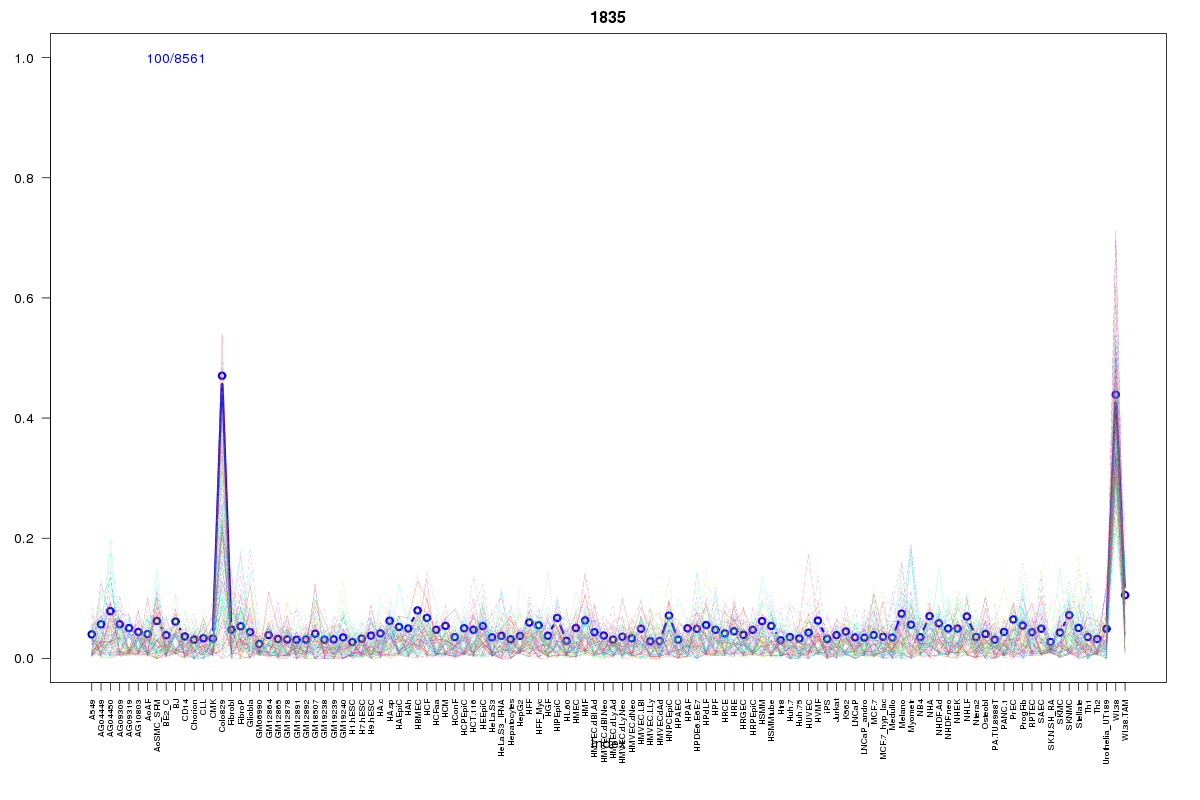 | 1835 | 2 |
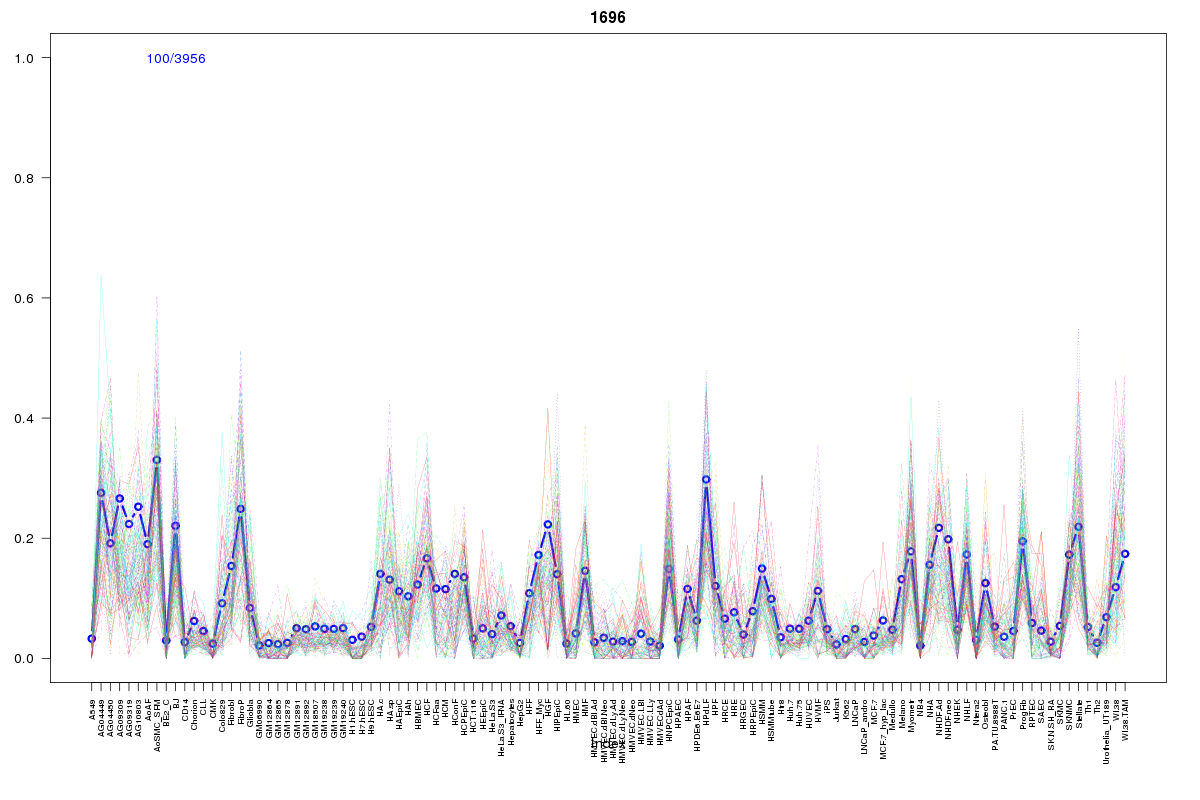 | 1696 | 2 |
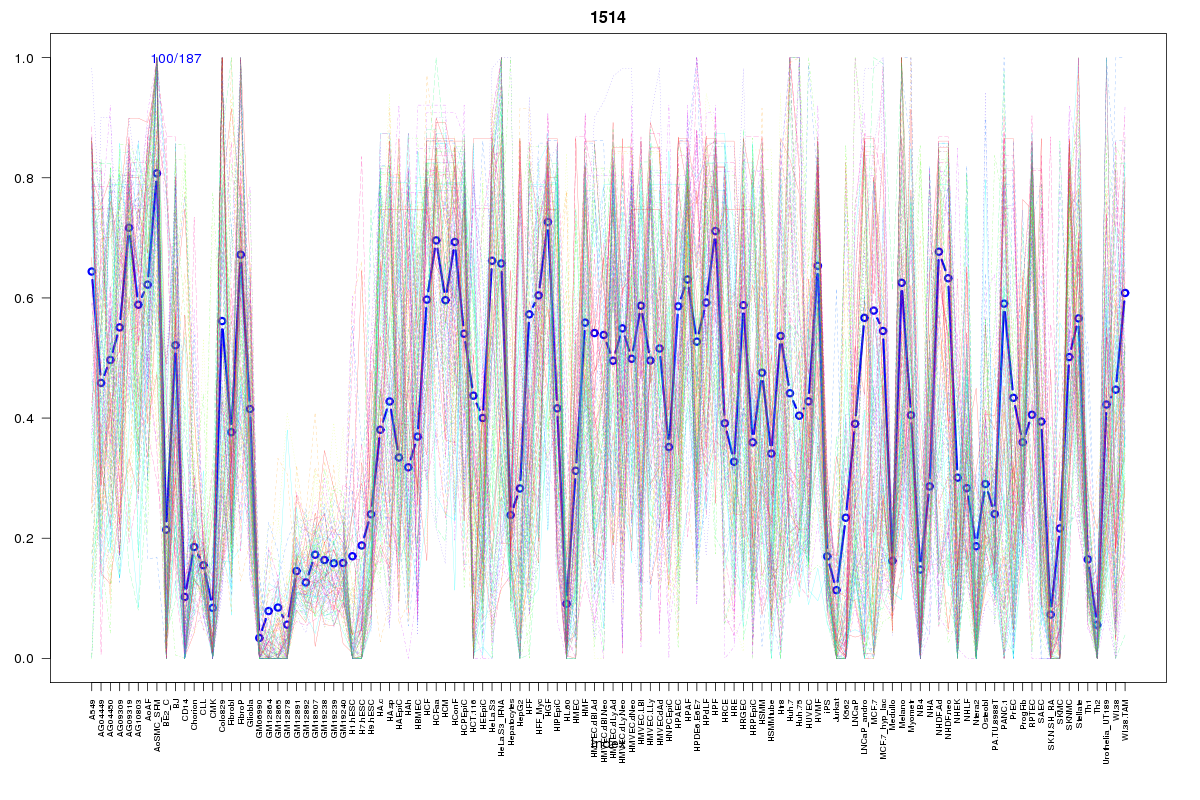 | 1514 | 1 |
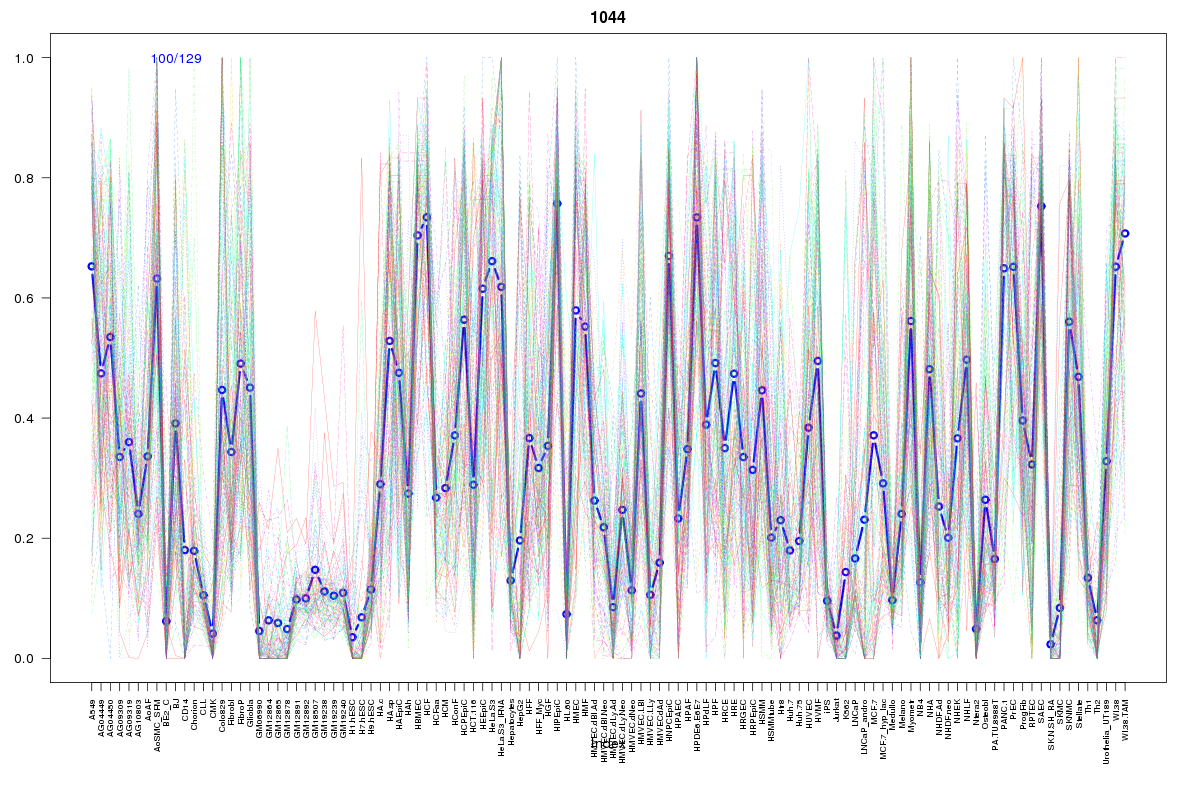 | 1044 | 1 |
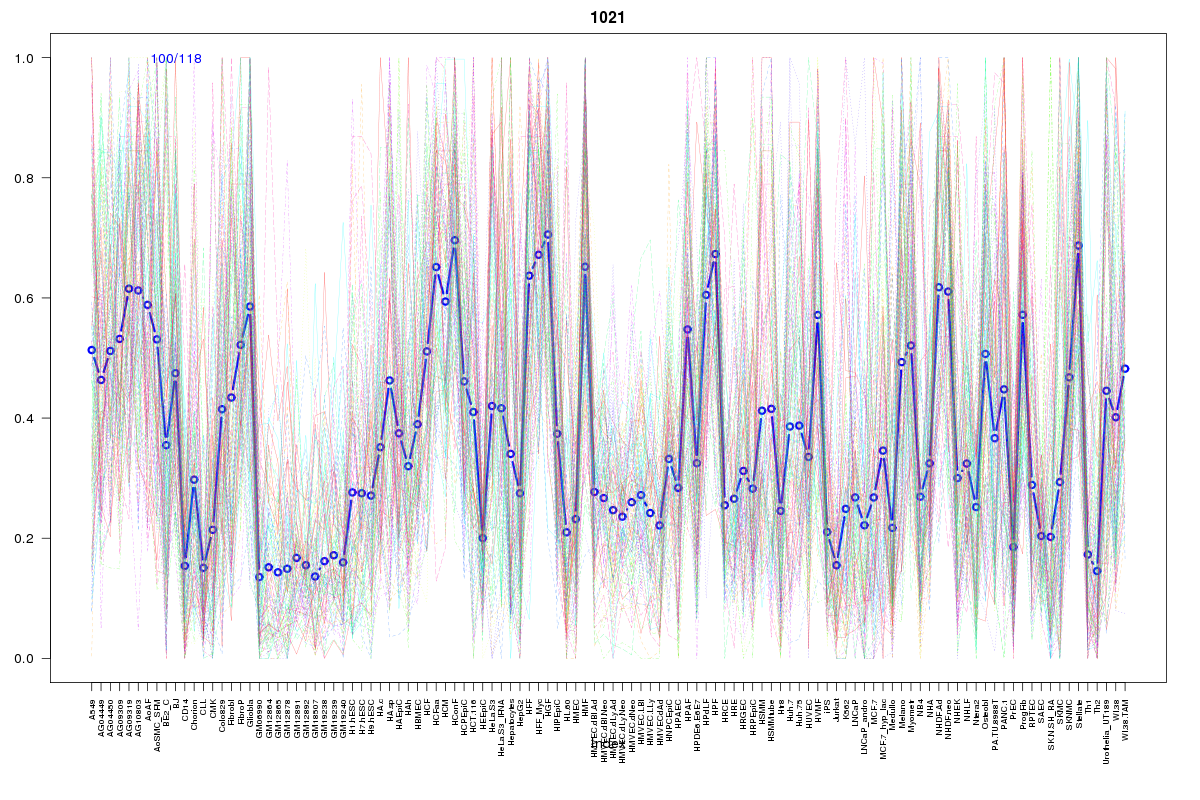 | 1021 | 1 |
 | 1242 | 1 |
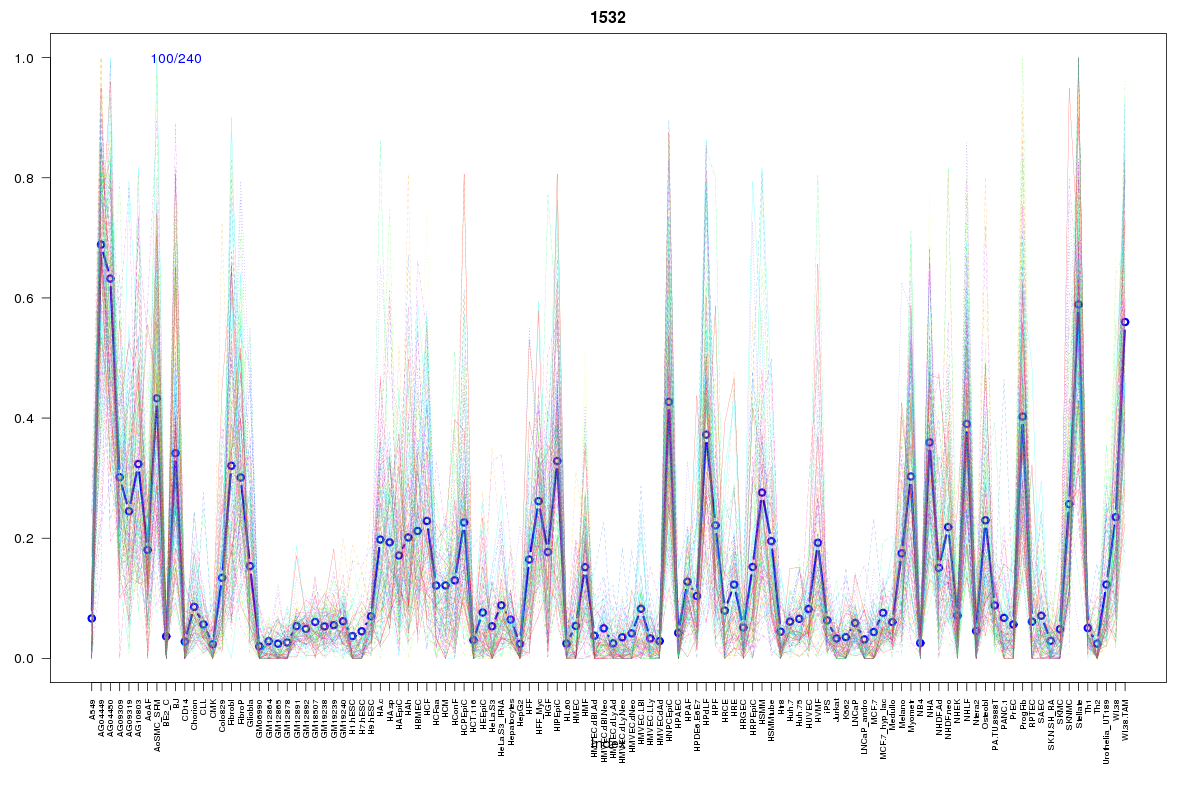 | 1532 | 1 |
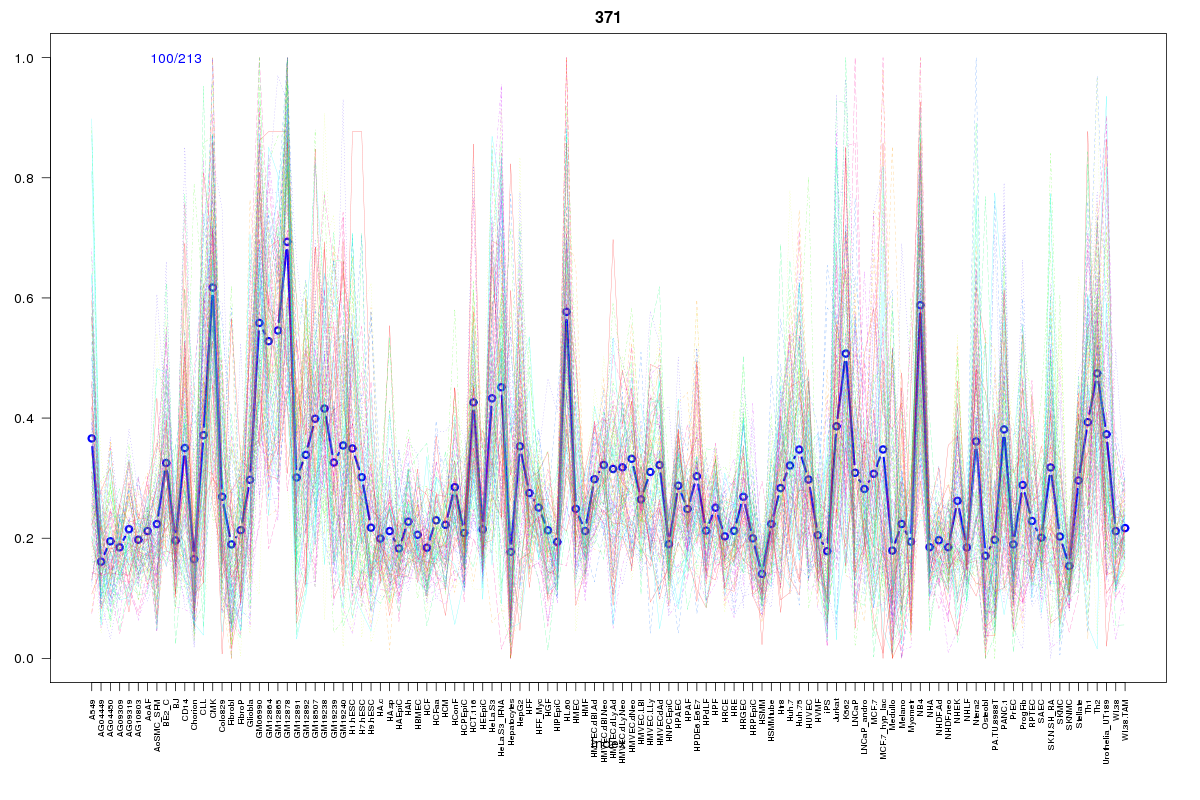 | 371 | 1 |
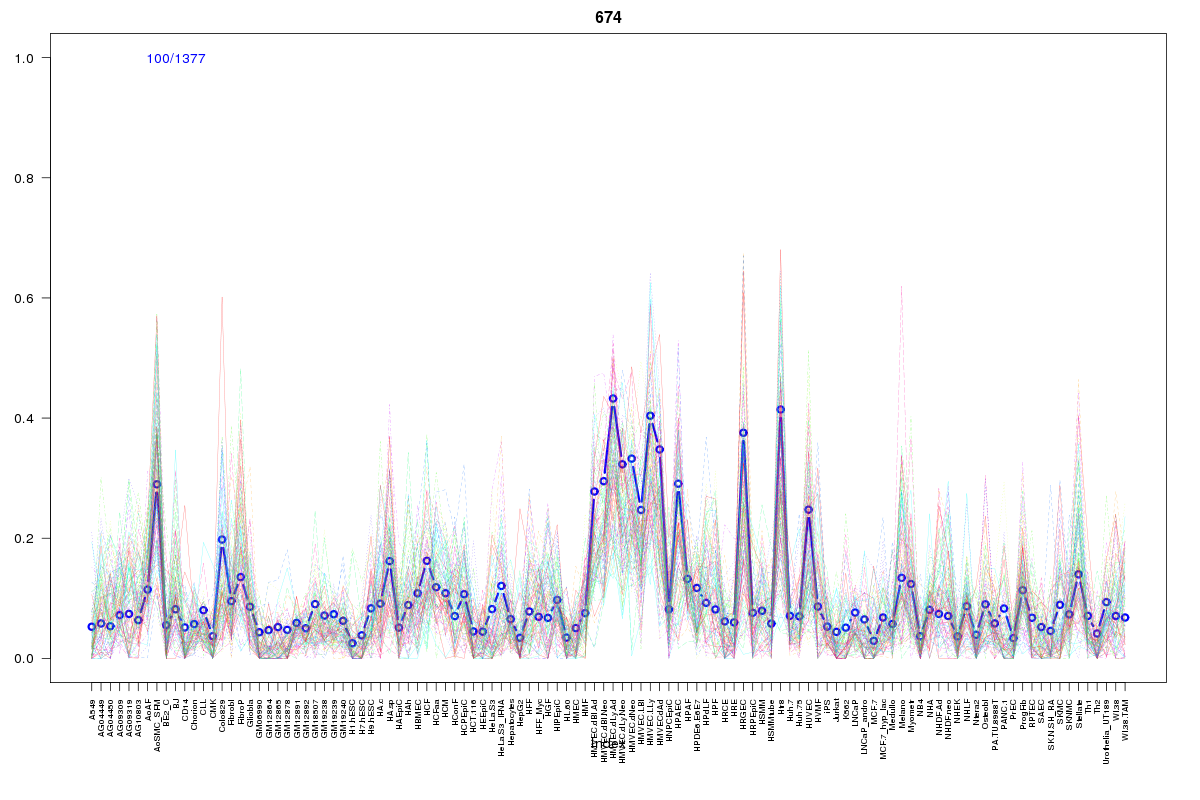 | 674 | 1 |
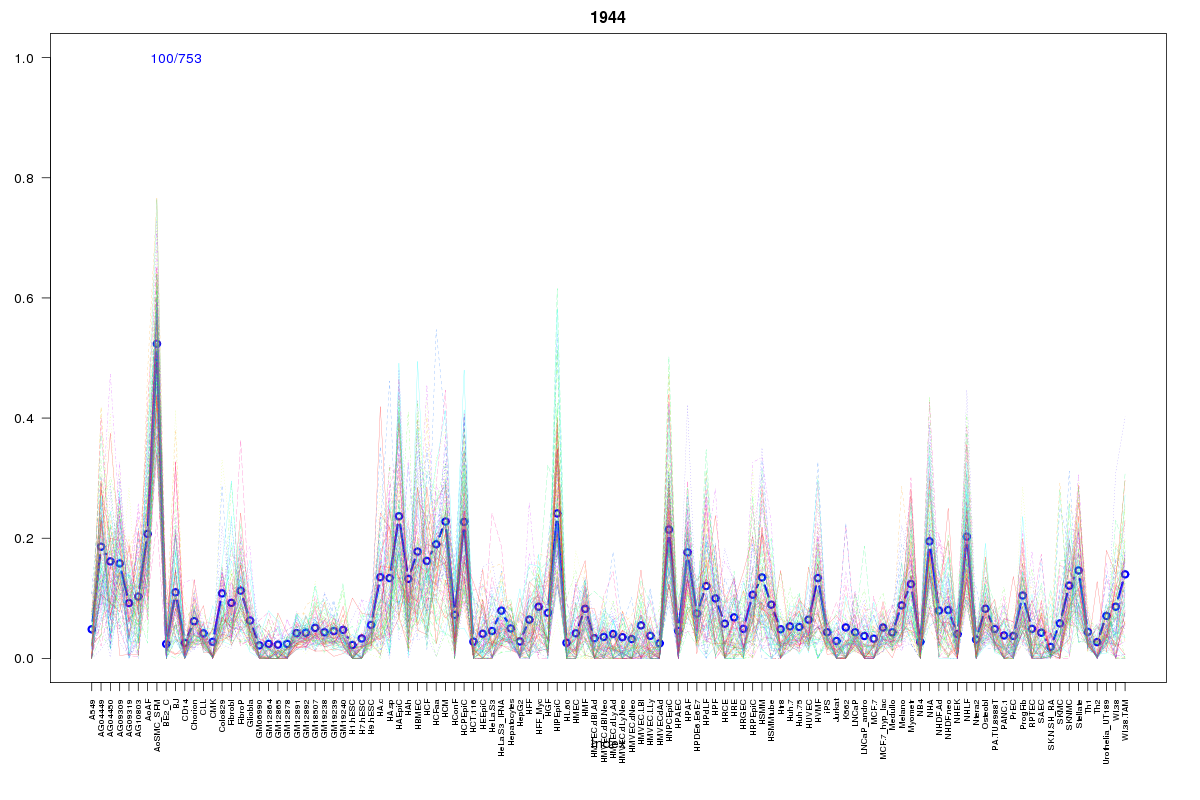 | 1944 | 1 |
 | 979 | 1 |
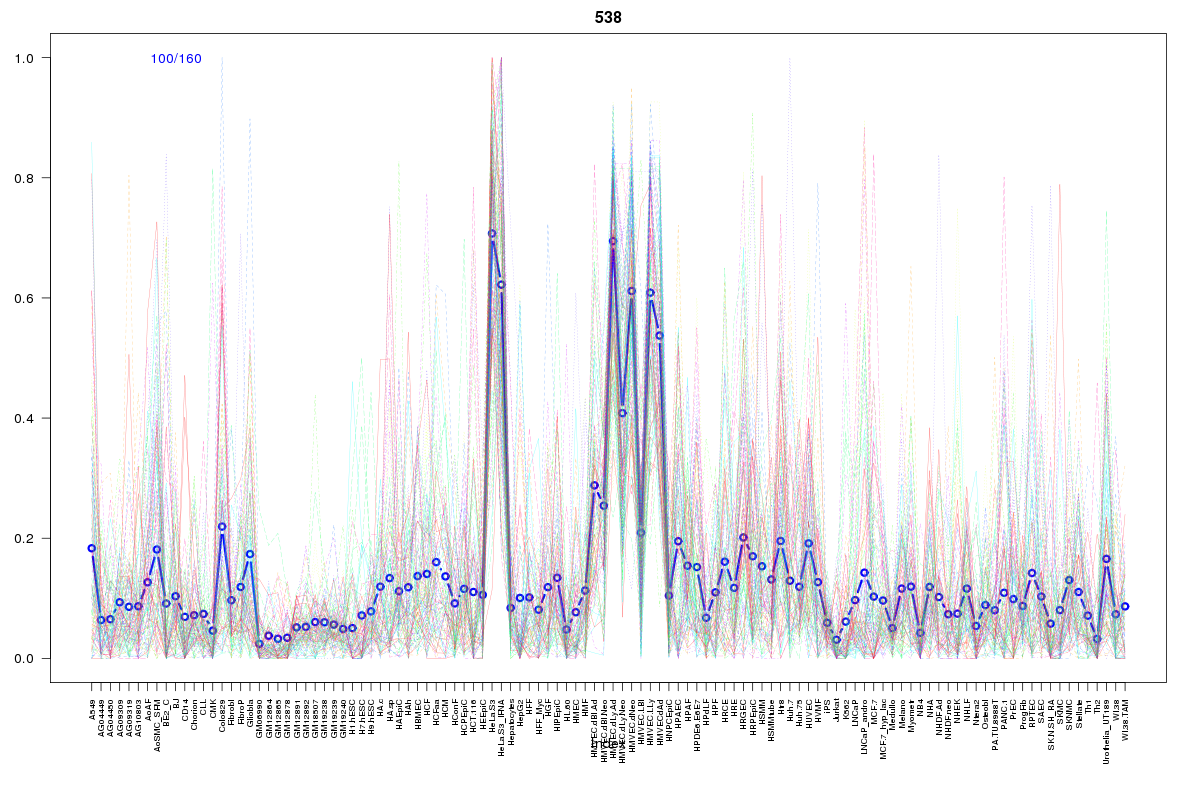 | 538 | 1 |
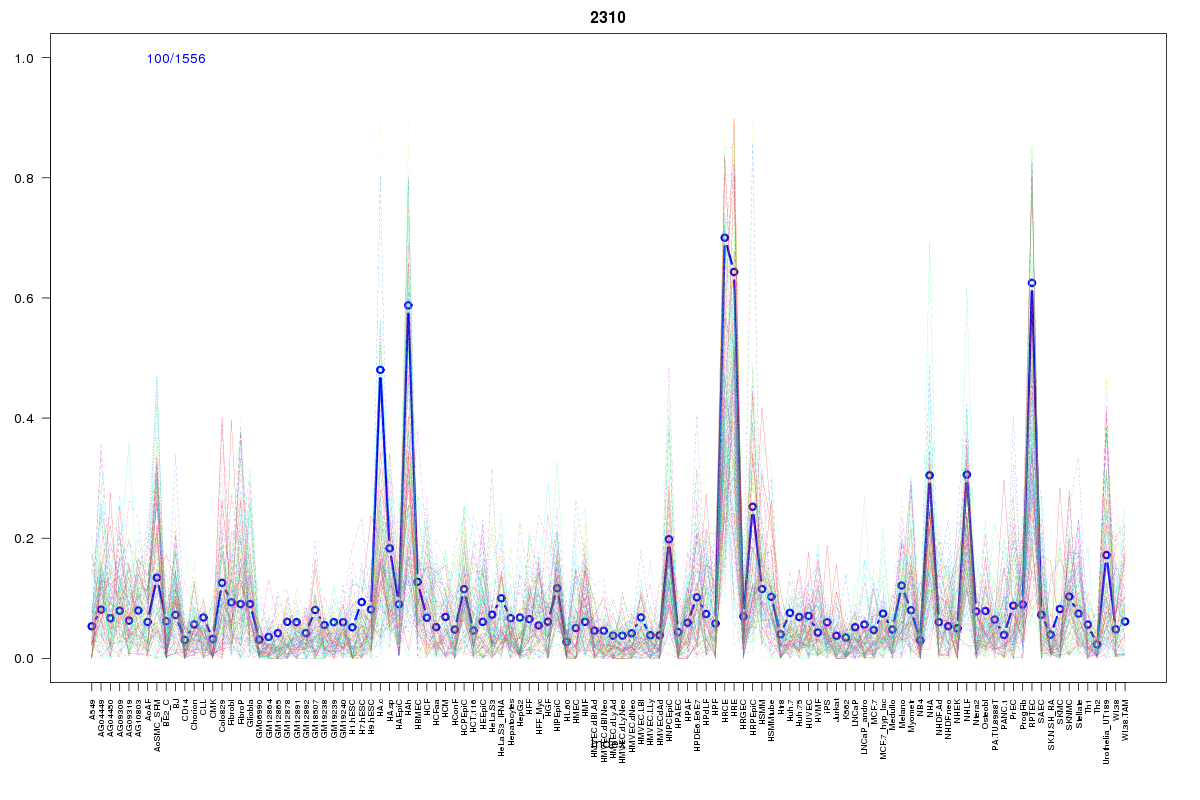 | 2310 | 1 |
 | 1738 | 1 |
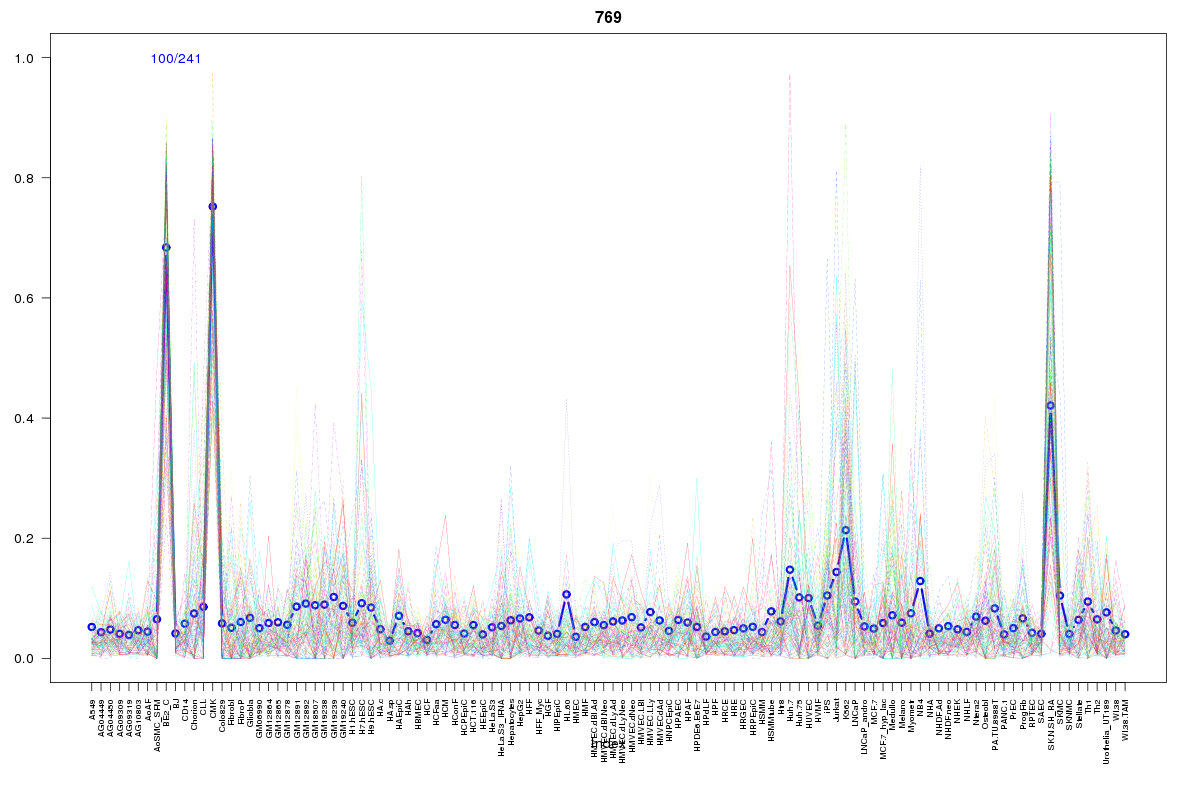 | 769 | 1 |
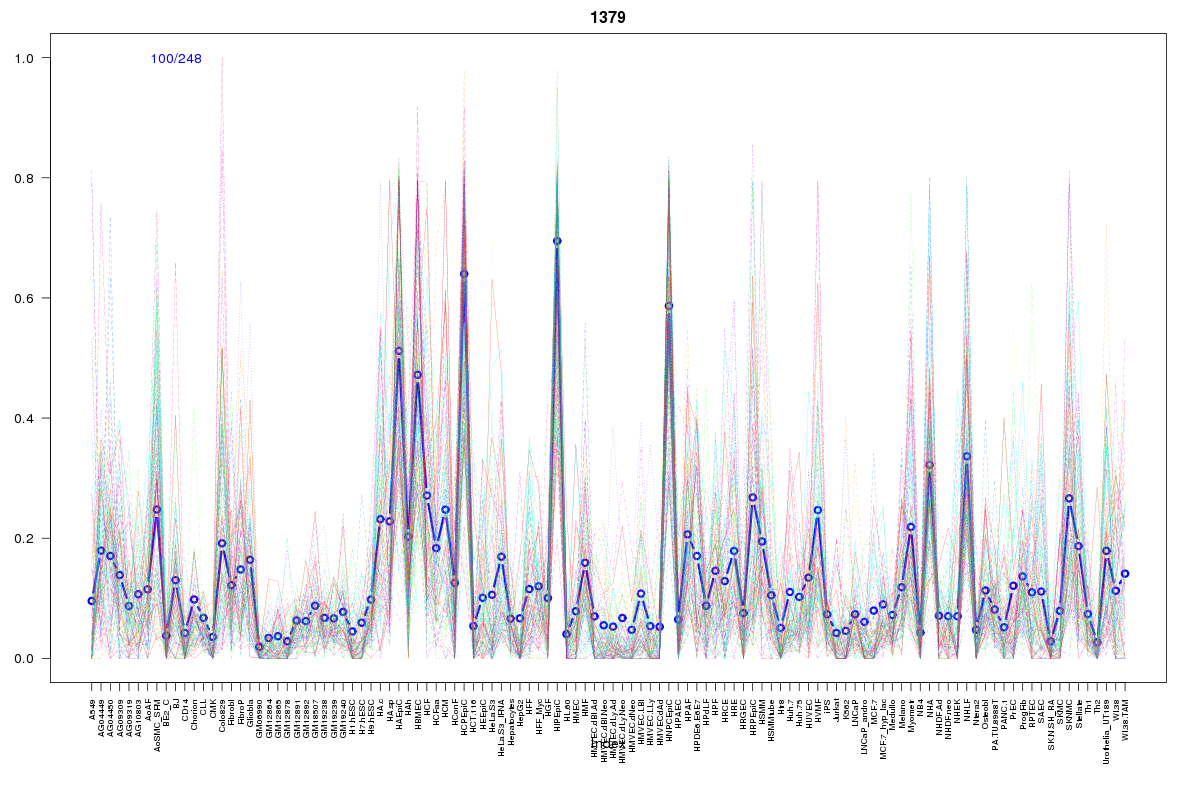 | 1379 | 1 |
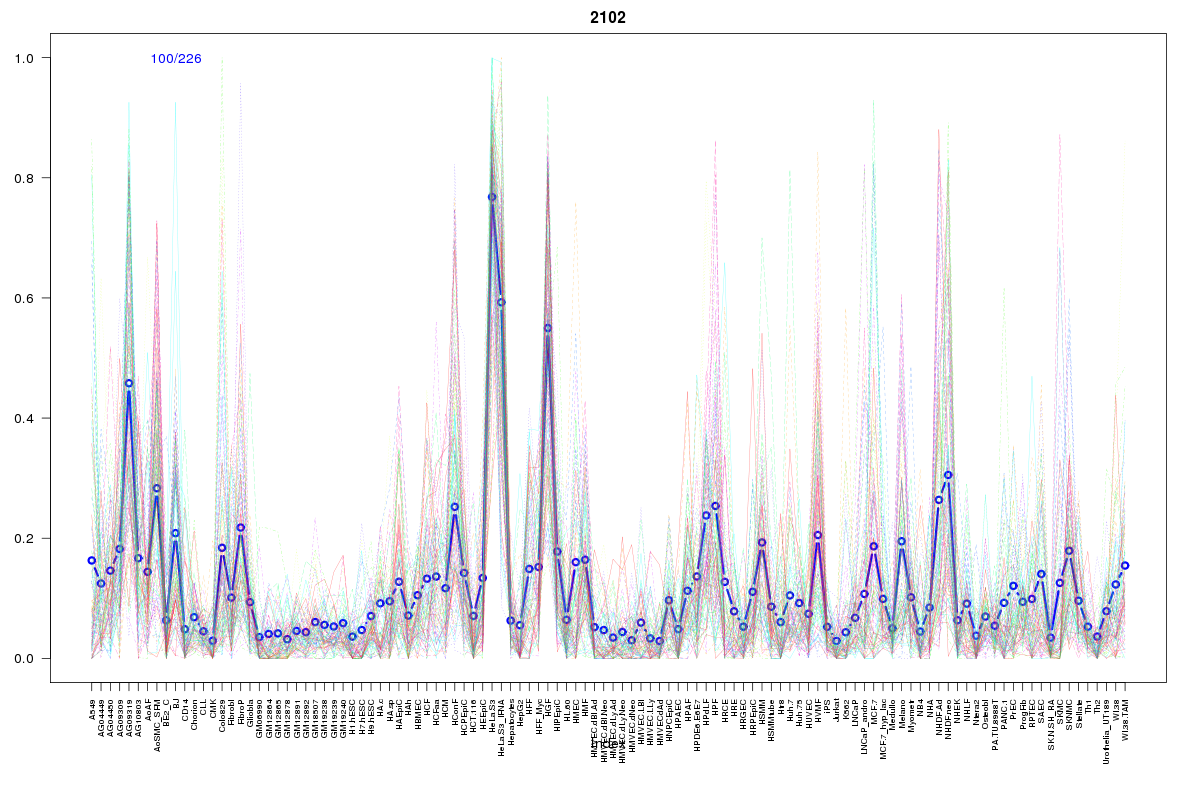 | 2102 | 1 |
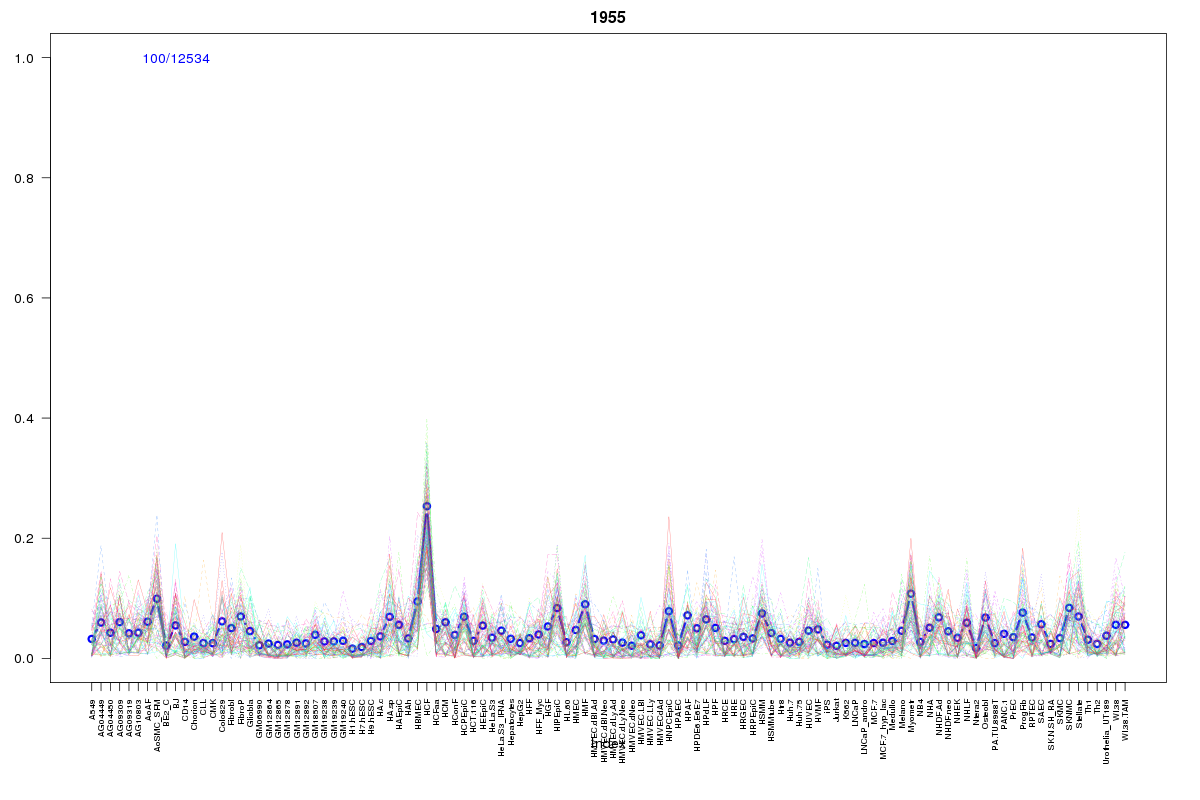 | 1955 | 1 |
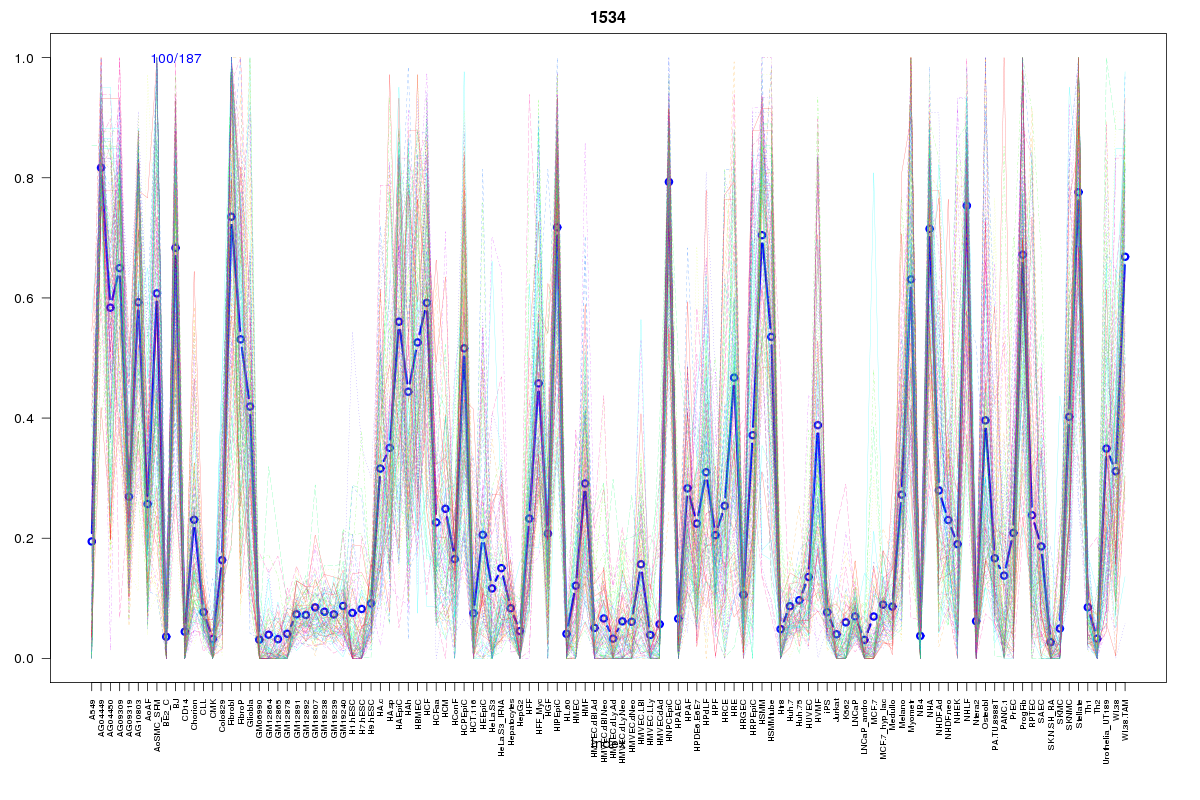 | 1534 | 1 |
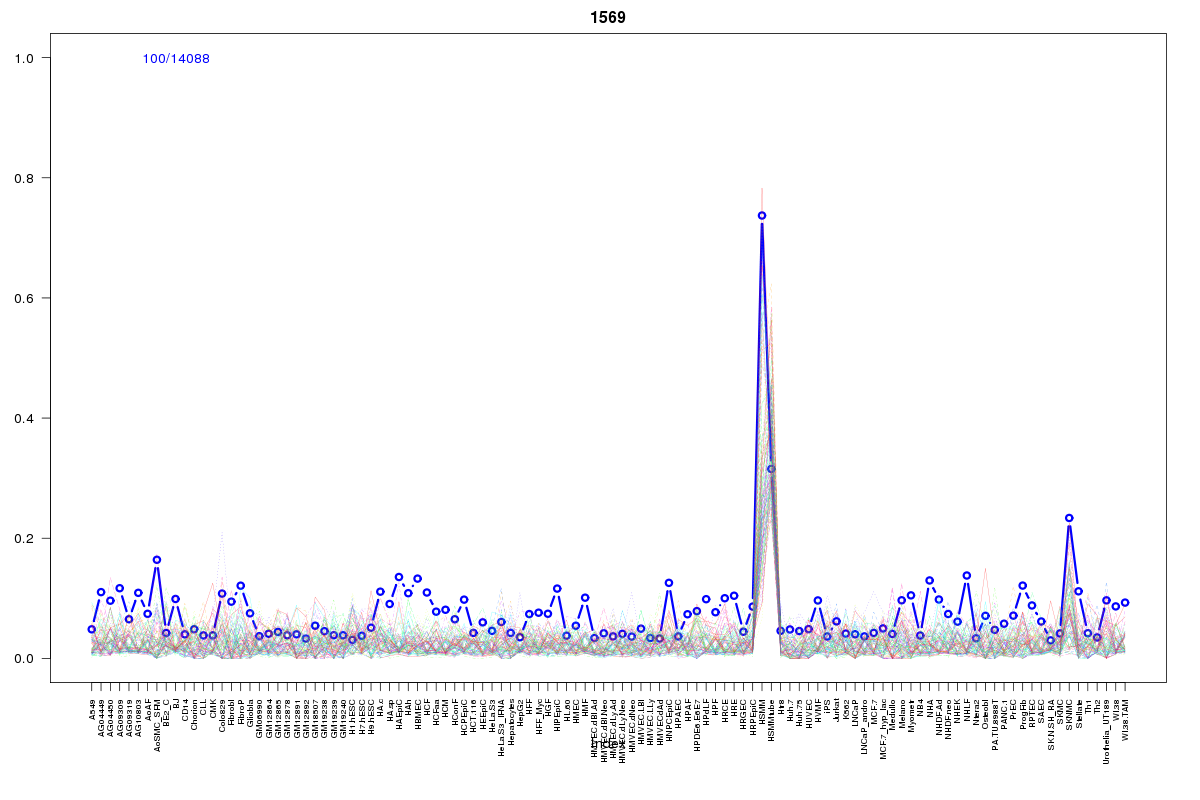 | 1569 | 1 |
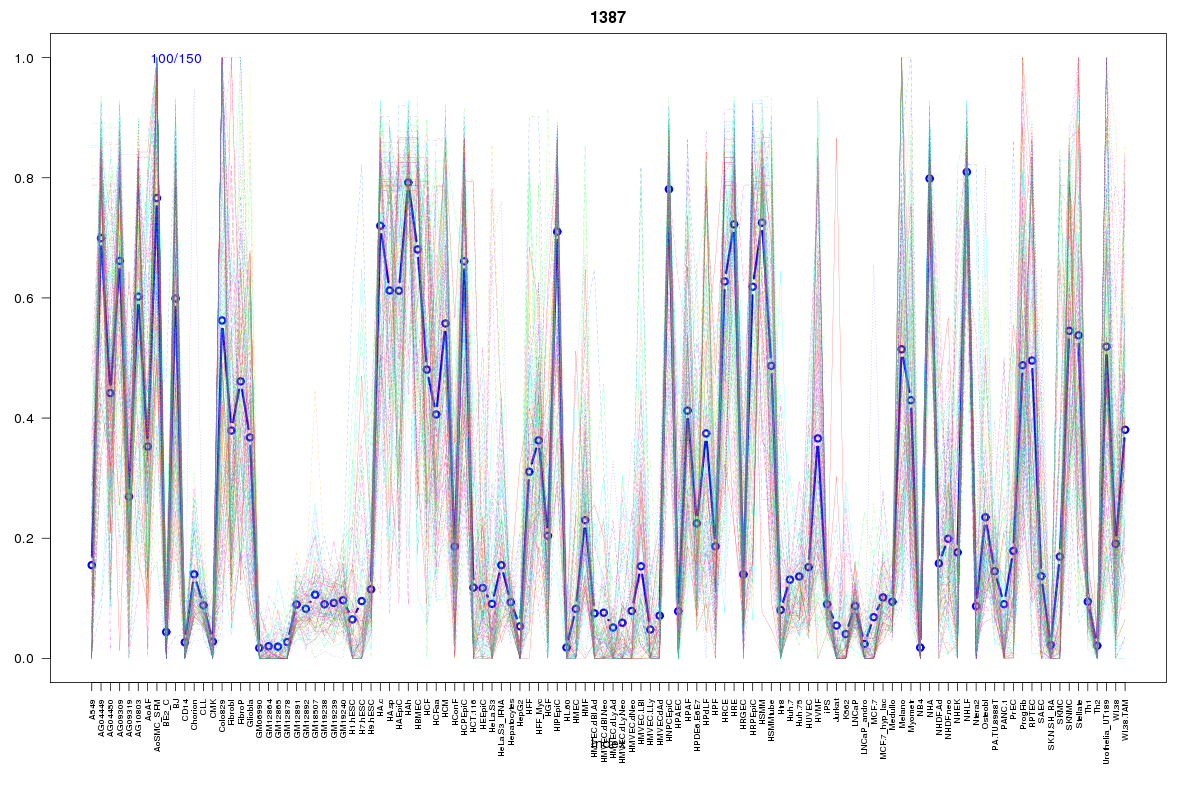 | 1387 | 1 |
 | 1143 | 1 |
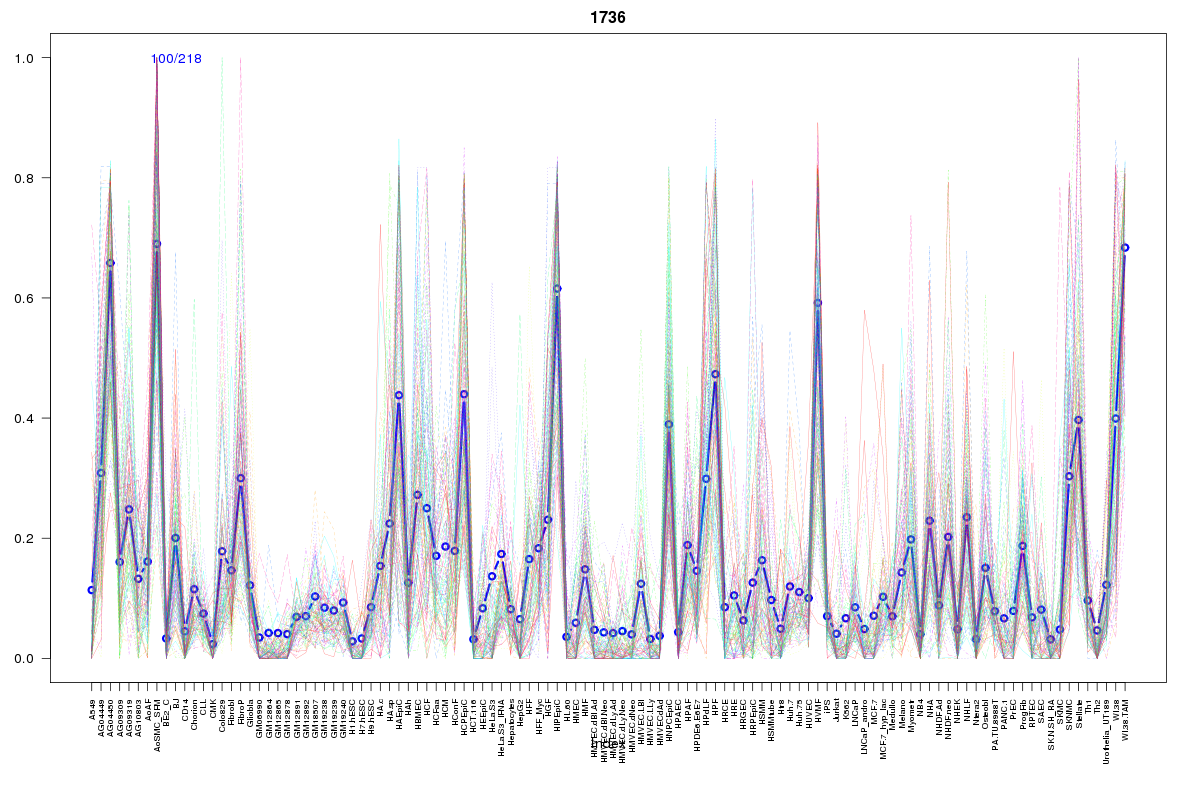 | 1736 | 1 |
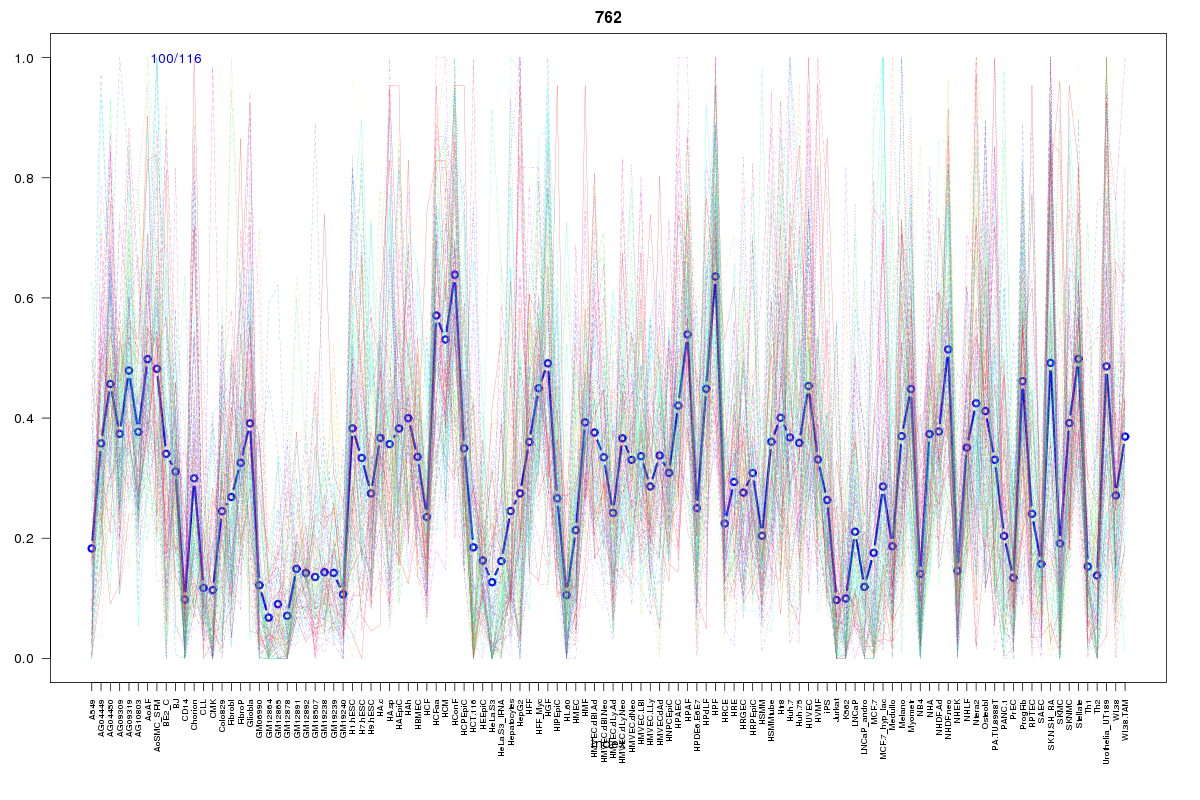 | 762 | 1 |
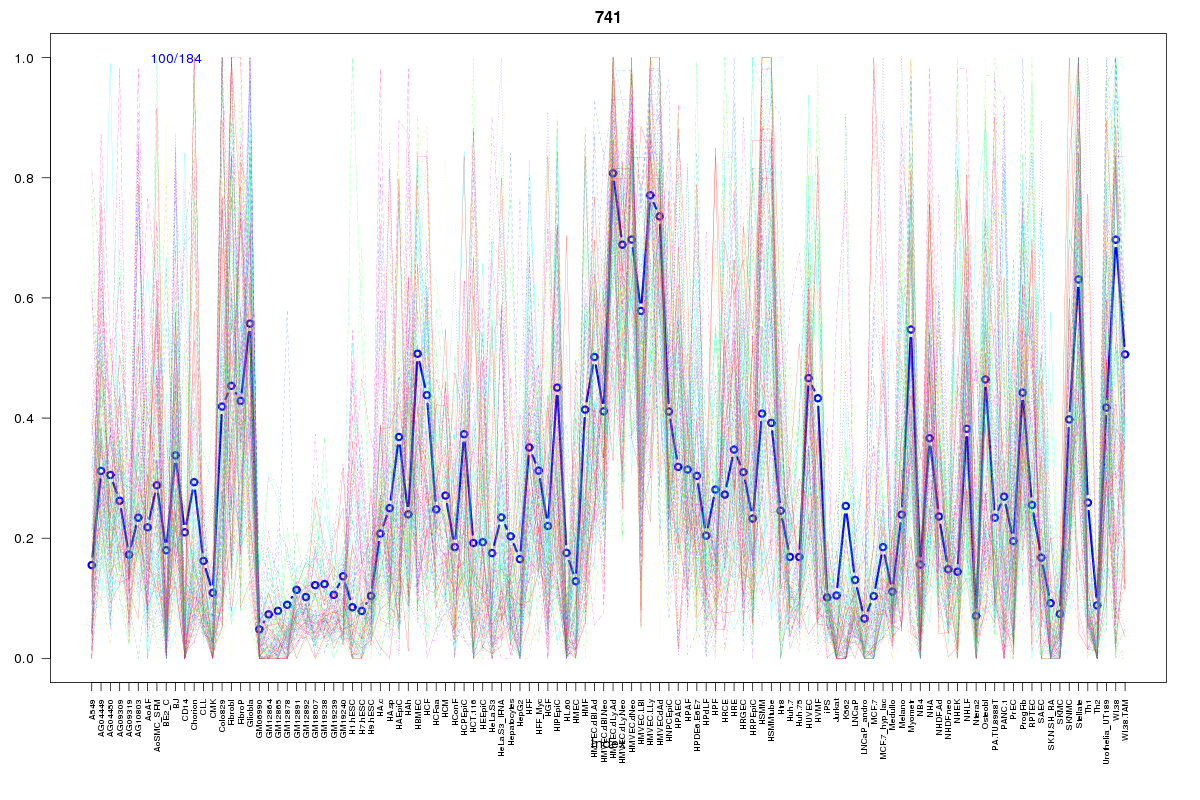 | 741 | 1 |
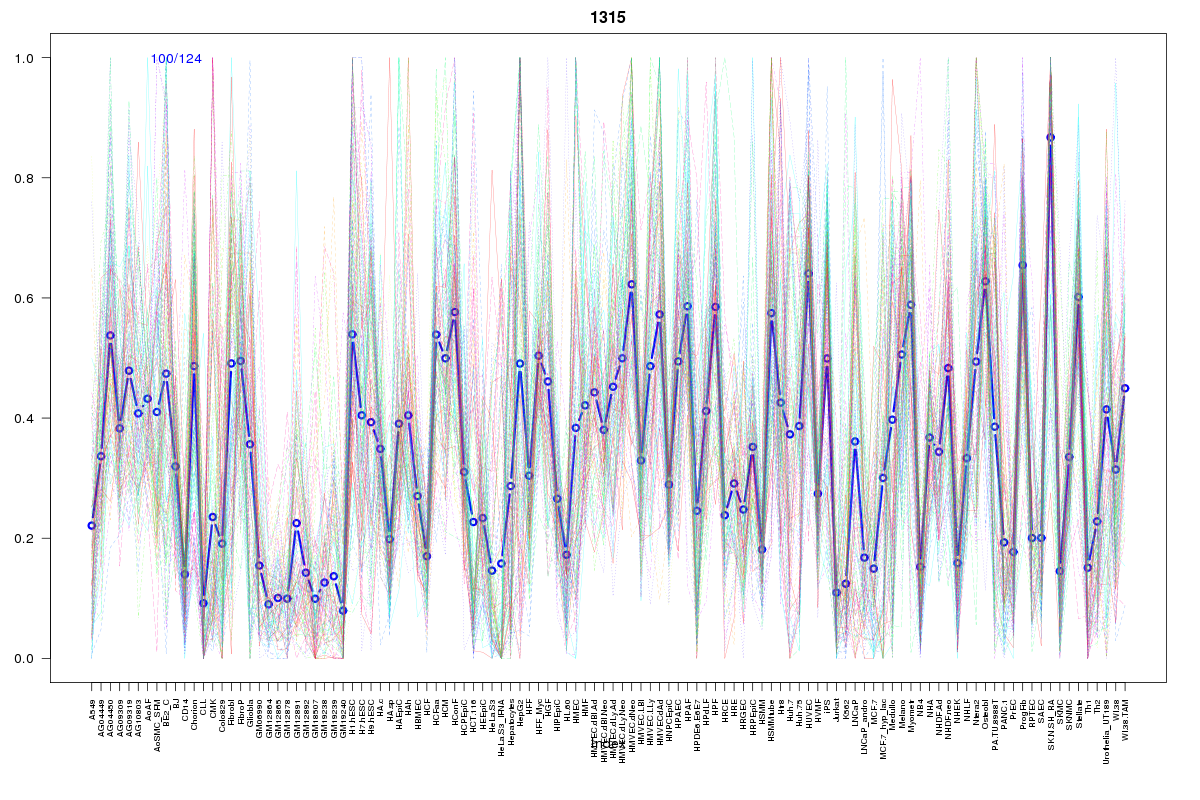 | 1315 | 1 |
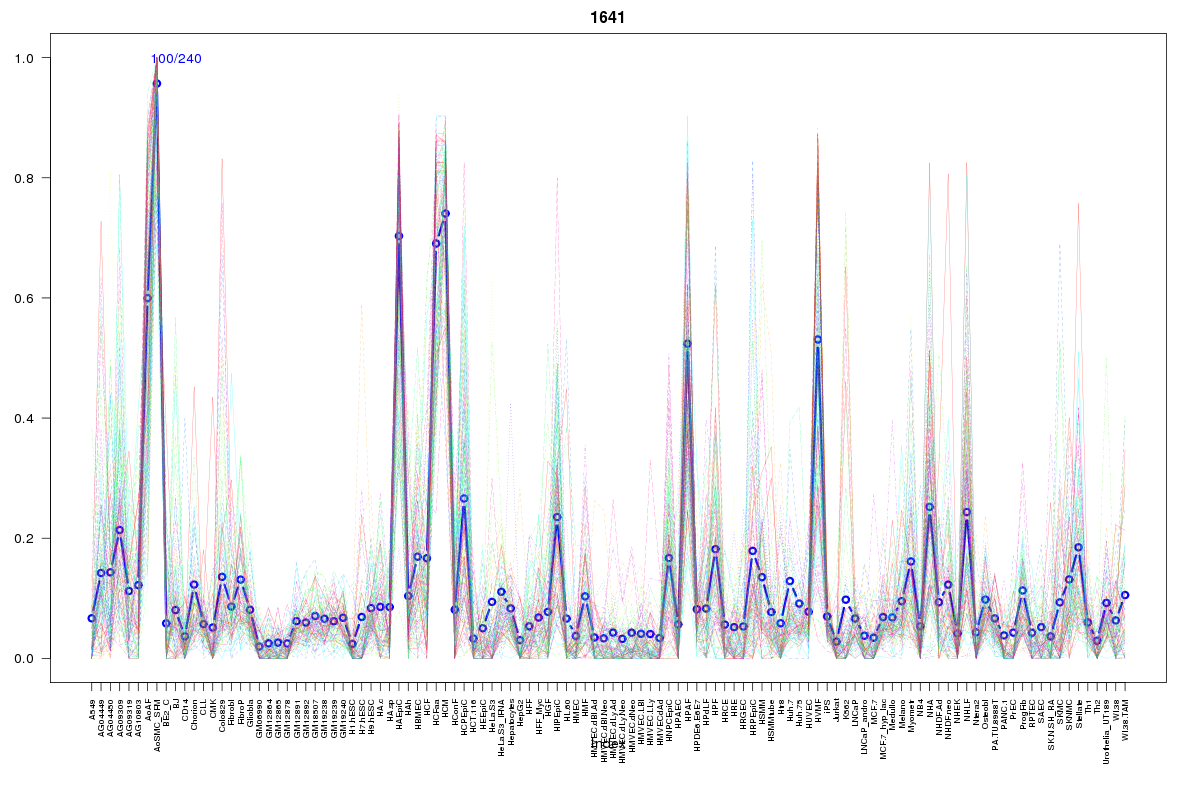 | 1641 | 1 |
 | 927 | 1 |
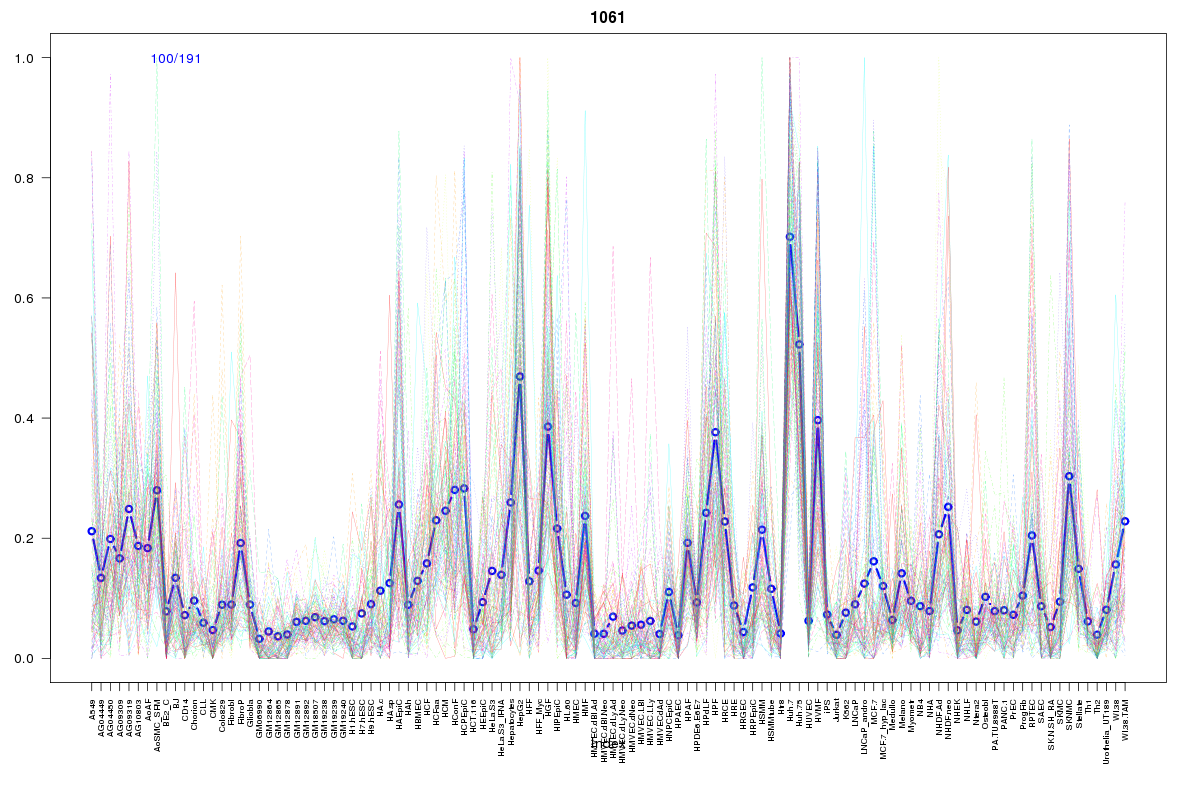 | 1061 | 1 |
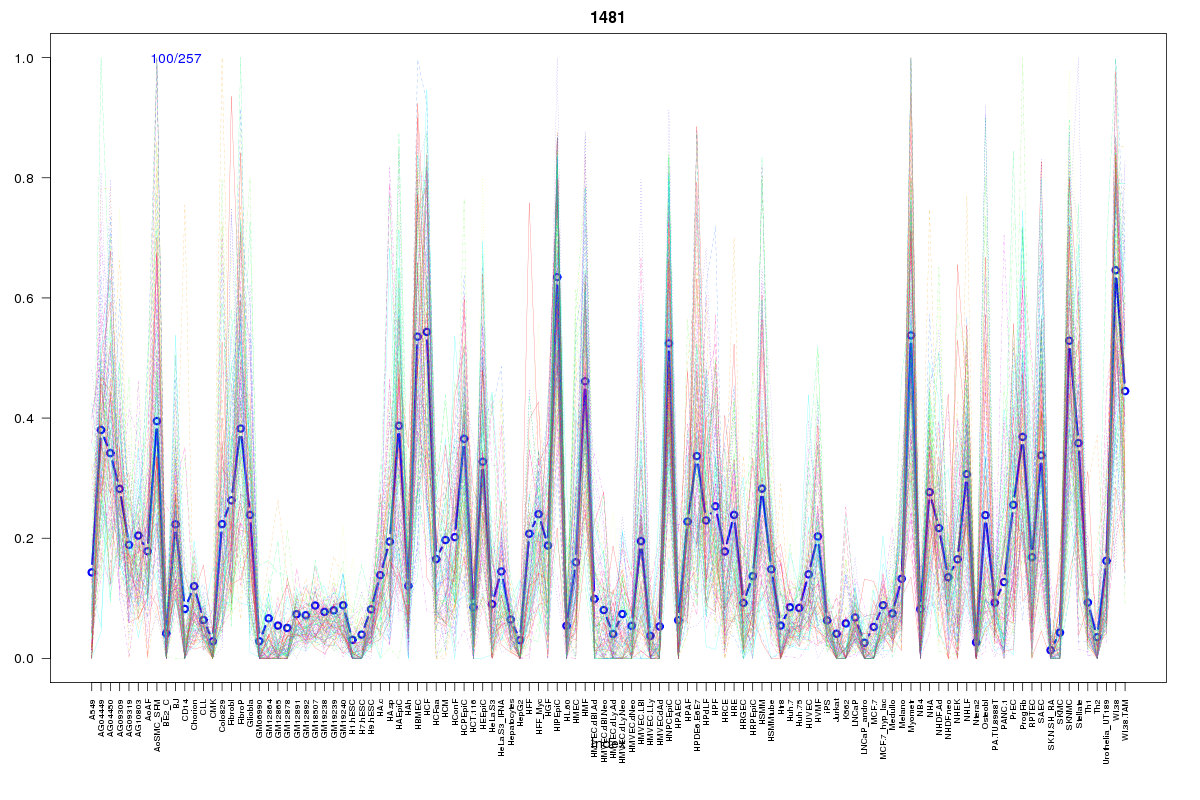 | 1481 | 1 |
Resources
BED file downloads
Connects to 37 DHS sitesTop 10 Correlated DHS Sites
p-values indiciate significant higher or lower correlation| Location | Cluster | P-value |
|---|---|---|
| chr5:51988020-51988170 | 1532 | 0 |
| chr5:52083945-52084095 | 1315 | 0 |
| chr5:52083780-52083930 | 762 | 0 |
| chr5:52095180-52095330 | 1514 | 0.001 |
| chr5:52083620-52083770 | 1143 | 0.001 |
| chr5:52155620-52155770 | 1534 | 0.003 |
| chr5:52216860-52217010 | 1696 | 0.006 |
| chr5:52160340-52160490 | 1387 | 0.006 |
| chr5:52132960-52133110 | 2260 | 0.006 |
| chr5:52007000-52007150 | 979 | 0.006 |
| chr5:52104280-52104430 | 1944 | 0.007 |
External Databases
UCSCEnsembl (ENSG00000213949)