Gene: CELA2B
chr1: 15792403-15809863Expression Profile
(log scale)
Graphical Connections
Distribution of linked clusters:
You may find it interesting if many of the connected DHS sites belong to the same cluster.| Cluster Profile | Cluster ID | Number of DHS sites in this cluster |
|---|---|---|
 | 2055 | 2 |
 | 615 | 2 |
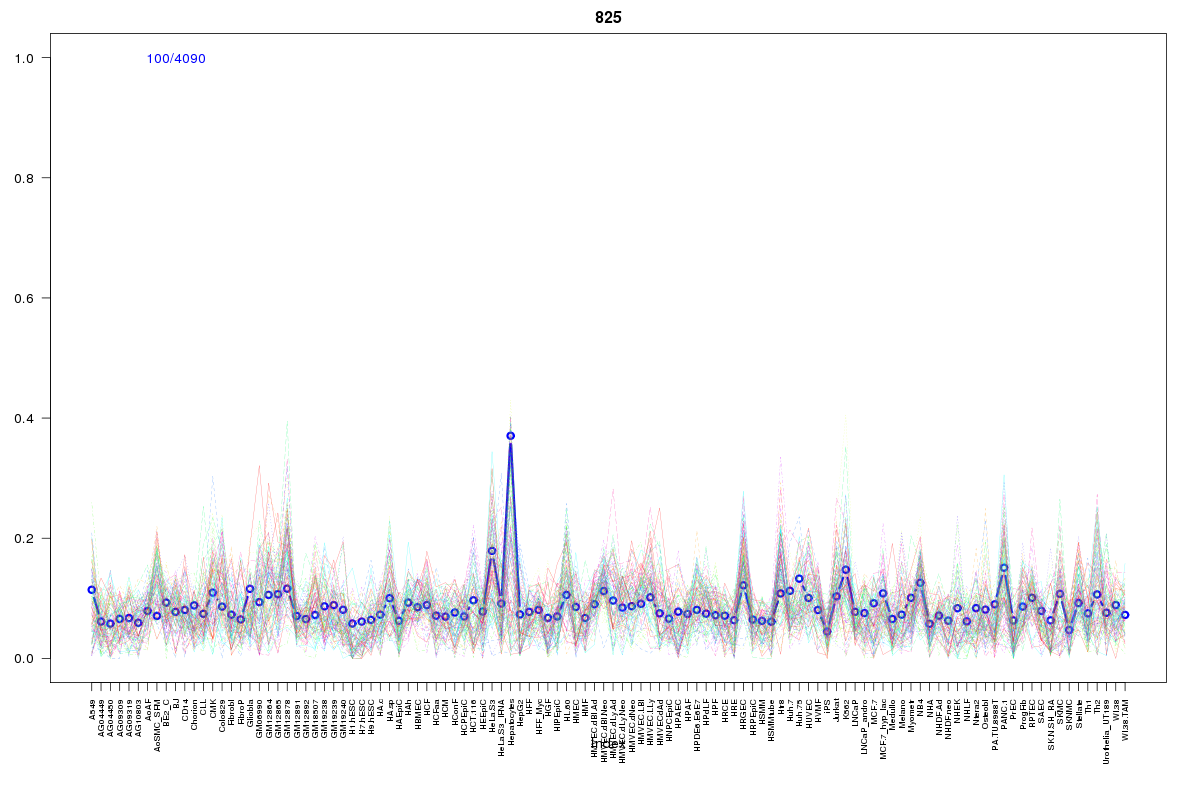 | 825 | 1 |
 | 2017 | 1 |
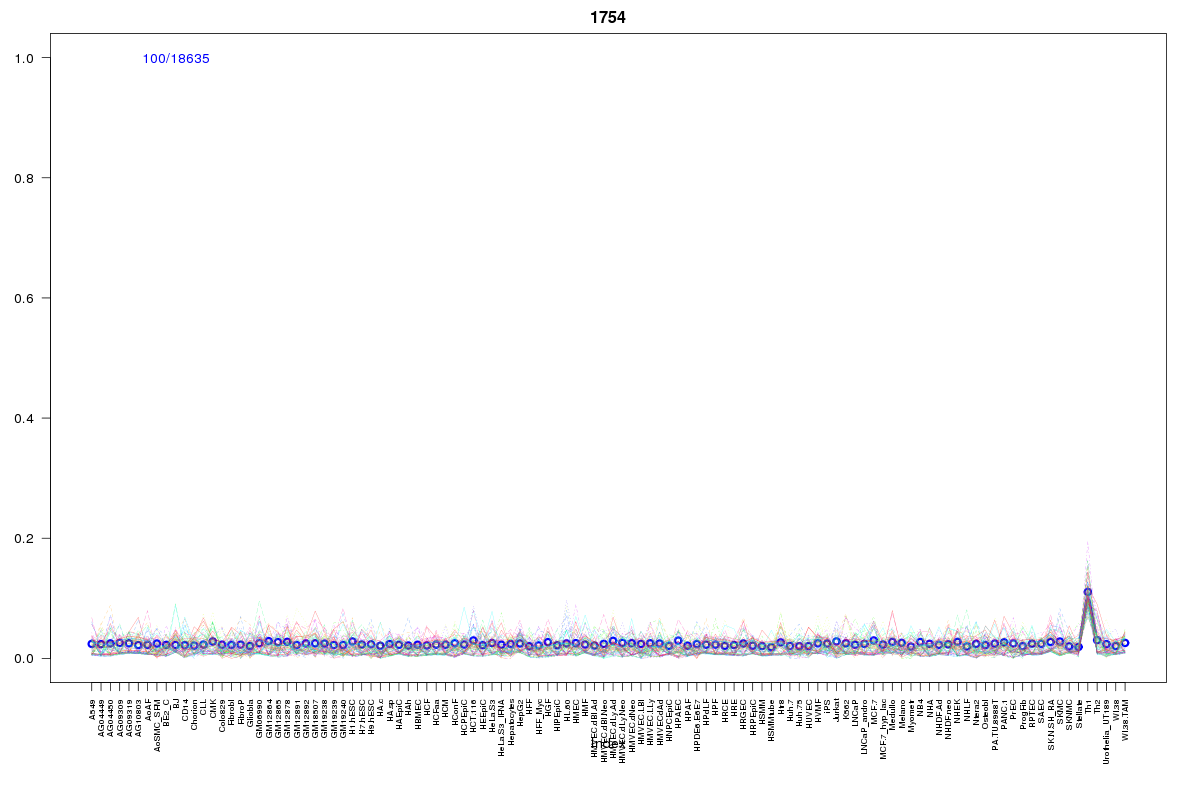 | 1754 | 1 |
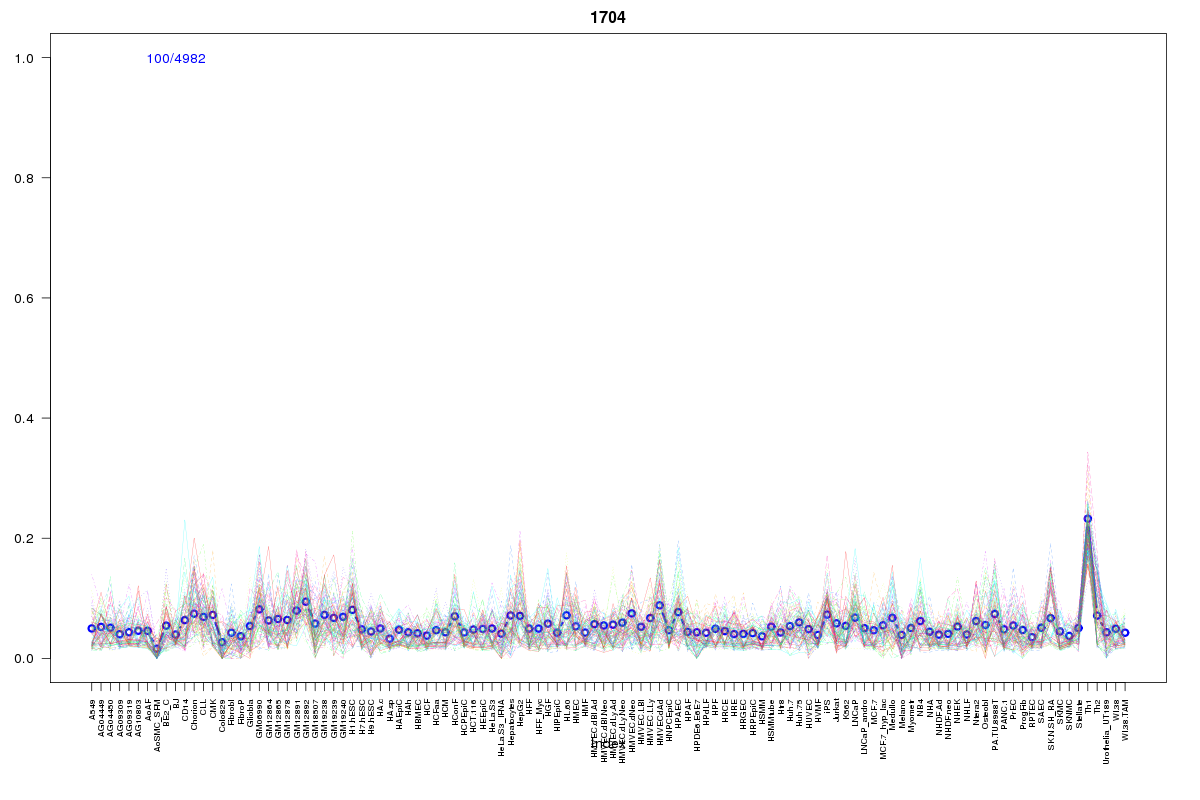 | 1704 | 1 |
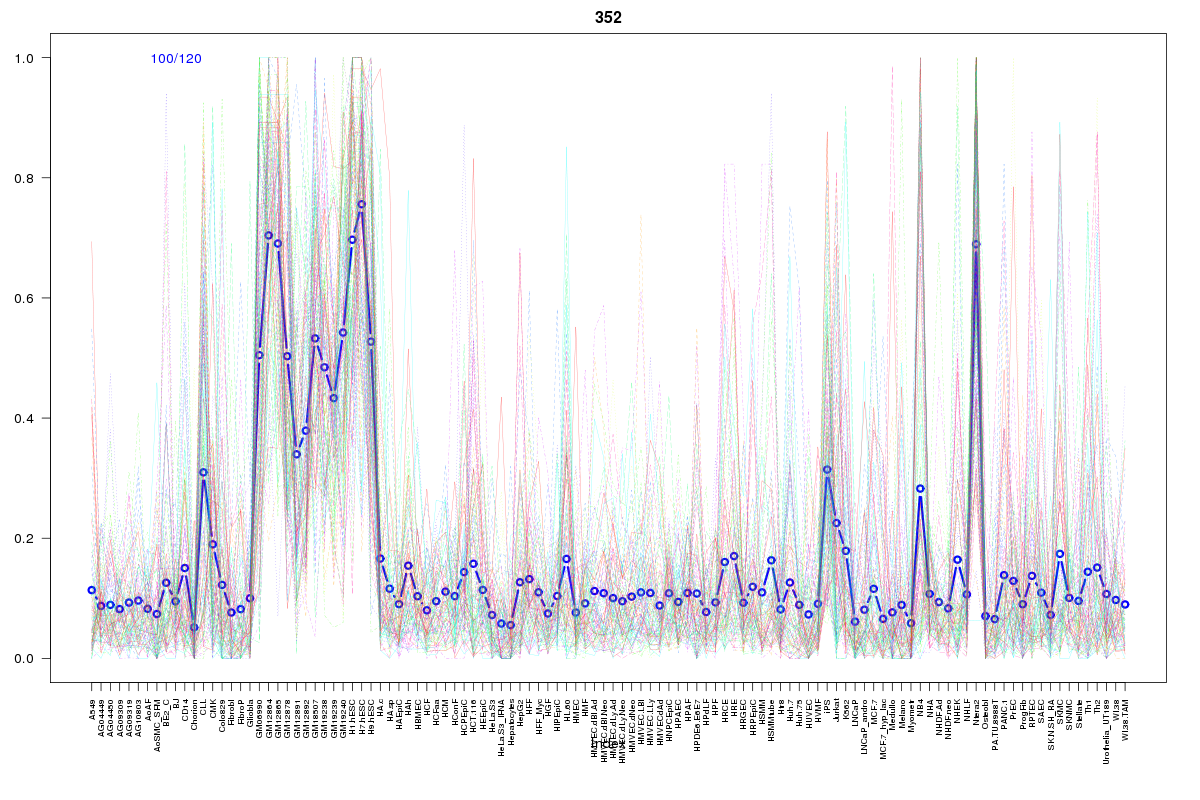 | 352 | 1 |
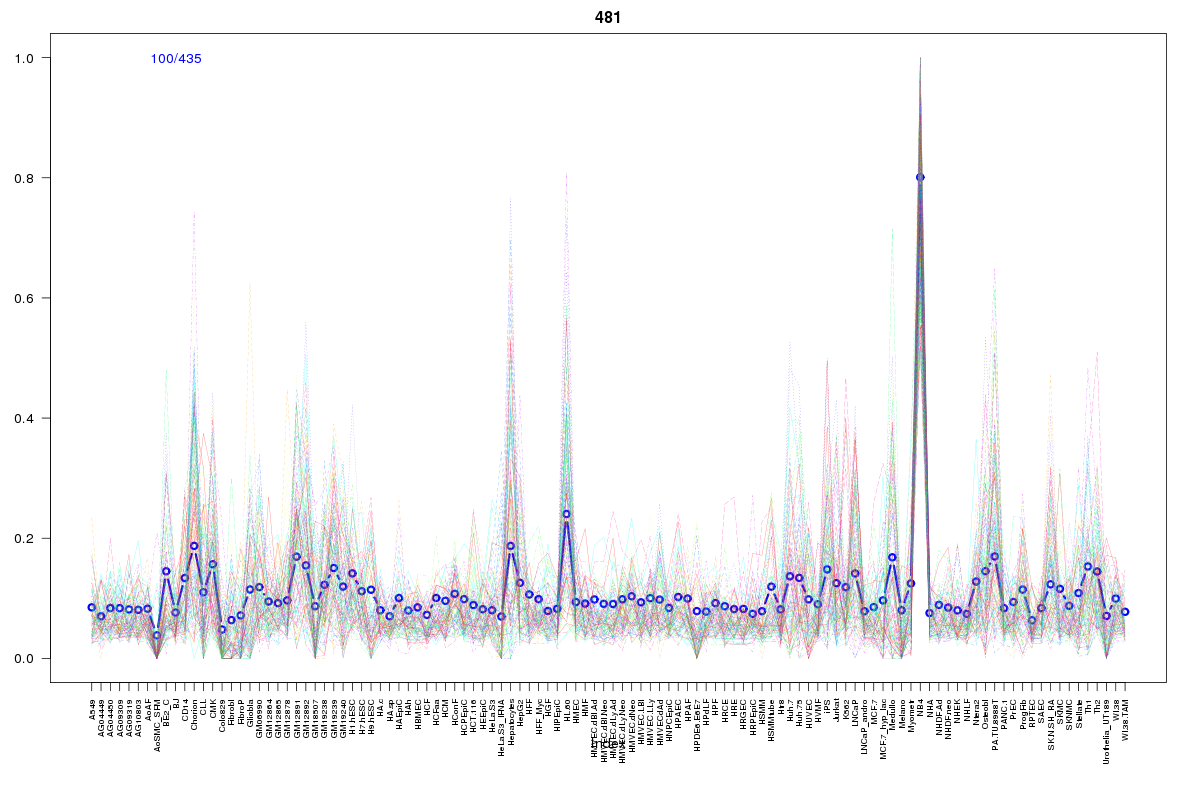 | 481 | 1 |
 | 1355 | 1 |
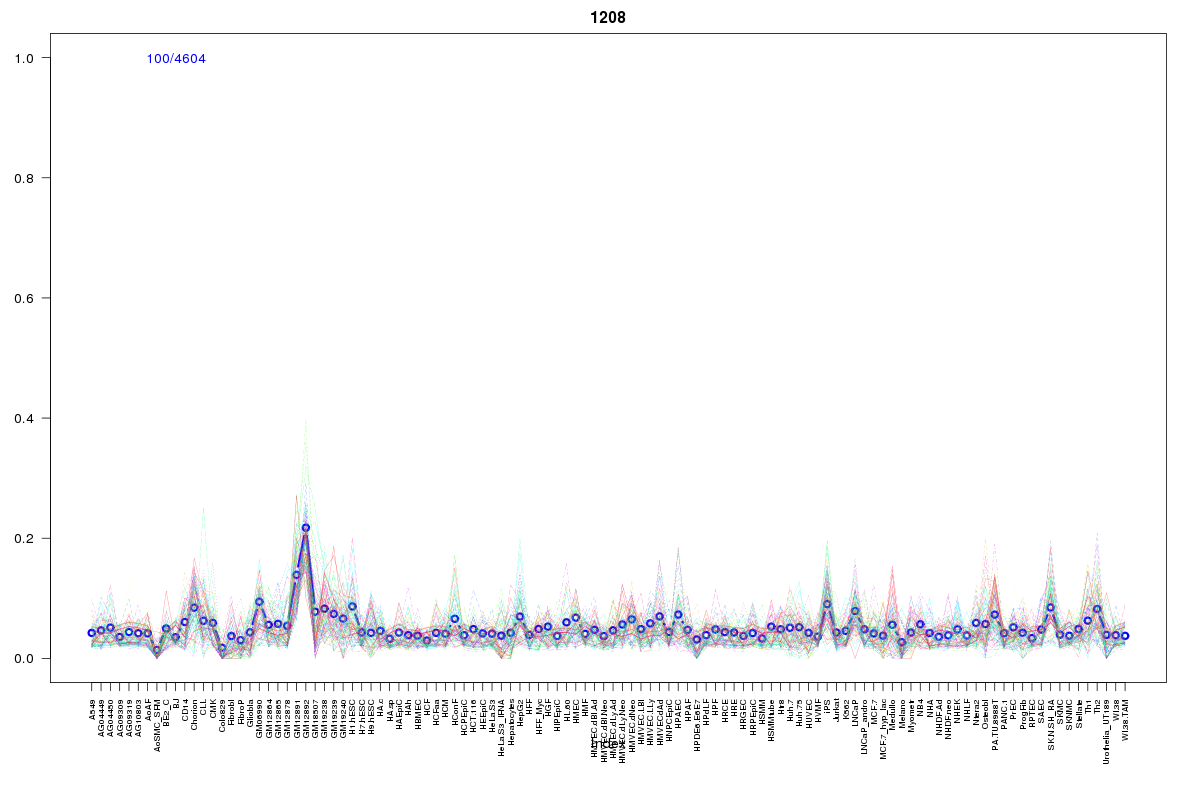 | 1208 | 1 |
 | 2062 | 1 |
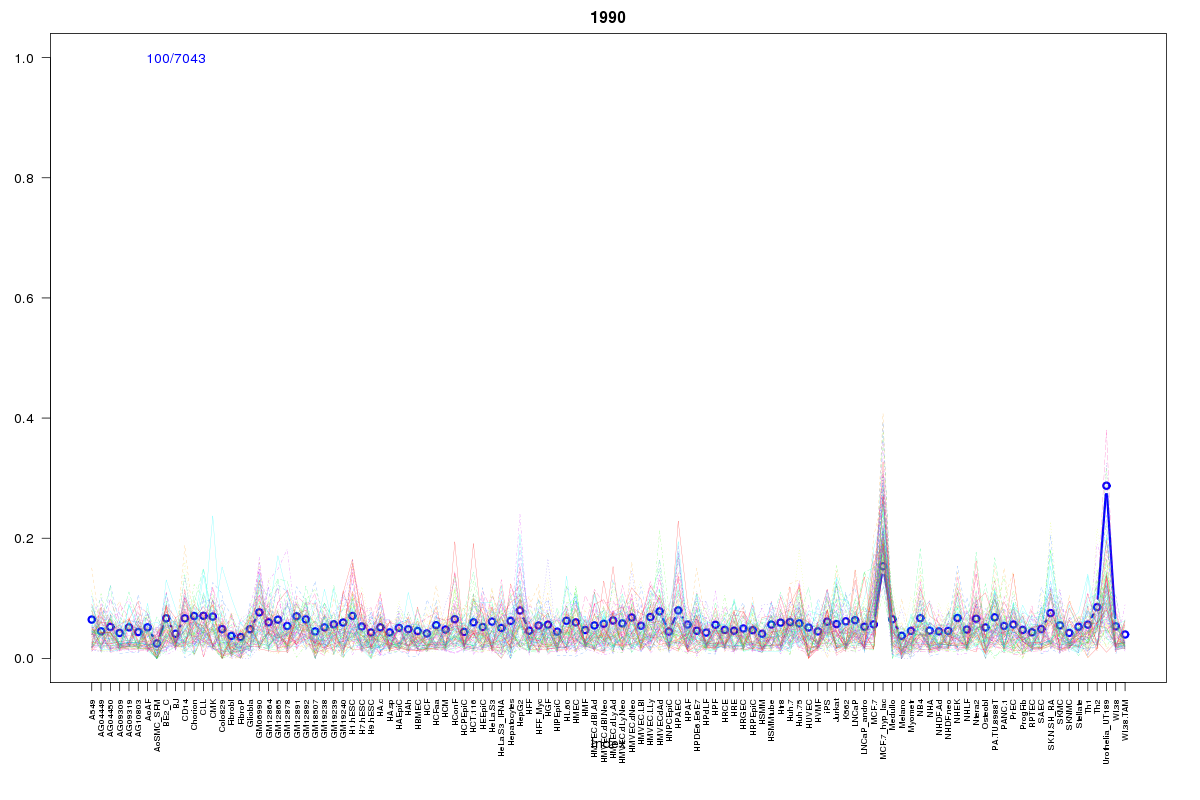 | 1990 | 1 |
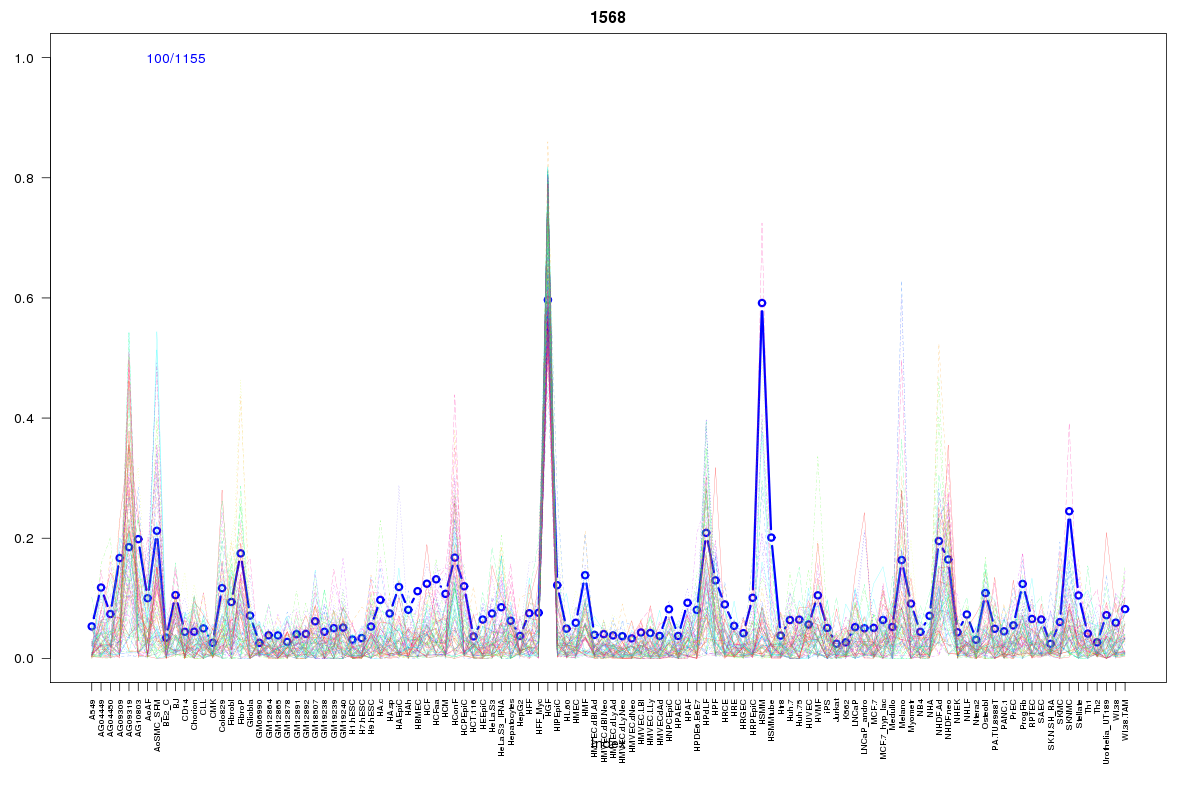 | 1568 | 1 |
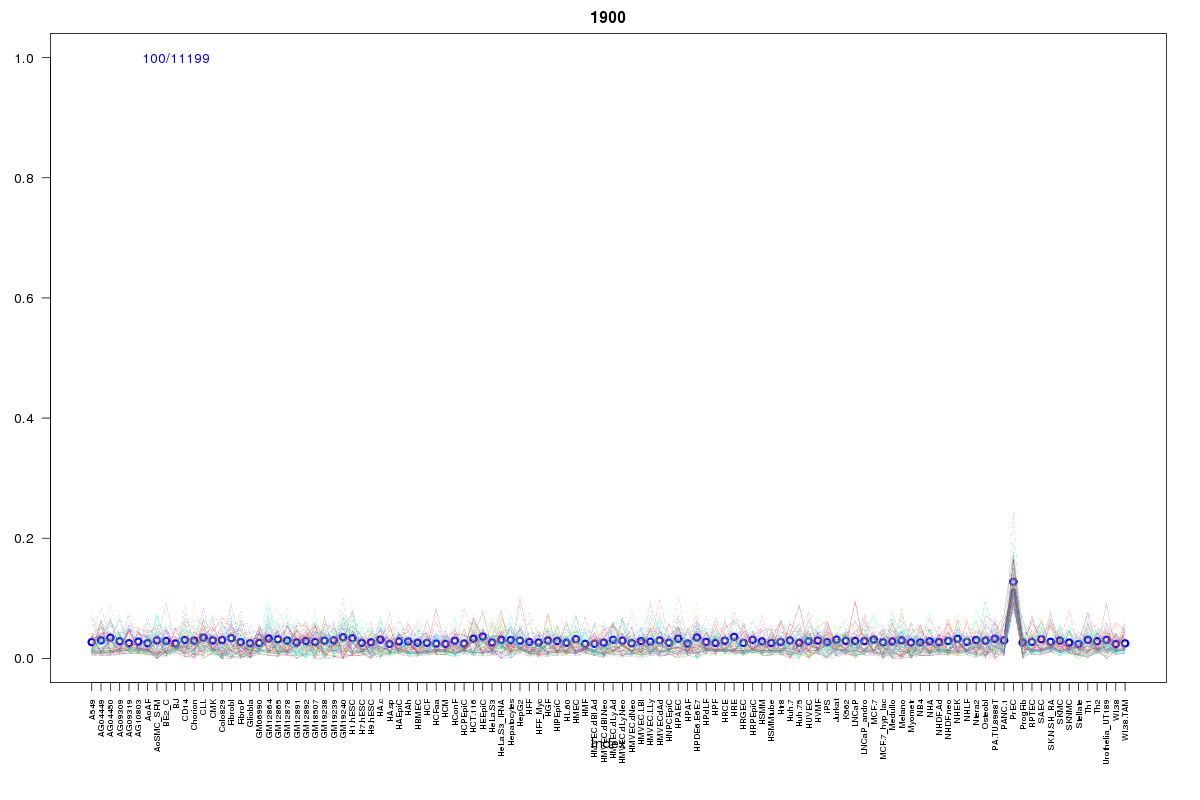 | 1900 | 1 |
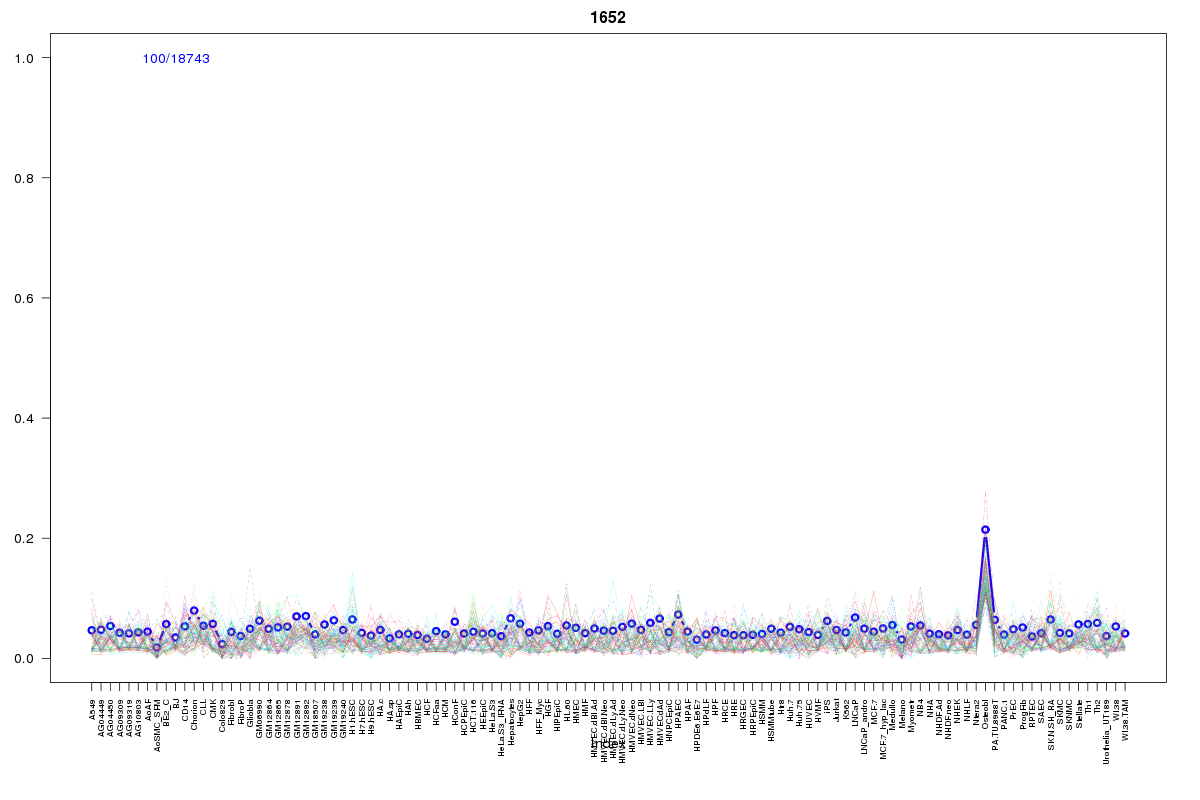 | 1652 | 1 |
 | 1755 | 1 |
 | 626 | 1 |
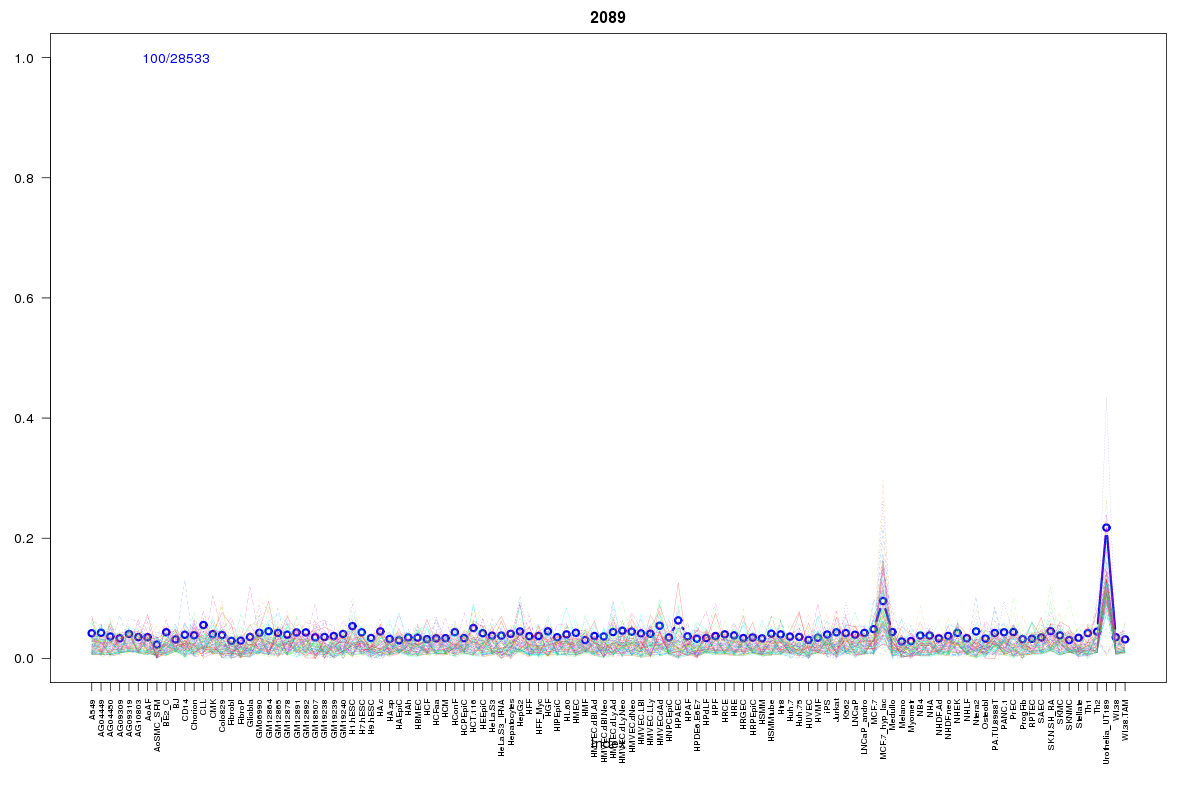 | 2089 | 1 |
Resources
BED file downloads
Connects to 20 DHS sitesTop 10 Correlated DHS Sites
p-values indiciate significant higher or lower correlation| Location | Cluster | P-value |
|---|---|---|
| chr1:15855205-15855355 | 1754 | 0.006 |
| chr1:15728600-15728750 | 1355 | 0.006 |
| chr1:15738480-15738630 | 2062 | 0.011 |
| chr1:15813765-15813915 | 1755 | 0.011 |
| chr1:15854140-15854290 | 2017 | 0.015 |
| chr1:15905145-15905295 | 1704 | 0.015 |
| chr1:15831225-15831375 | 2089 | 0.018 |
| chr1:15698365-15698515 | 615 | 0.018 |
| chr1:15763625-15763775 | 1990 | 0.018 |
| chr1:15698840-15698990 | 615 | 0.021 |
| chr1:15852420-15852570 | 825 | 0.023 |
External Databases
UCSCEnsembl (ENSG00000215704)