Gene: TTC34
chr1: 2567414-2718286Expression Profile
(log scale)
Graphical Connections
Distribution of linked clusters:
You may find it interesting if many of the connected DHS sites belong to the same cluster.| Cluster Profile | Cluster ID | Number of DHS sites in this cluster |
|---|---|---|
 | 1008 | 3 |
 | 1078 | 3 |
 | 2052 | 3 |
 | 10 | 2 |
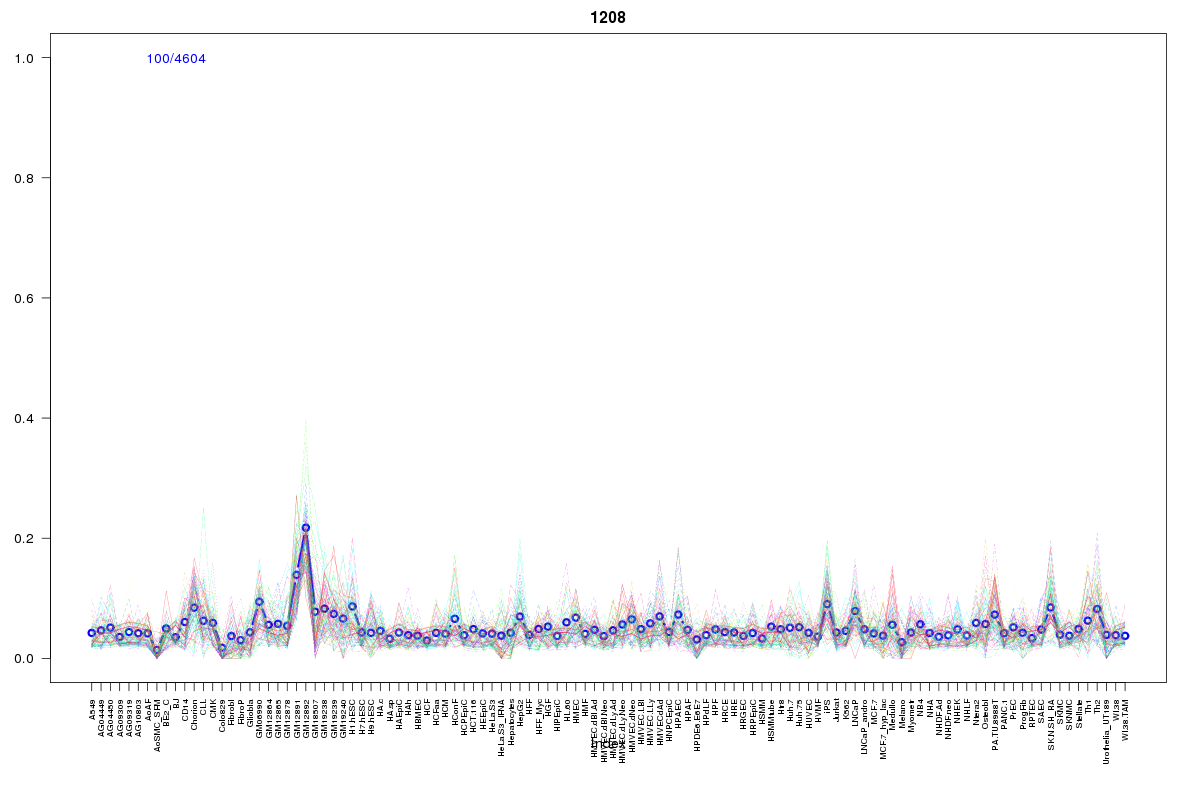 | 1208 | 2 |
 | 860 | 2 |
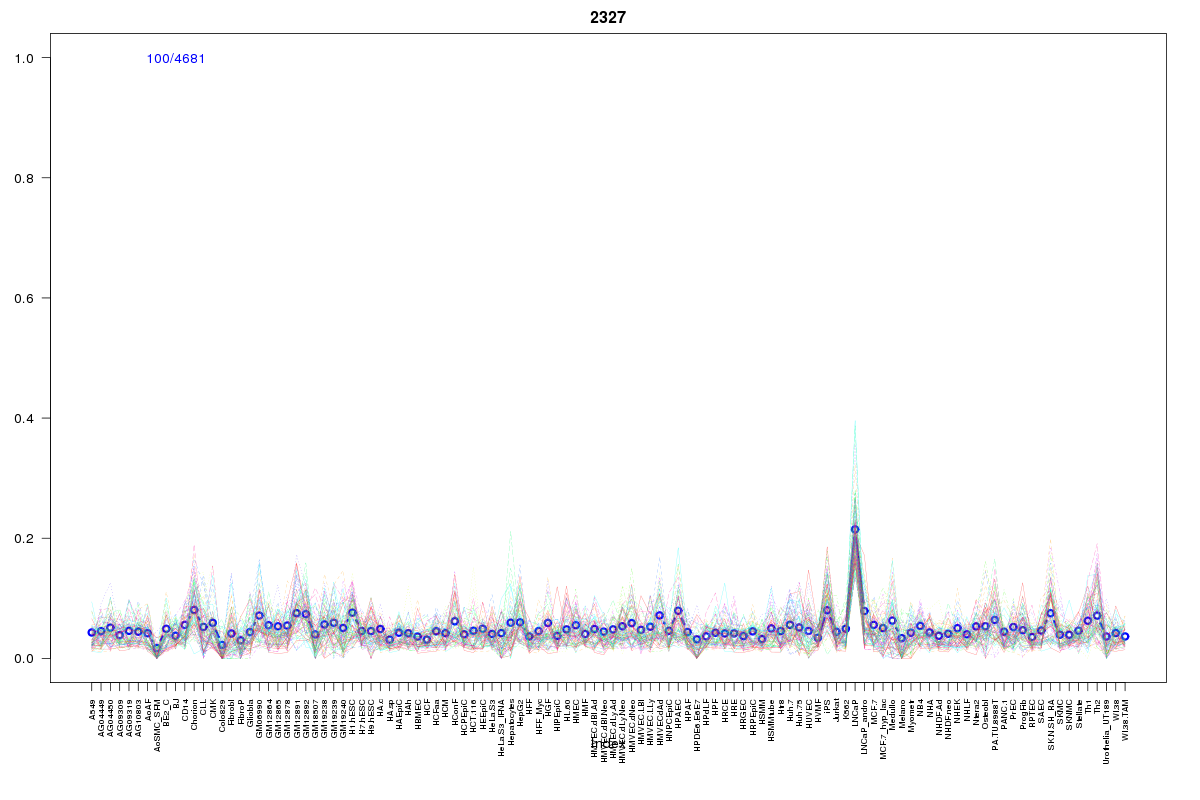 | 2327 | 2 |
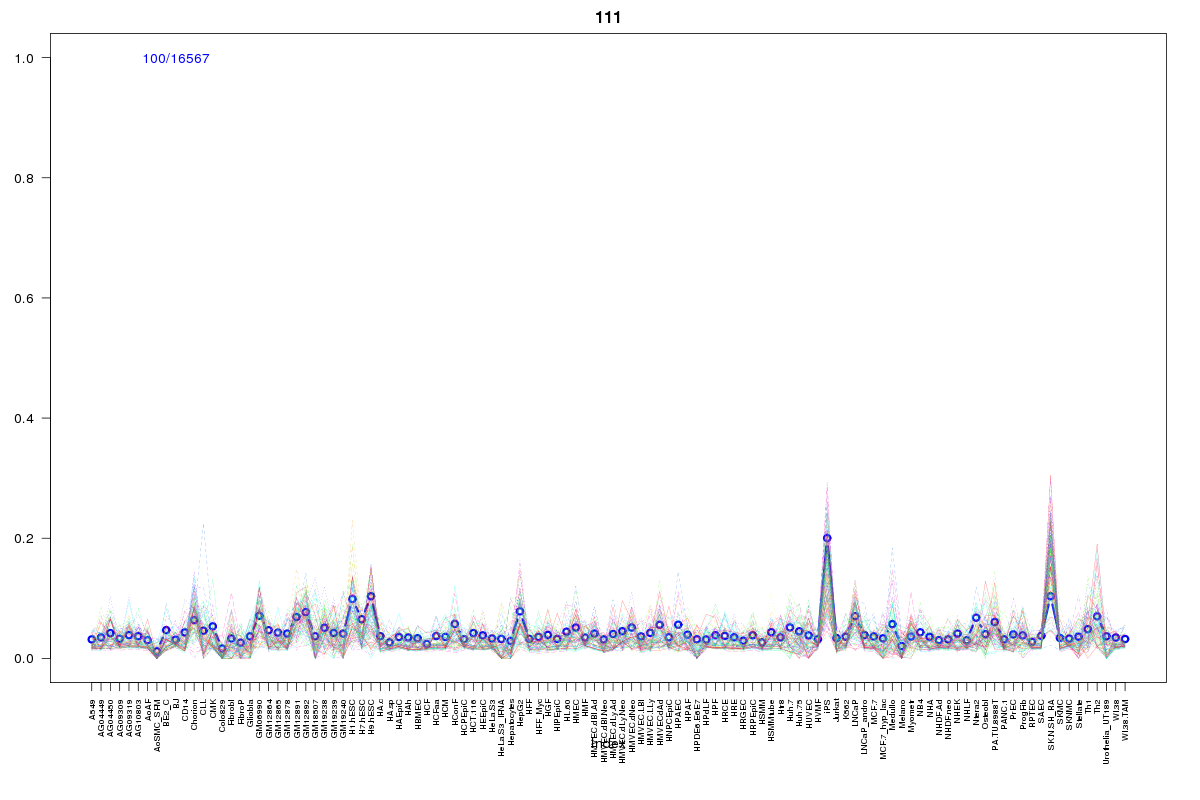 | 111 | 2 |
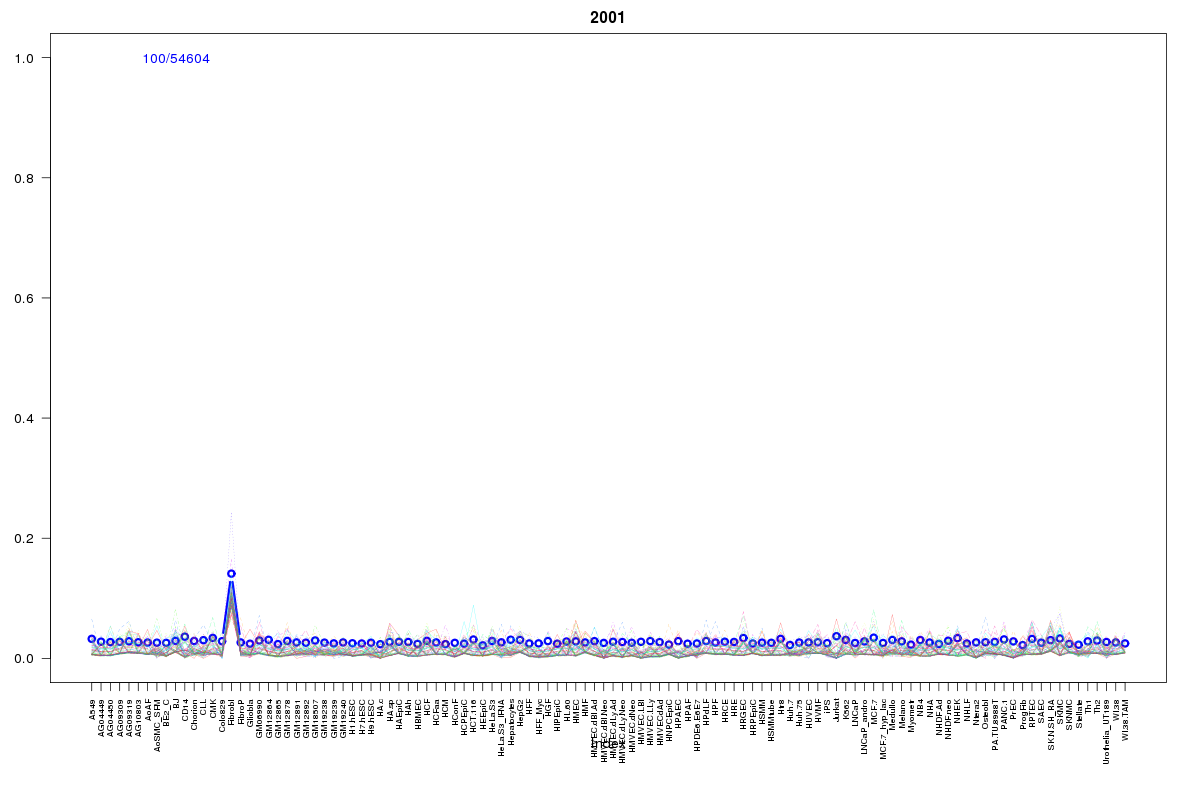 | 2001 | 2 |
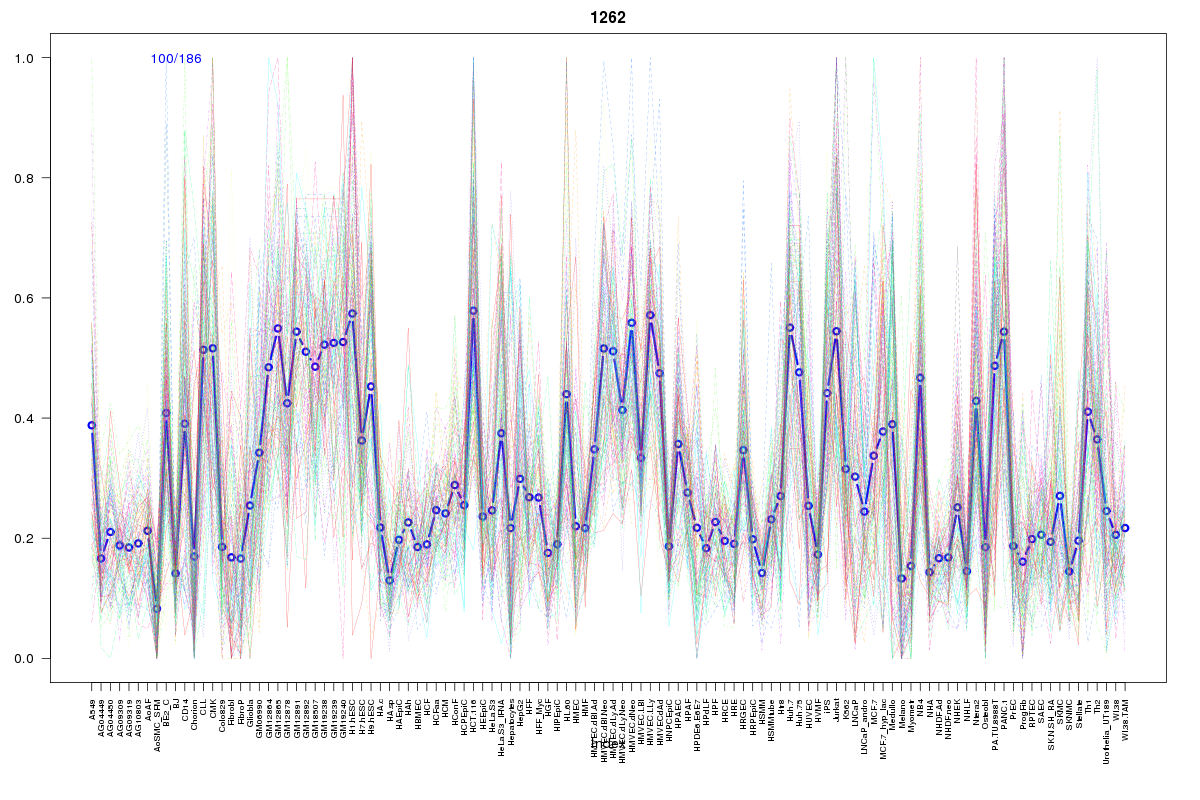 | 1262 | 2 |
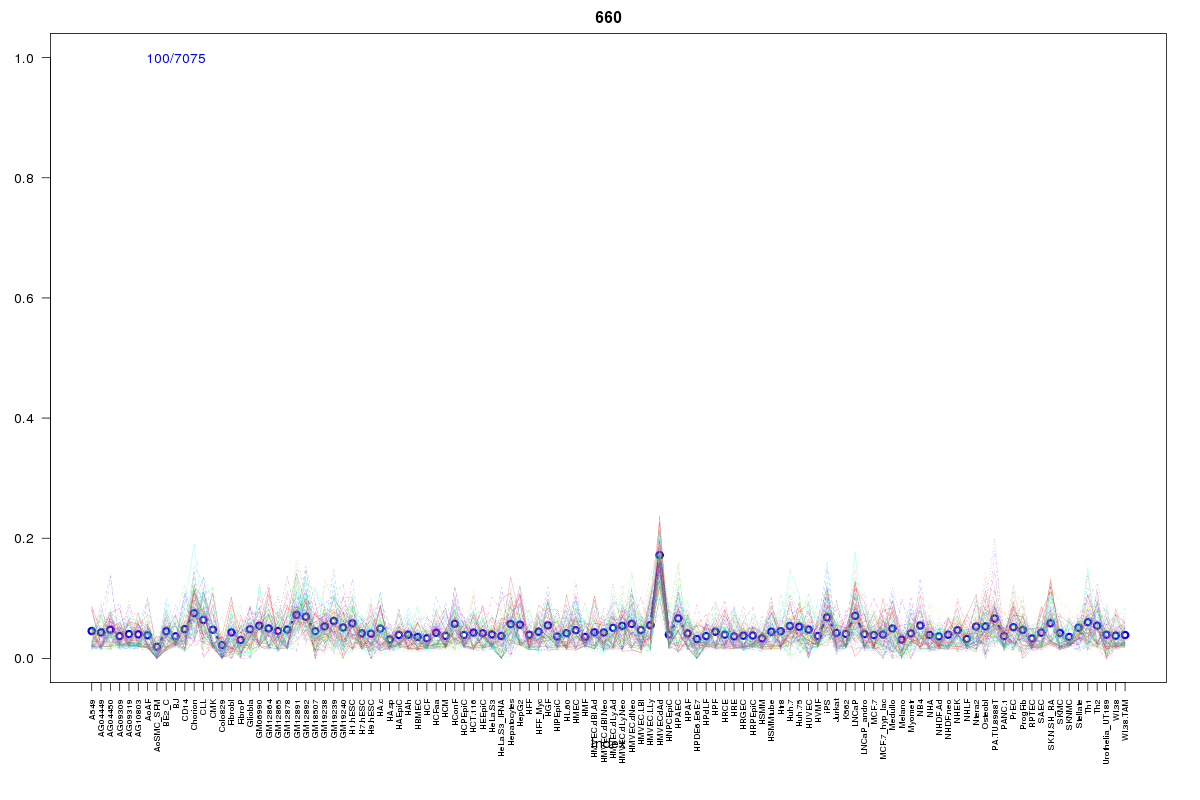 | 660 | 1 |
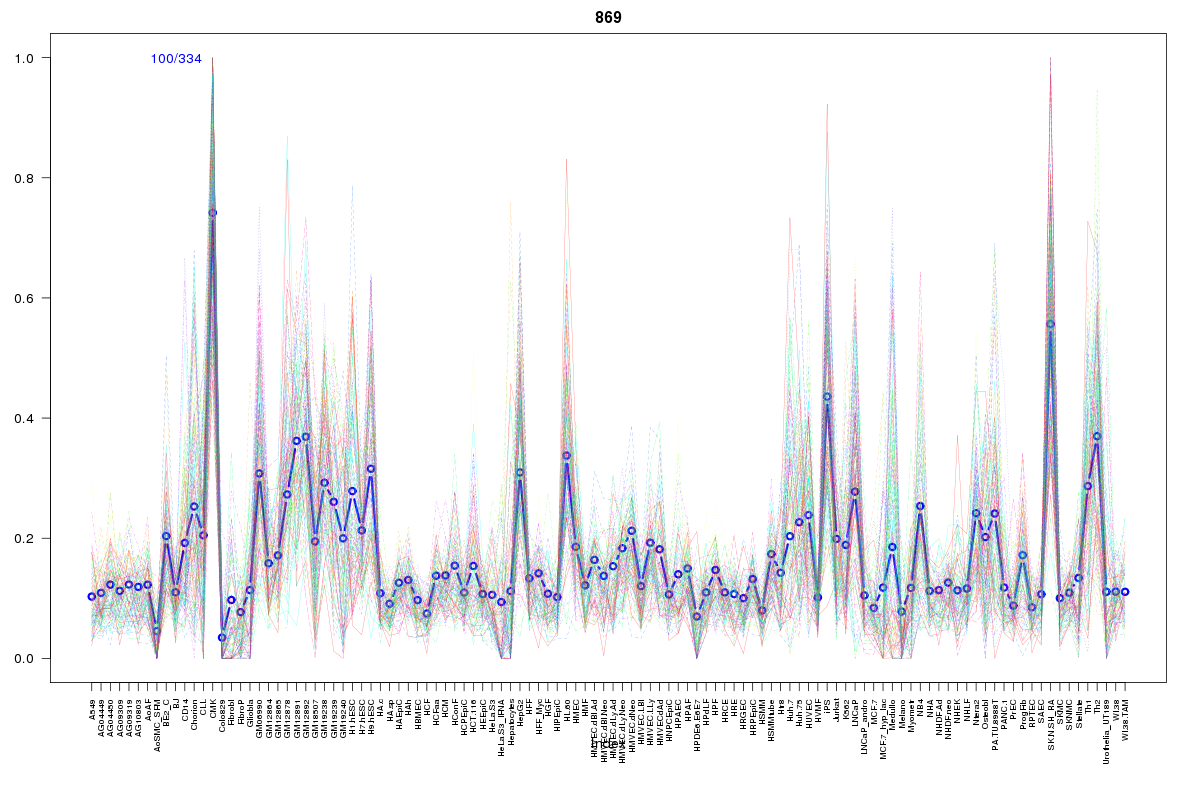 | 869 | 1 |
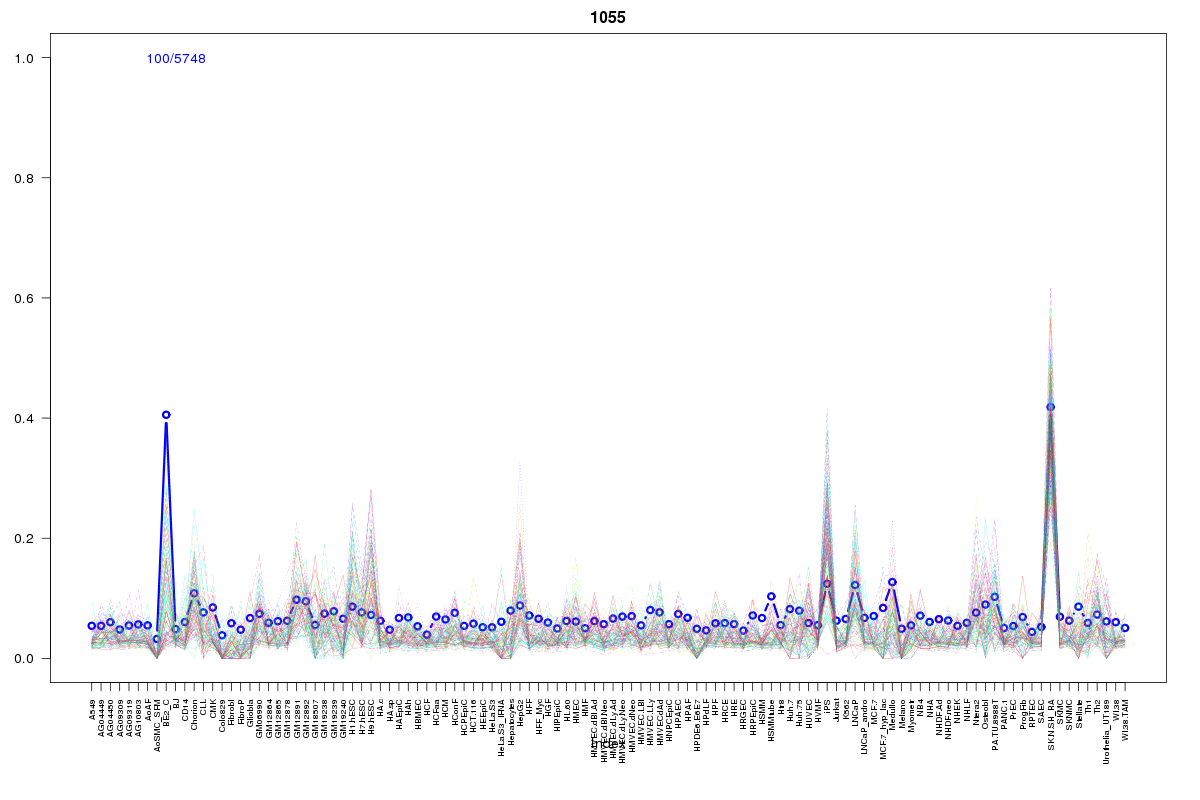 | 1055 | 1 |
 | 570 | 1 |
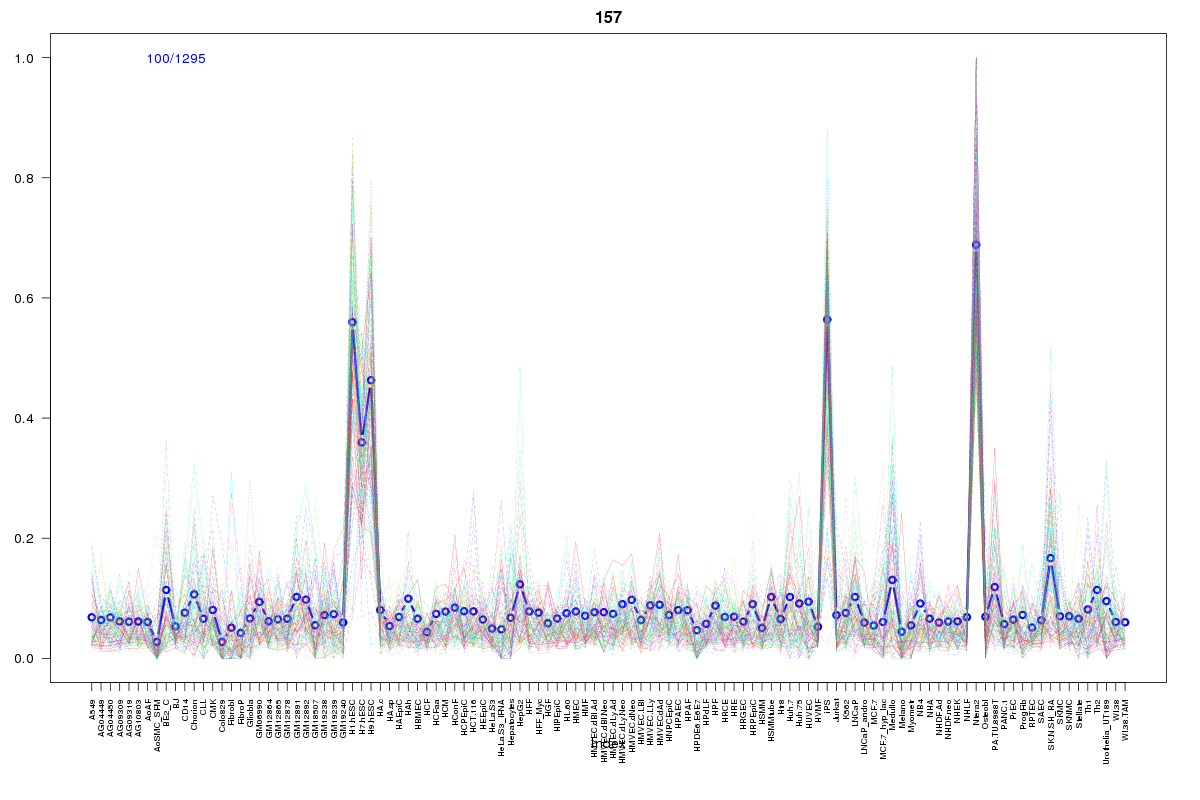 | 157 | 1 |
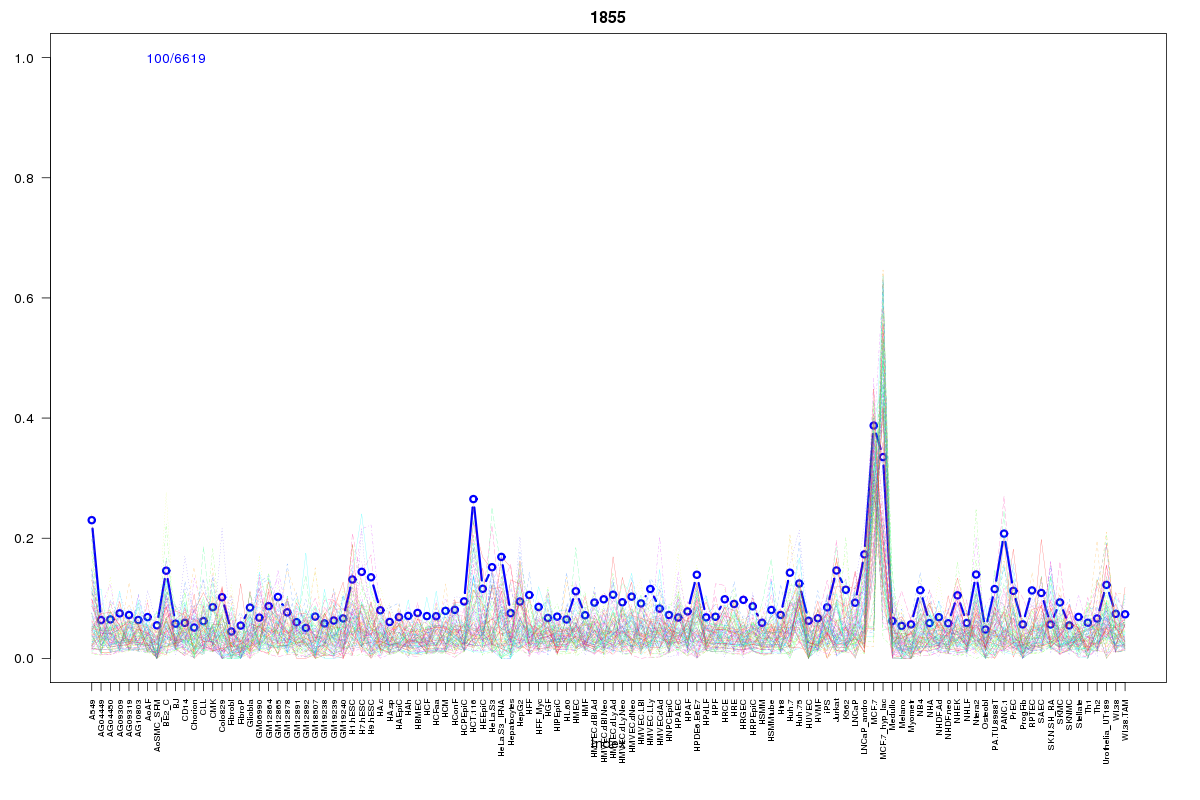 | 1855 | 1 |
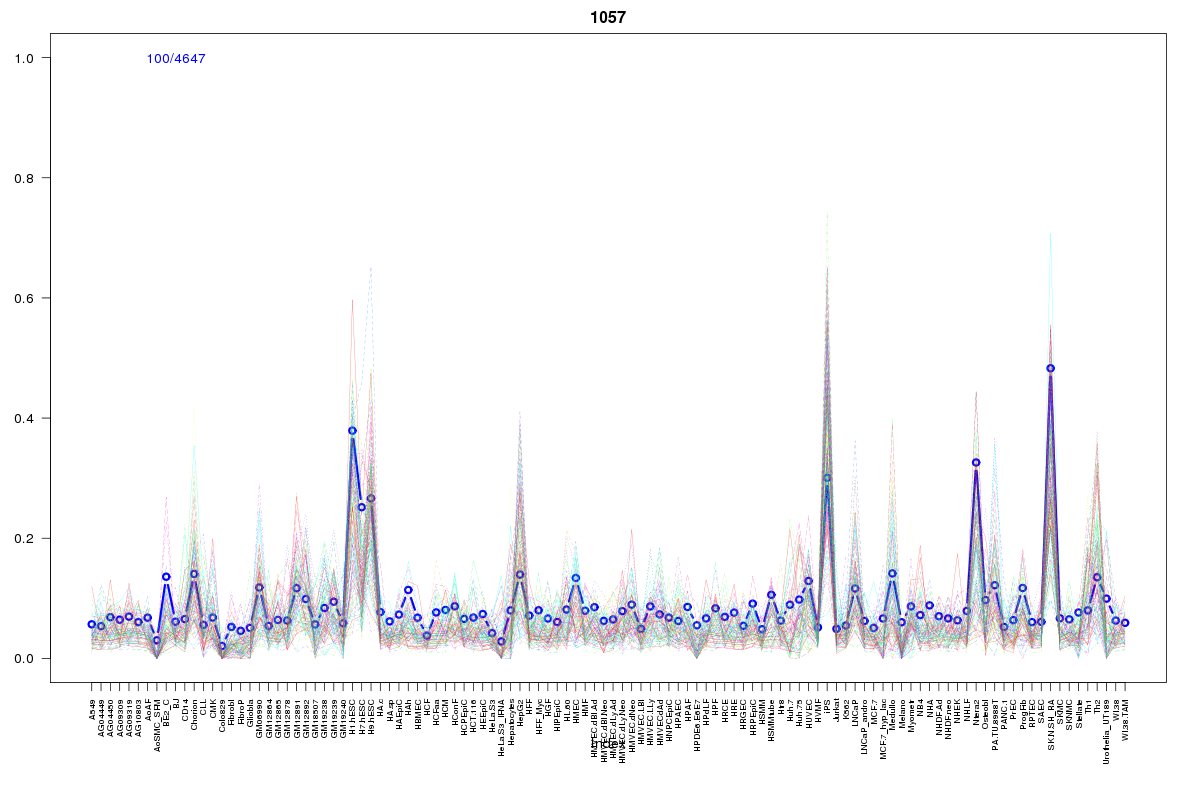 | 1057 | 1 |
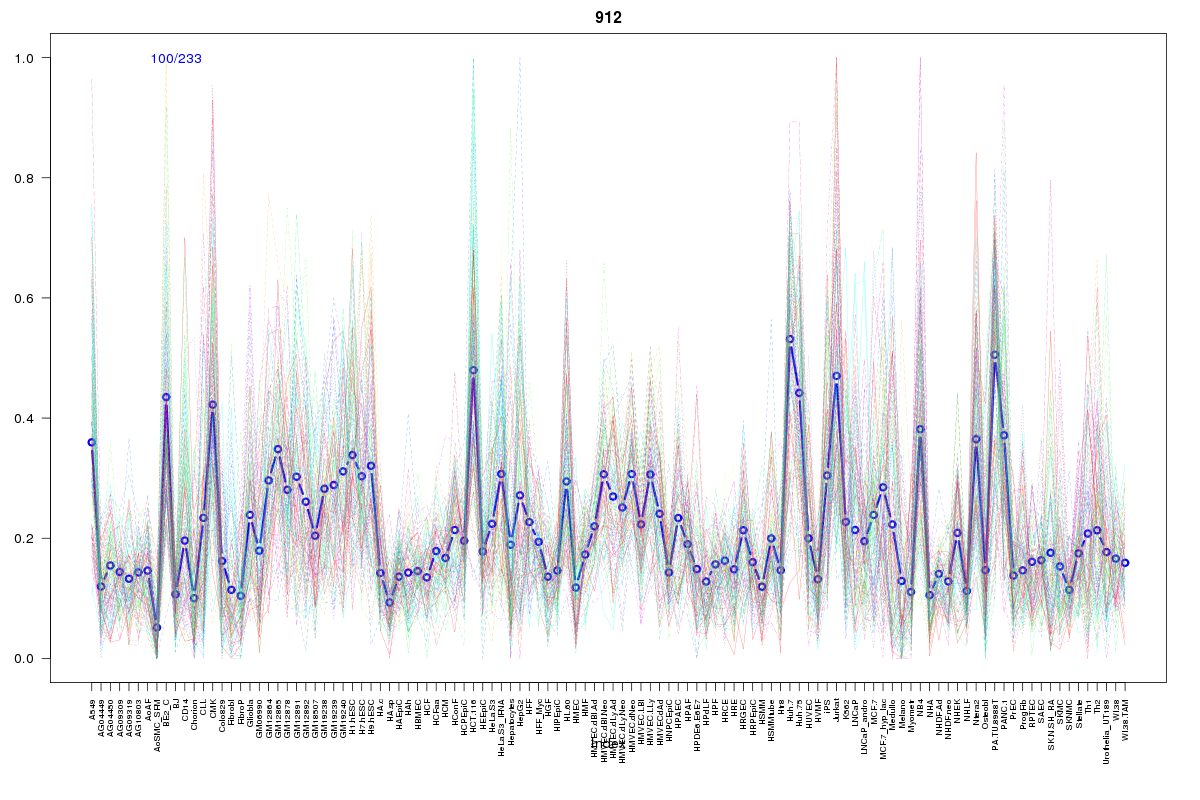 | 912 | 1 |
Resources
BED file downloads
Connects to 31 DHS sitesTop 10 Correlated DHS Sites
p-values indiciate significant higher or lower correlation| Location | Cluster | P-value |
|---|---|---|
| chr1:2733465-2733615 | 860 | 0.003 |
| chr1:2758965-2759115 | 2001 | 0.005 |
| chr1:2580885-2581035 | 2052 | 0.006 |
| chr1:2739985-2740135 | 2052 | 0.007 |
| chr1:2742225-2742375 | 2052 | 0.01 |
| chr1:2539985-2540135 | 2001 | 0.01 |
| chr1:2721825-2721975 | 1078 | 0.024 |
| chr1:2528100-2528250 | 860 | 0.023 |
| chr1:2722425-2722575 | 1078 | 0.022 |
| chr1:2491320-2491470 | 1008 | 0.022 |
| chr1:2572305-2572455 | 1855 | 0.021 |
External Databases
UCSCEnsembl (ENSG00000215912)