Gene: ATAD3C
chr1: 1385068-1405538Expression Profile
(log scale)
Graphical Connections
Distribution of linked clusters:
You may find it interesting if many of the connected DHS sites belong to the same cluster.| Cluster Profile | Cluster ID | Number of DHS sites in this cluster |
|---|---|---|
 | 570 | 6 |
 | 2279 | 3 |
 | 1225 | 2 |
 | 1078 | 2 |
 | 1355 | 2 |
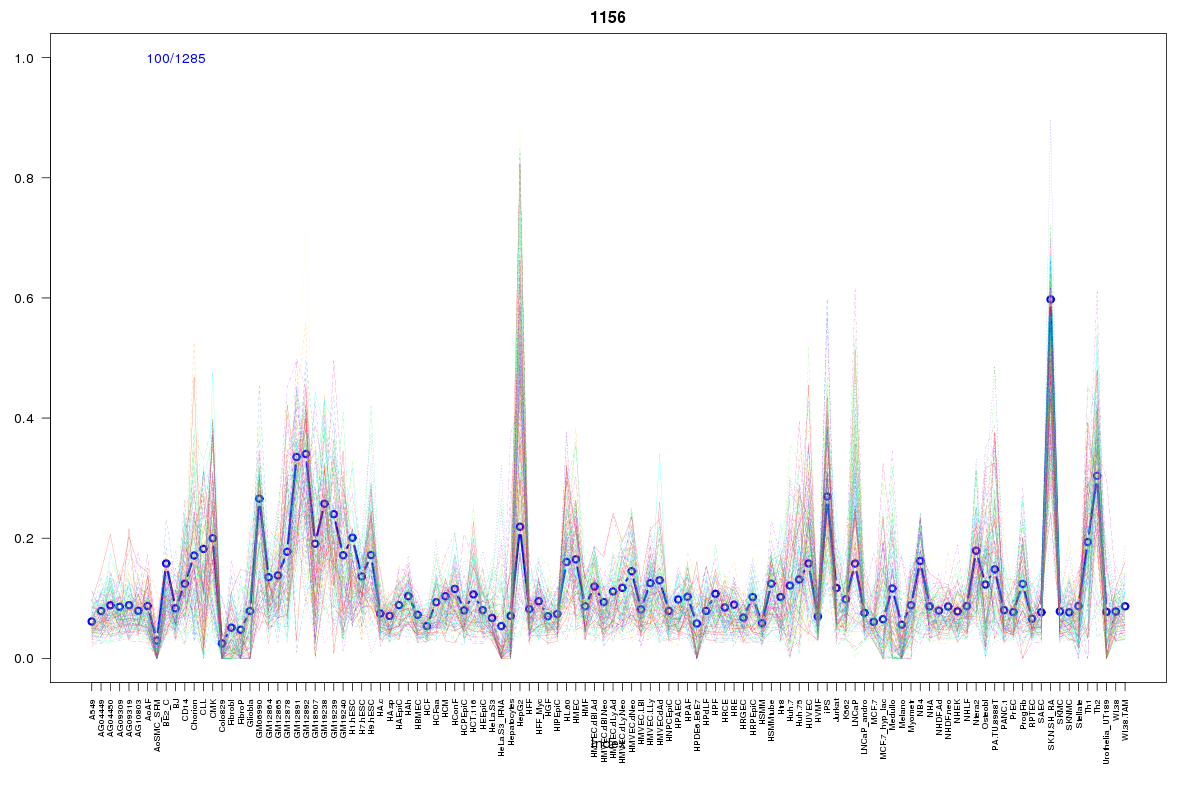 | 1156 | 2 |
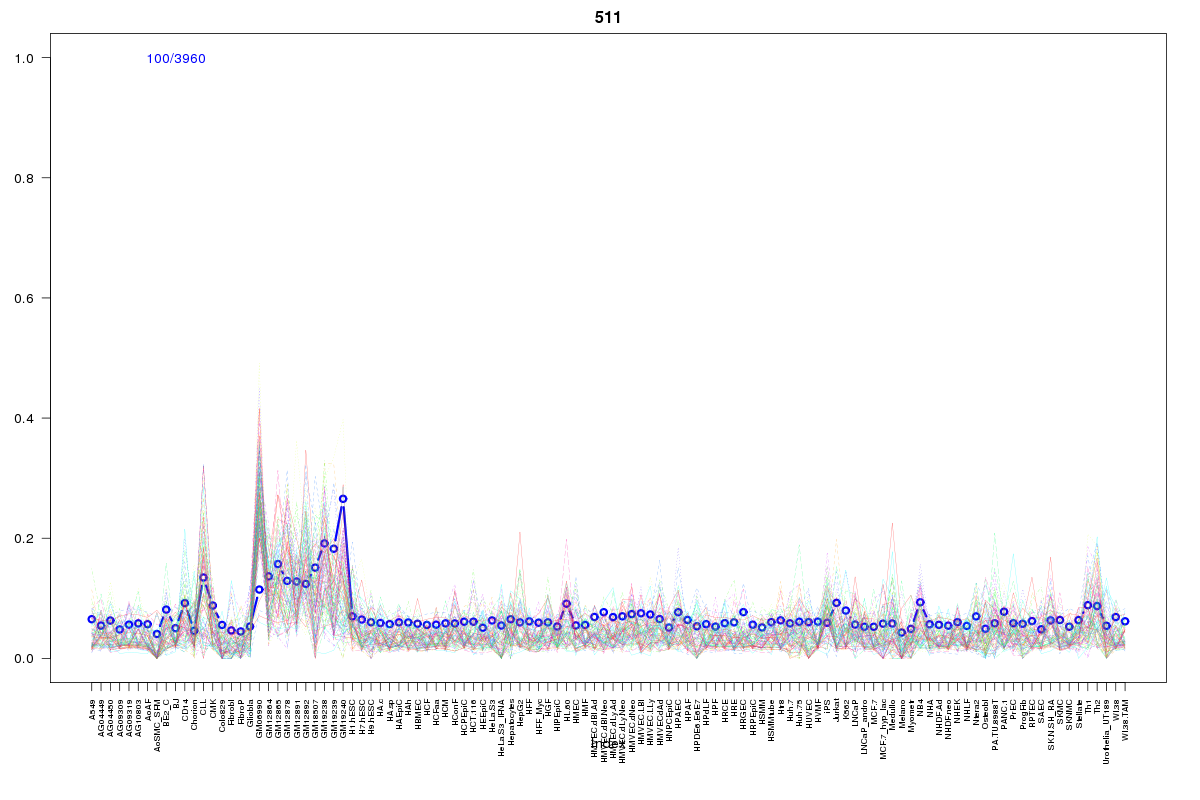 | 511 | 2 |
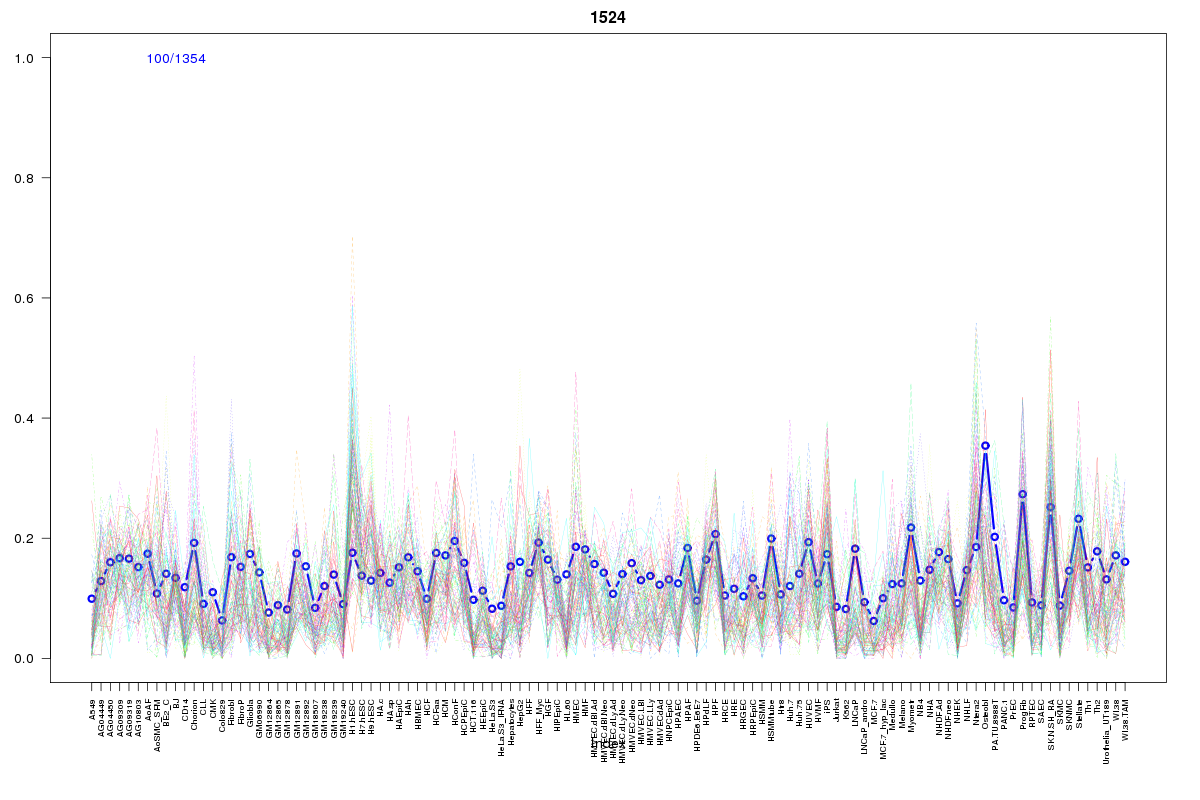 | 1524 | 2 |
 | 568 | 2 |
 | 770 | 2 |
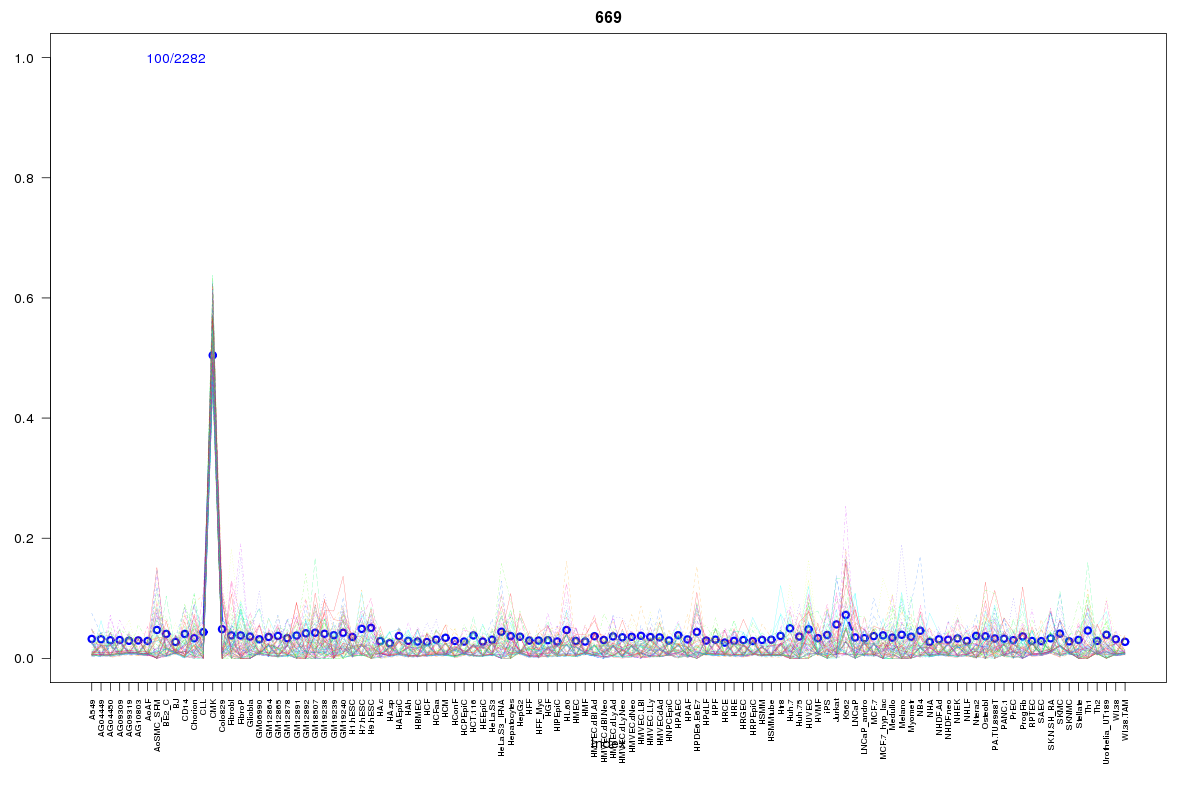 | 669 | 2 |
 | 1115 | 2 |
 | 1604 | 2 |
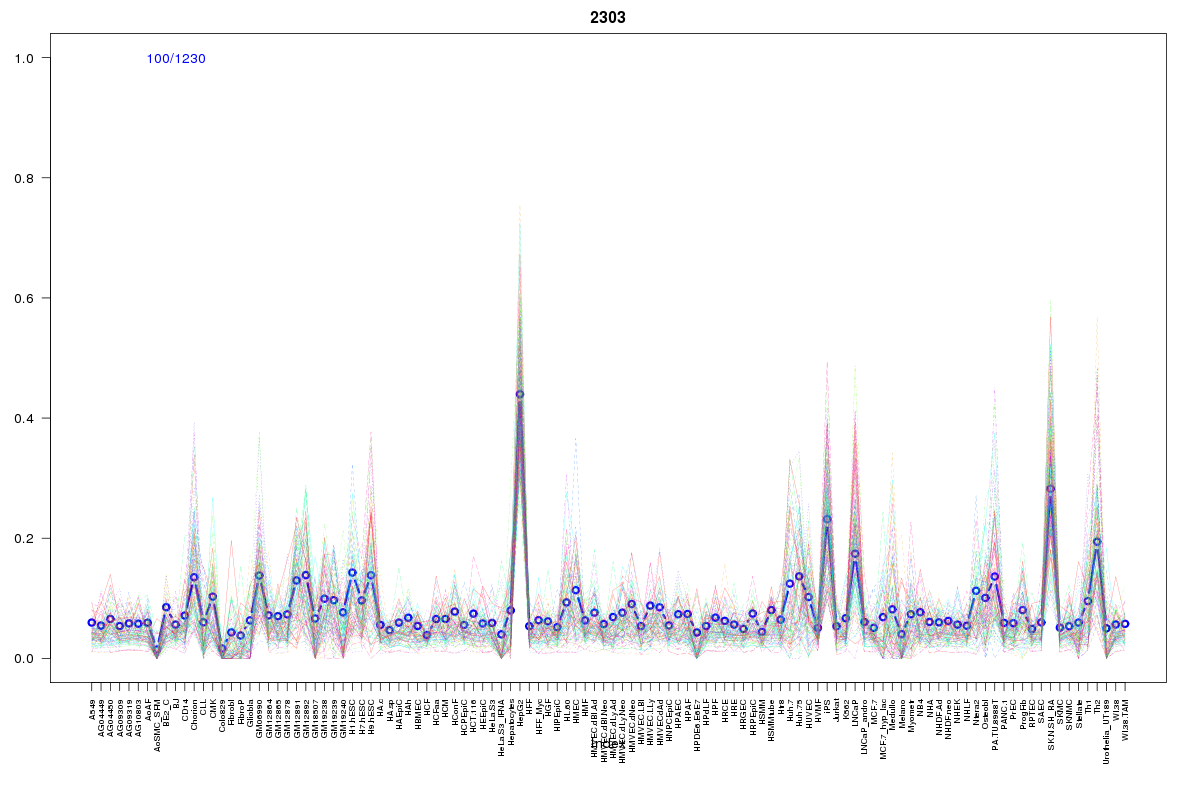 | 2303 | 2 |
 | 569 | 1 |
 | 402 | 1 |
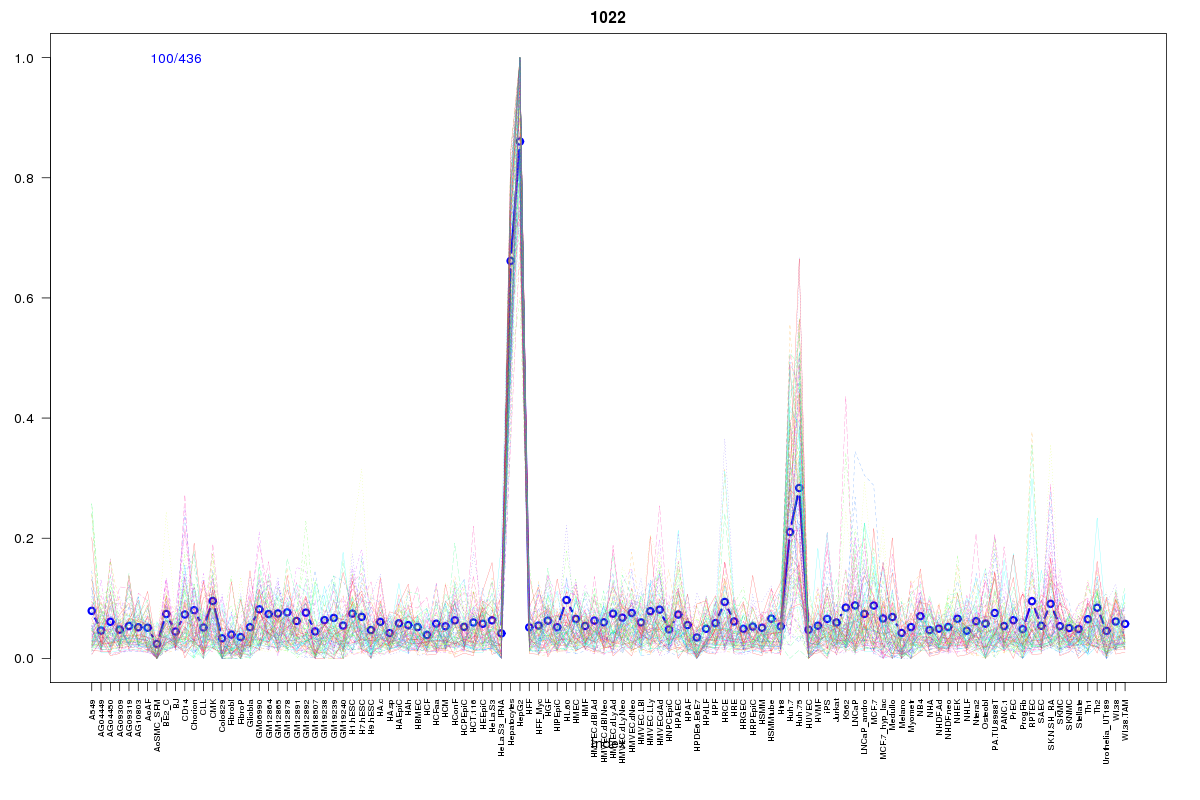 | 1022 | 1 |
 | 1213 | 1 |
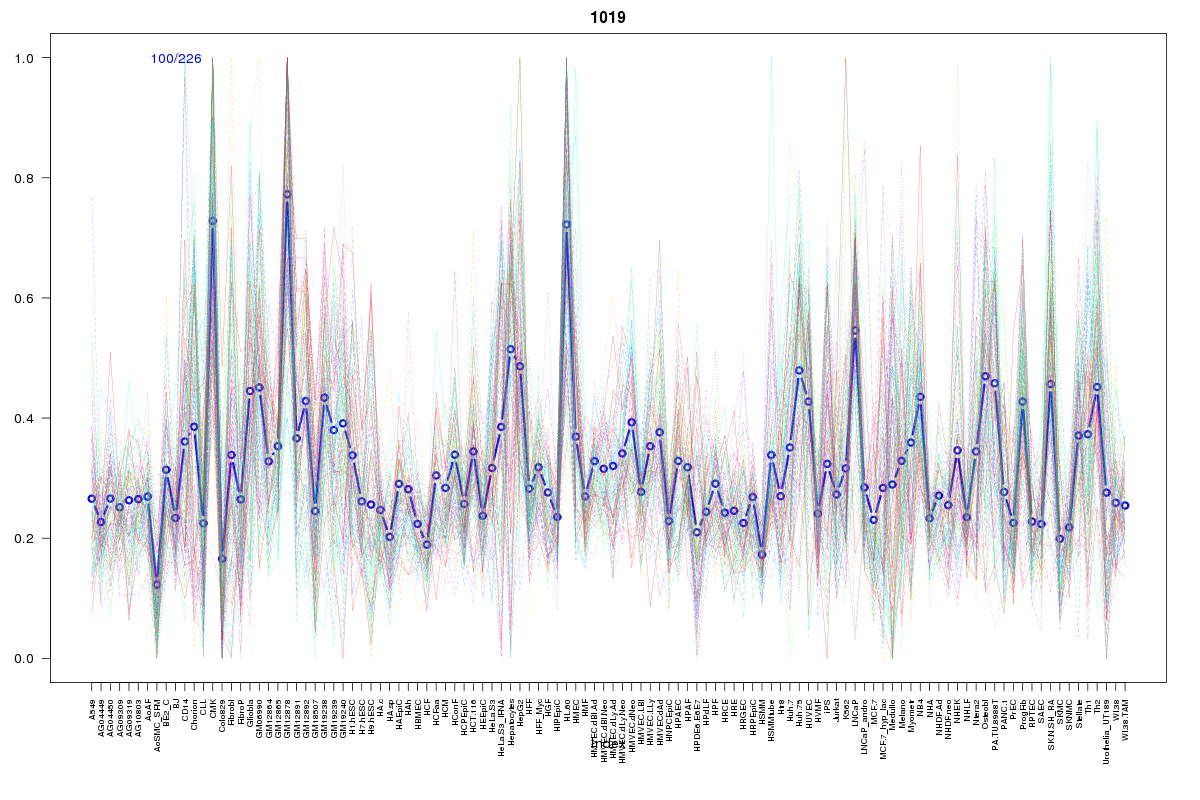 | 1019 | 1 |
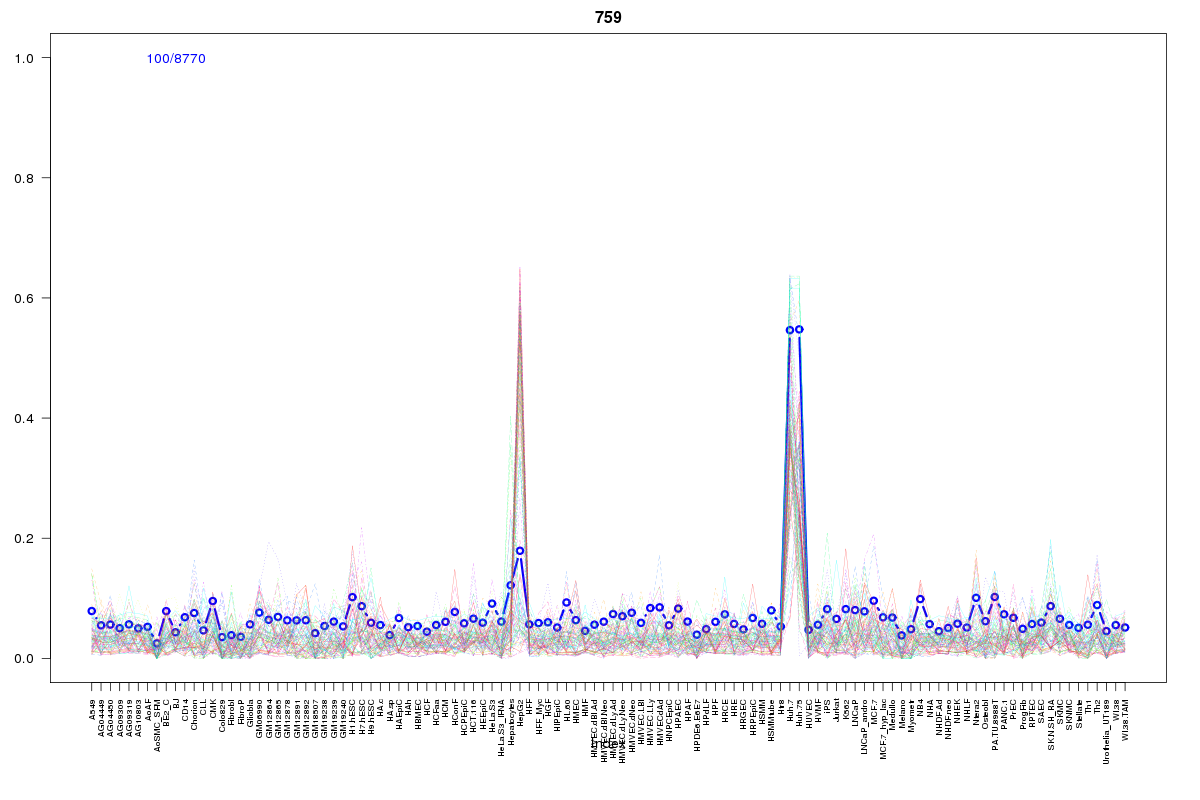 | 759 | 1 |
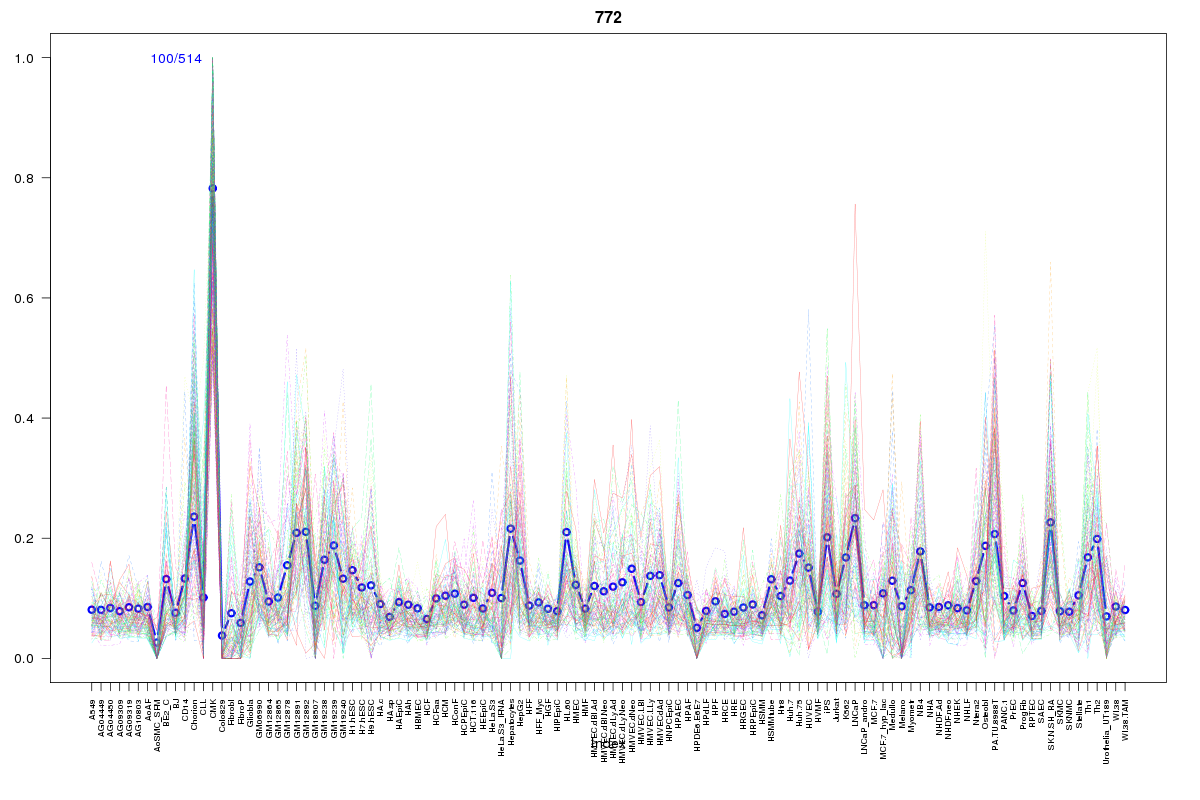 | 772 | 1 |
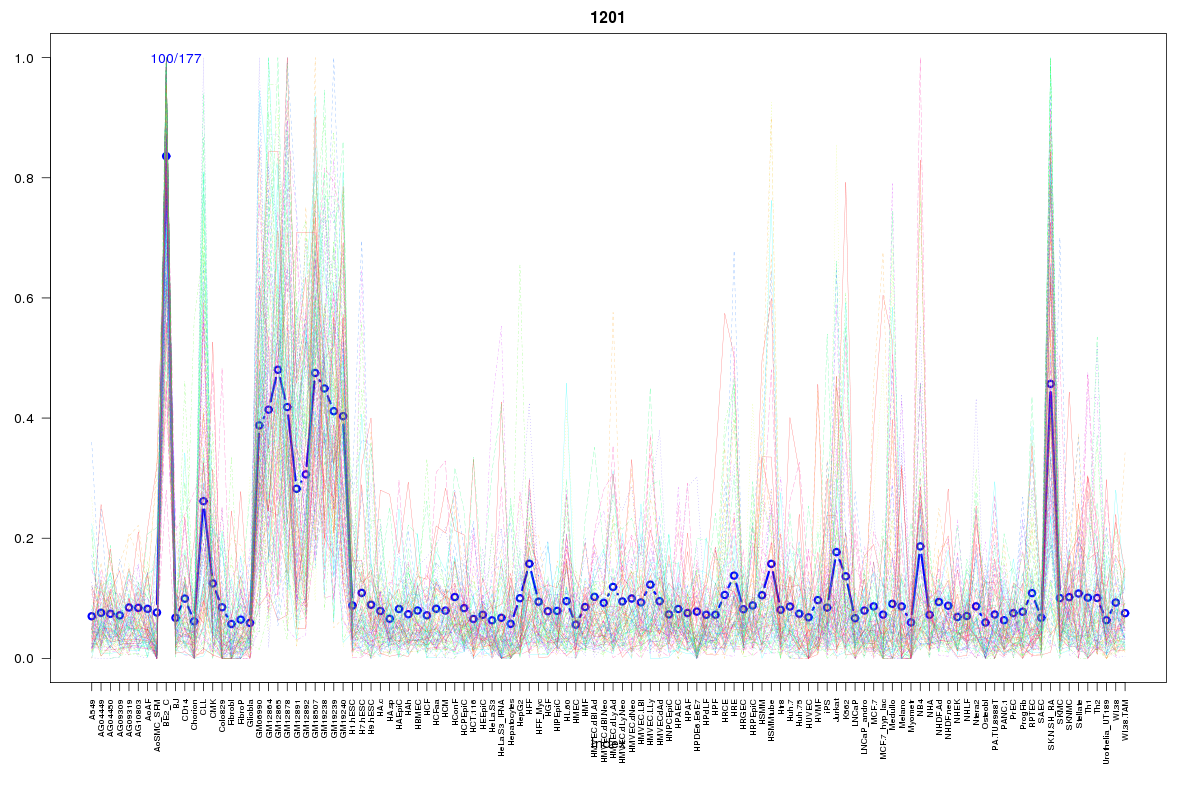 | 1201 | 1 |
 | 2122 | 1 |
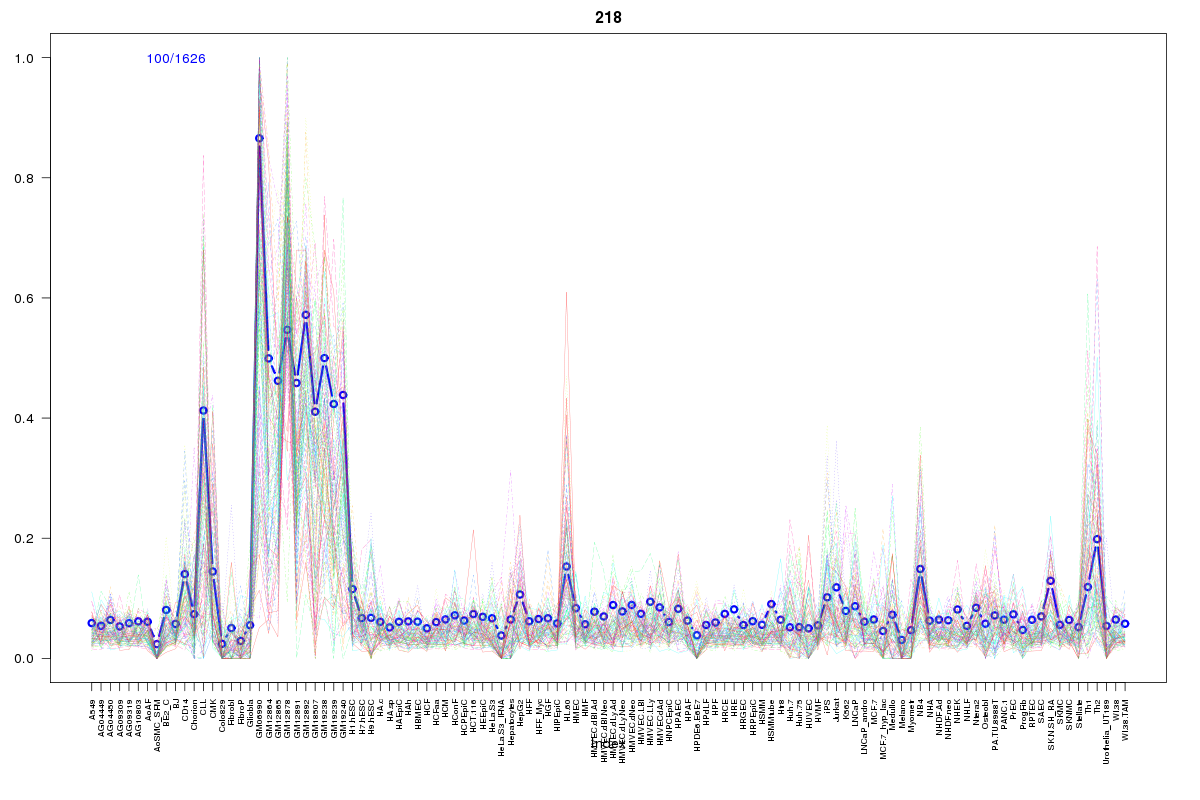 | 218 | 1 |
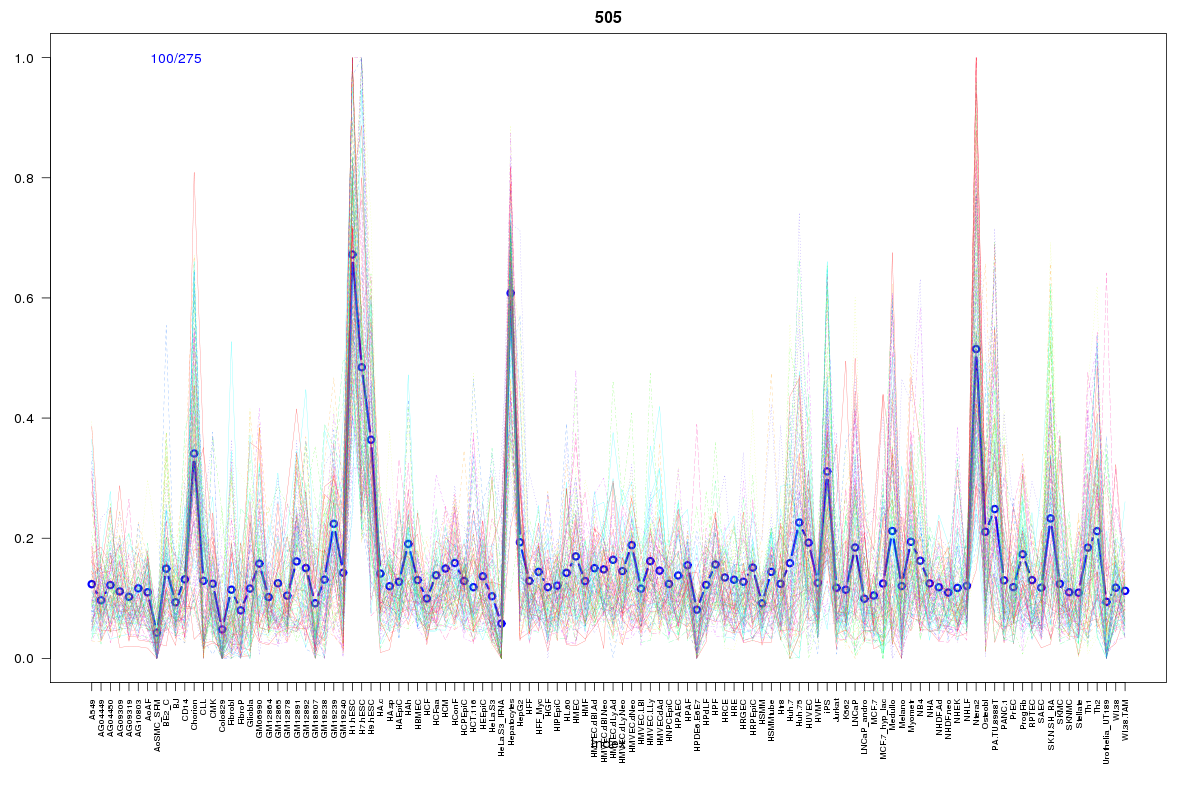 | 505 | 1 |
 | 615 | 1 |
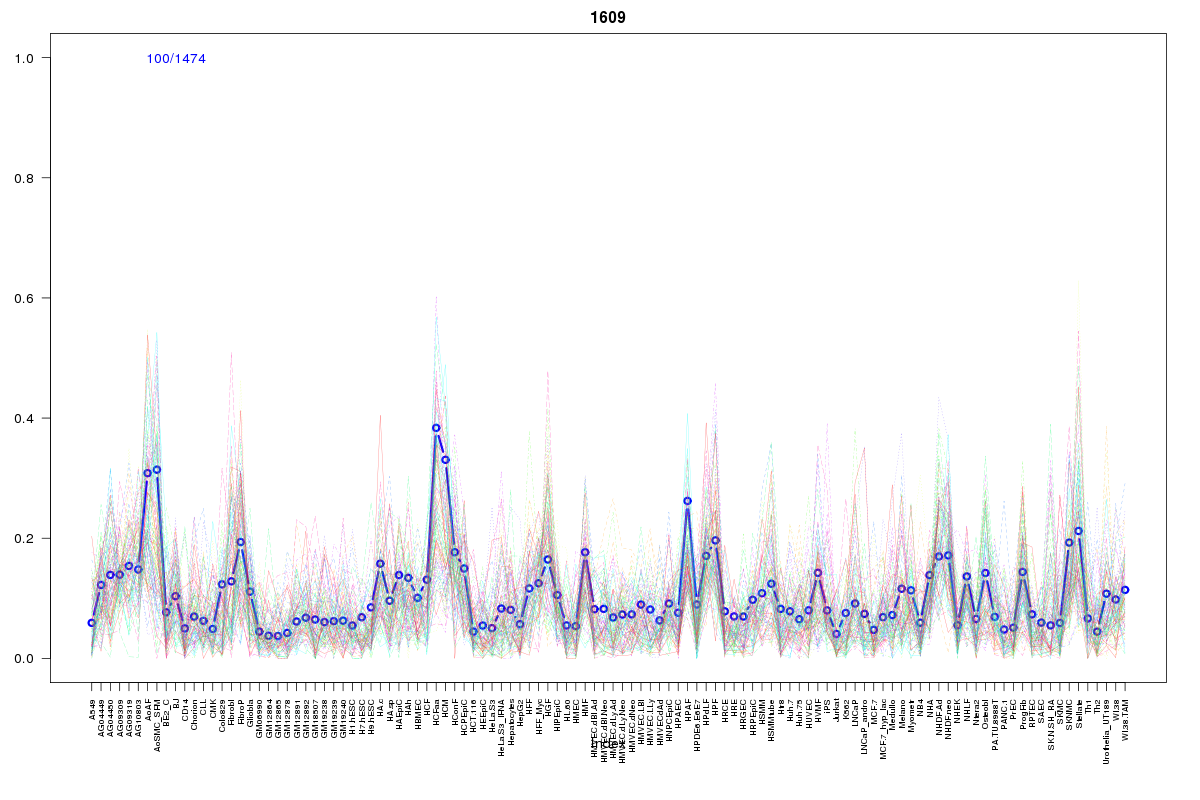 | 1609 | 1 |
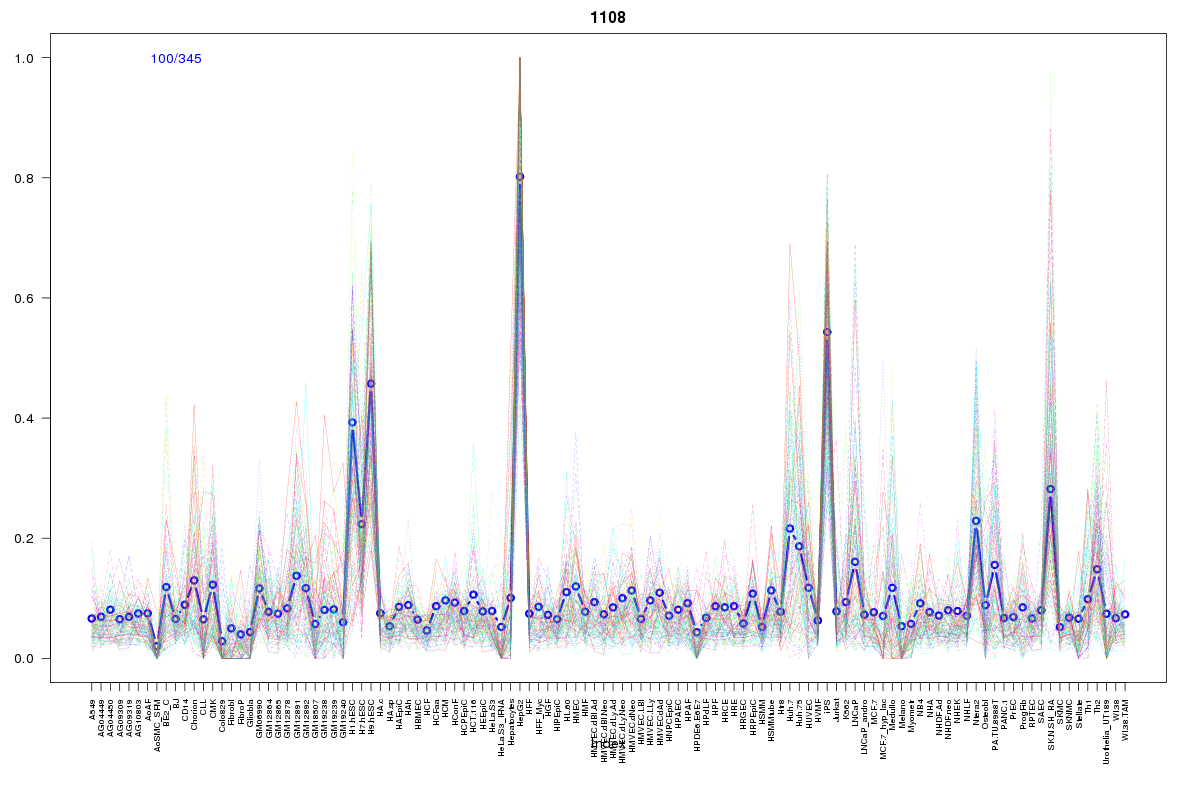 | 1108 | 1 |
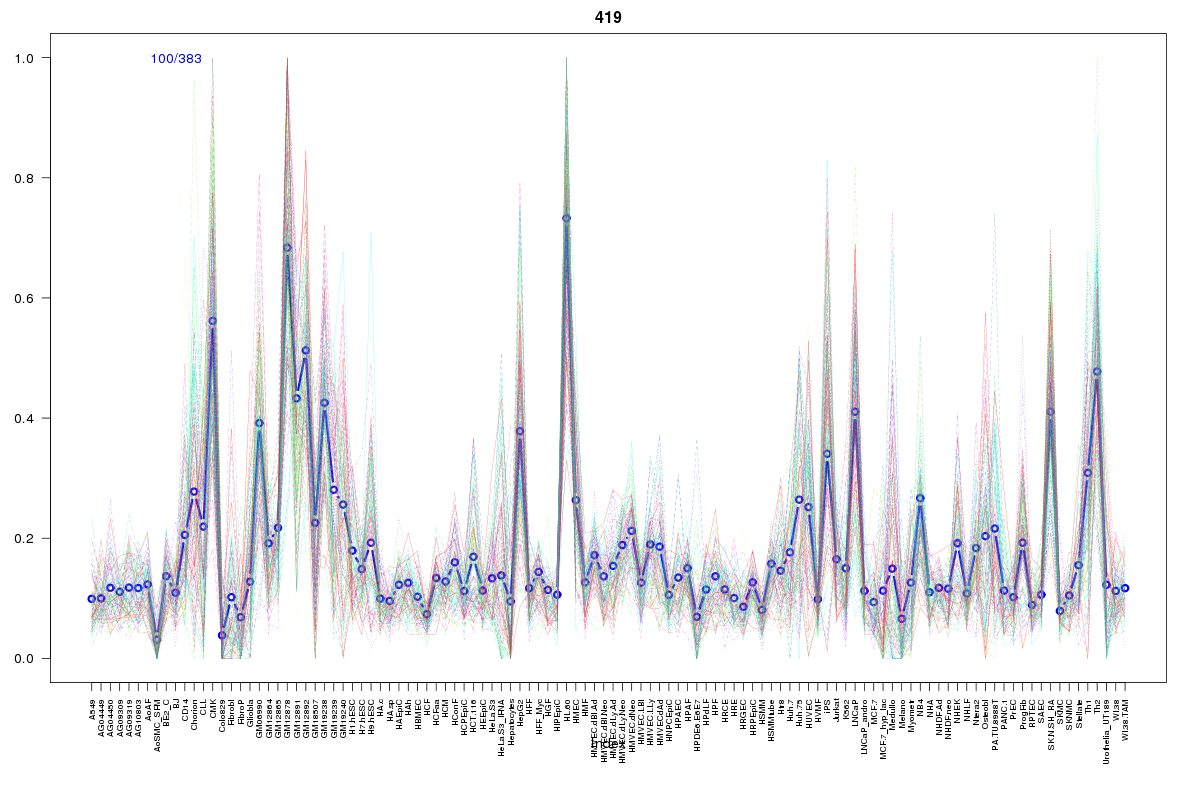 | 419 | 1 |
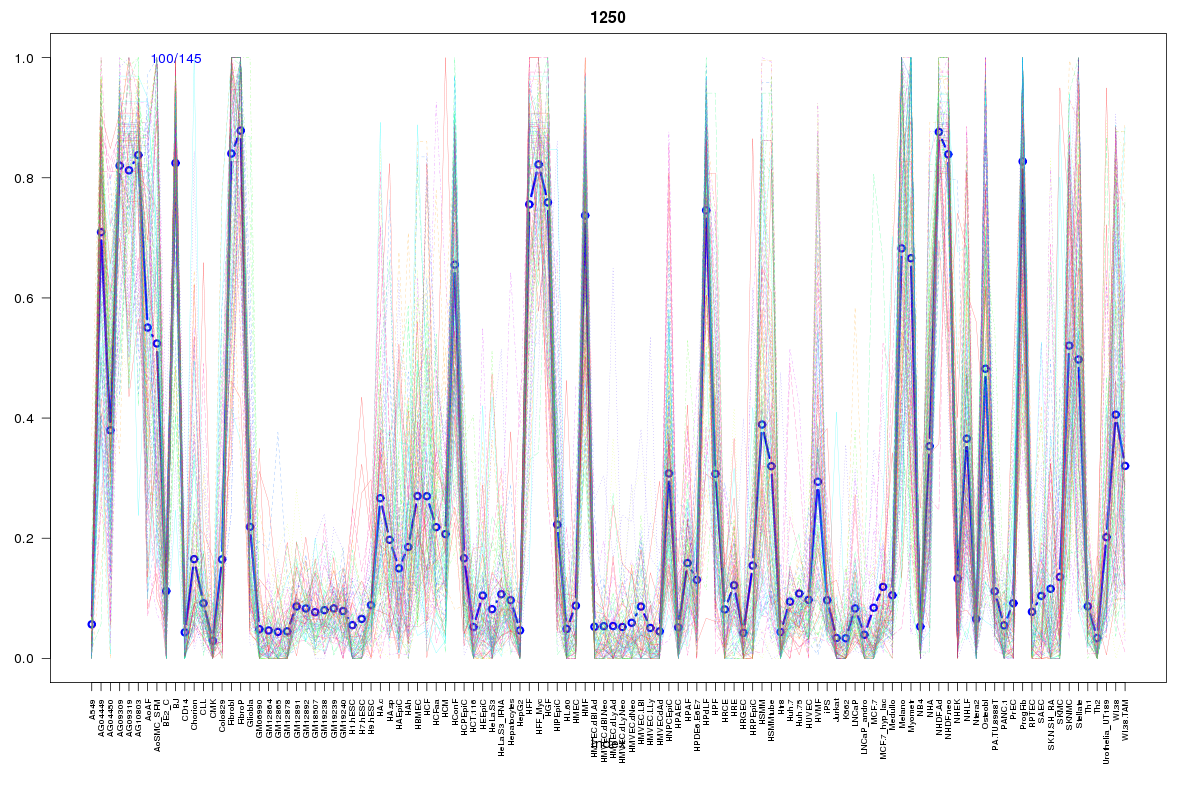 | 1250 | 1 |
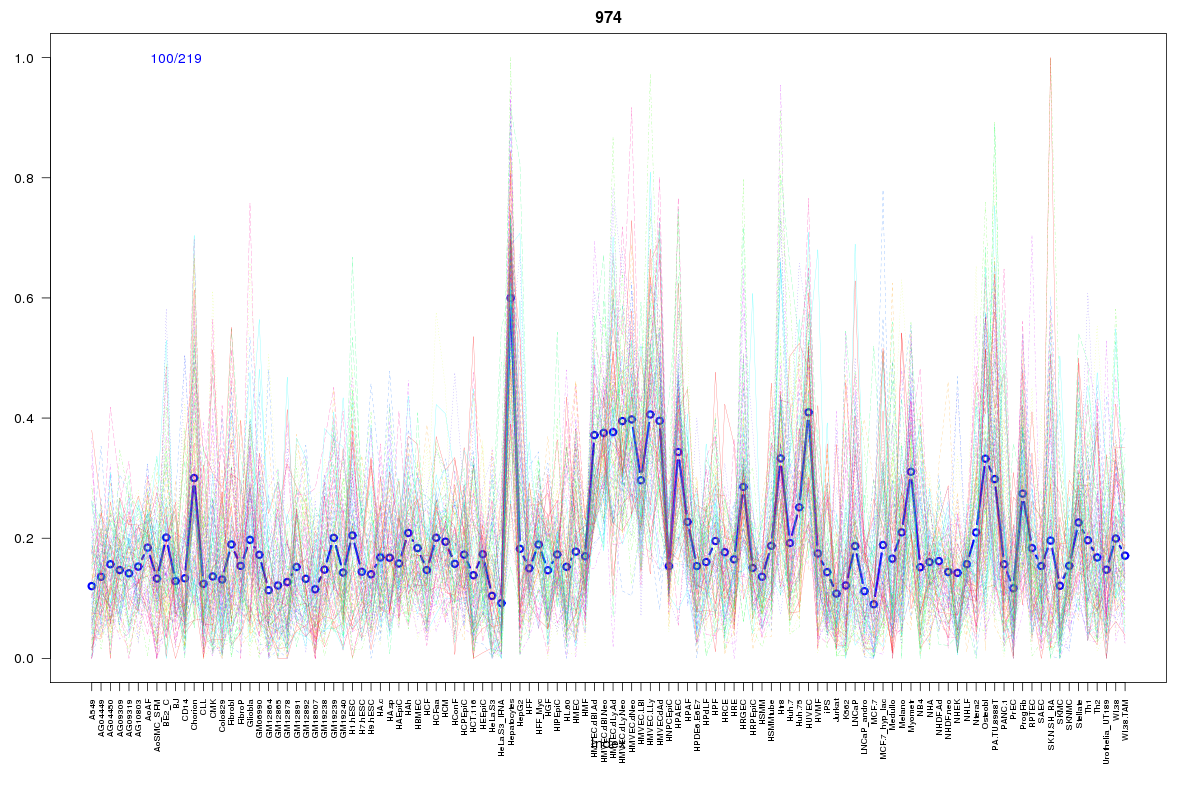 | 974 | 1 |
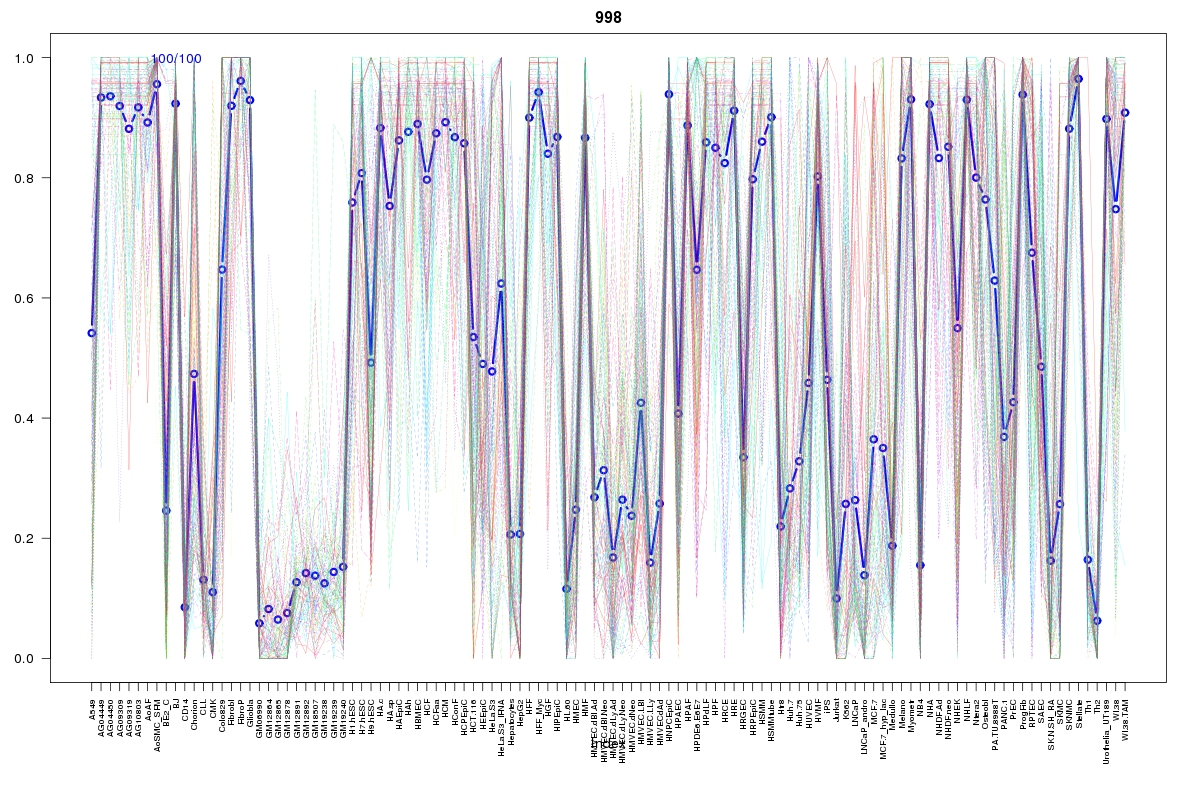 | 998 | 1 |
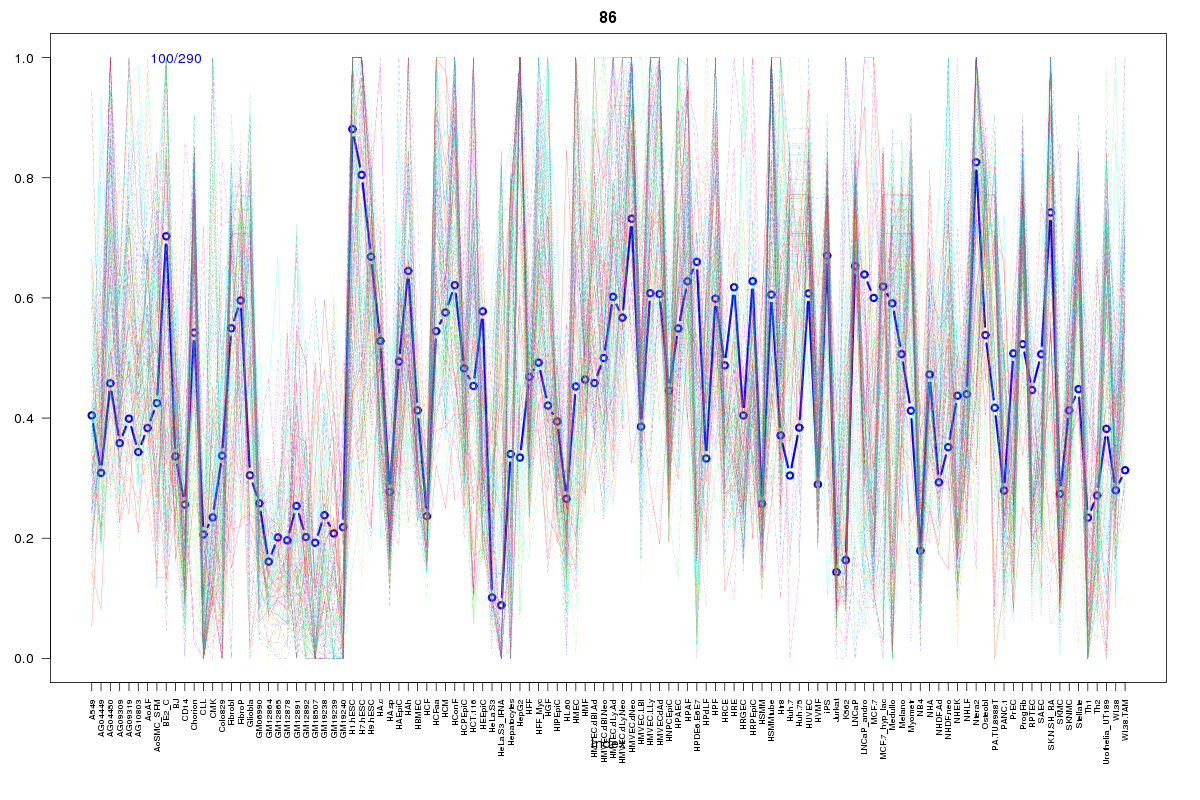 | 86 | 1 |
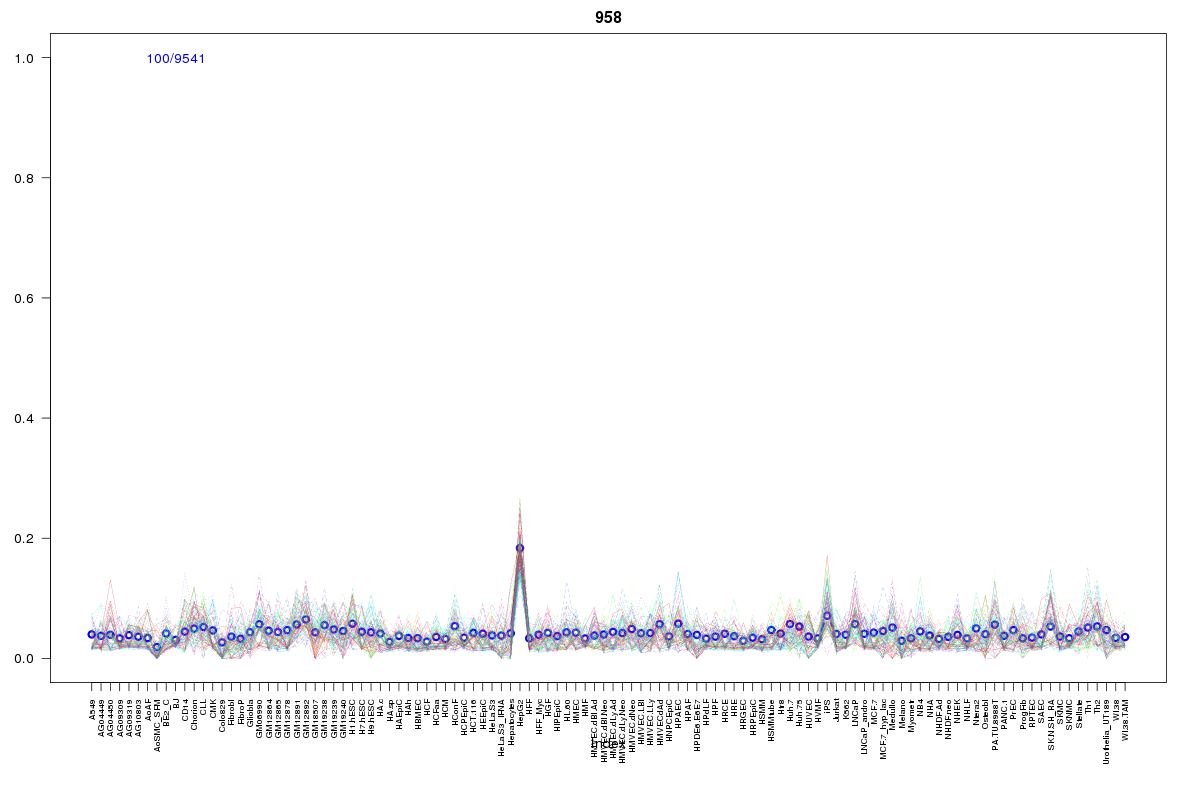 | 958 | 1 |
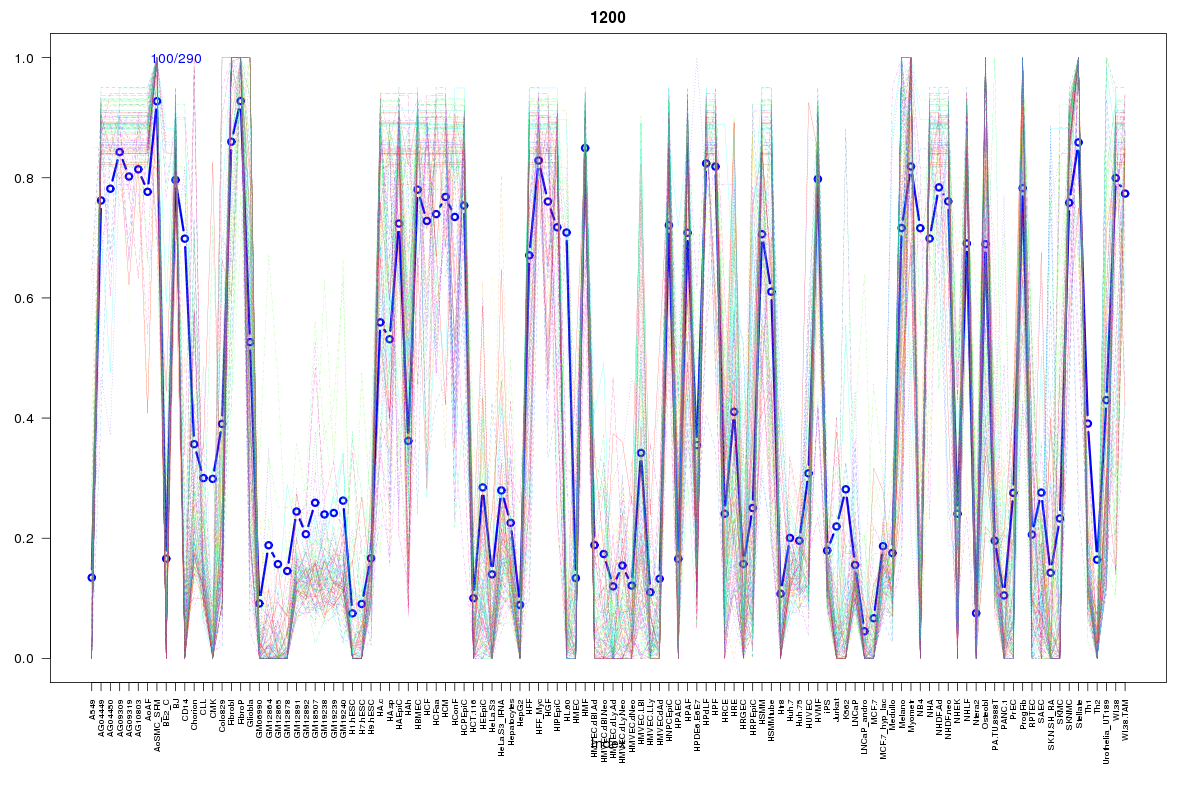 | 1200 | 1 |
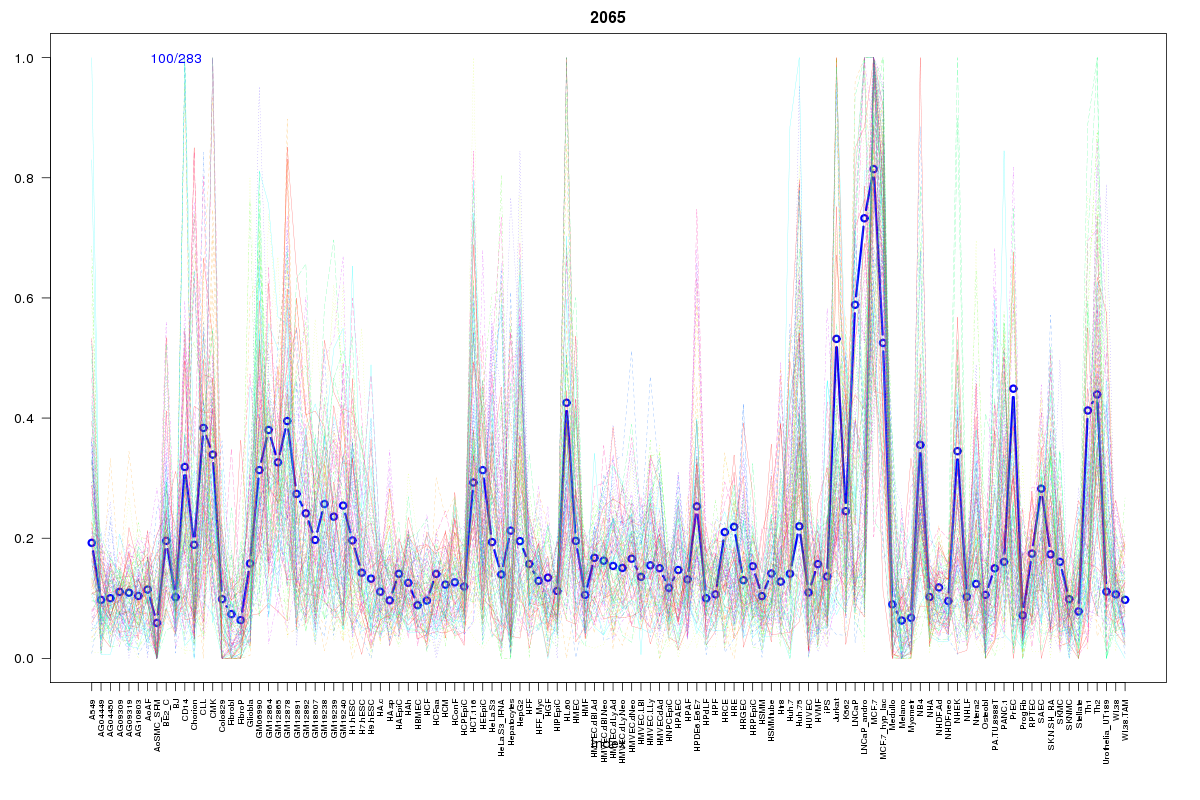 | 2065 | 1 |
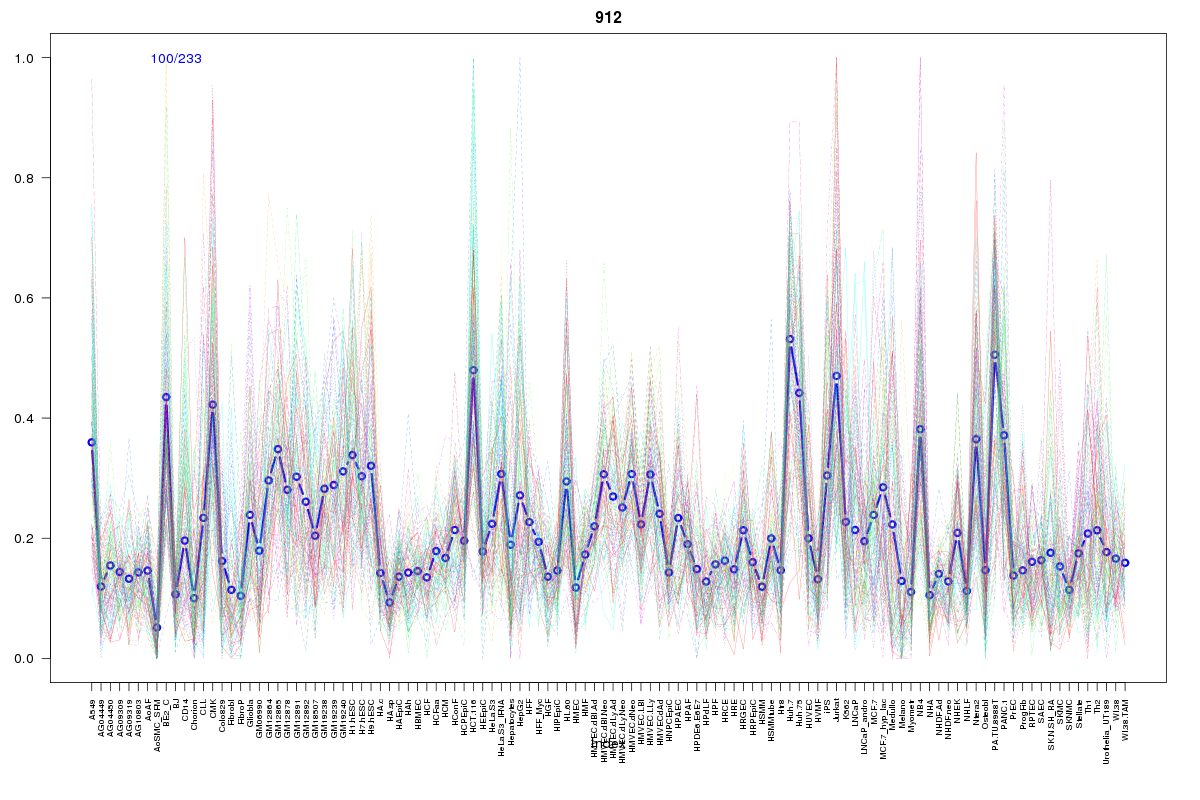 | 912 | 1 |
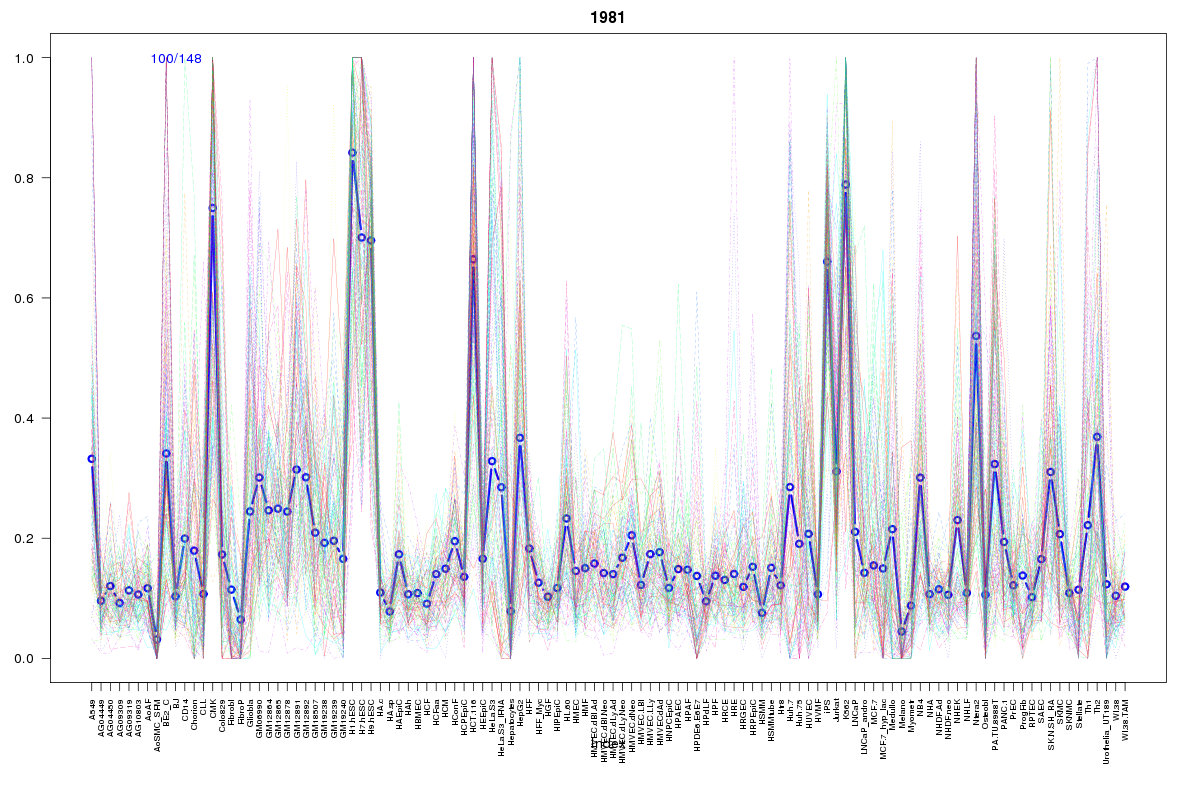 | 1981 | 1 |
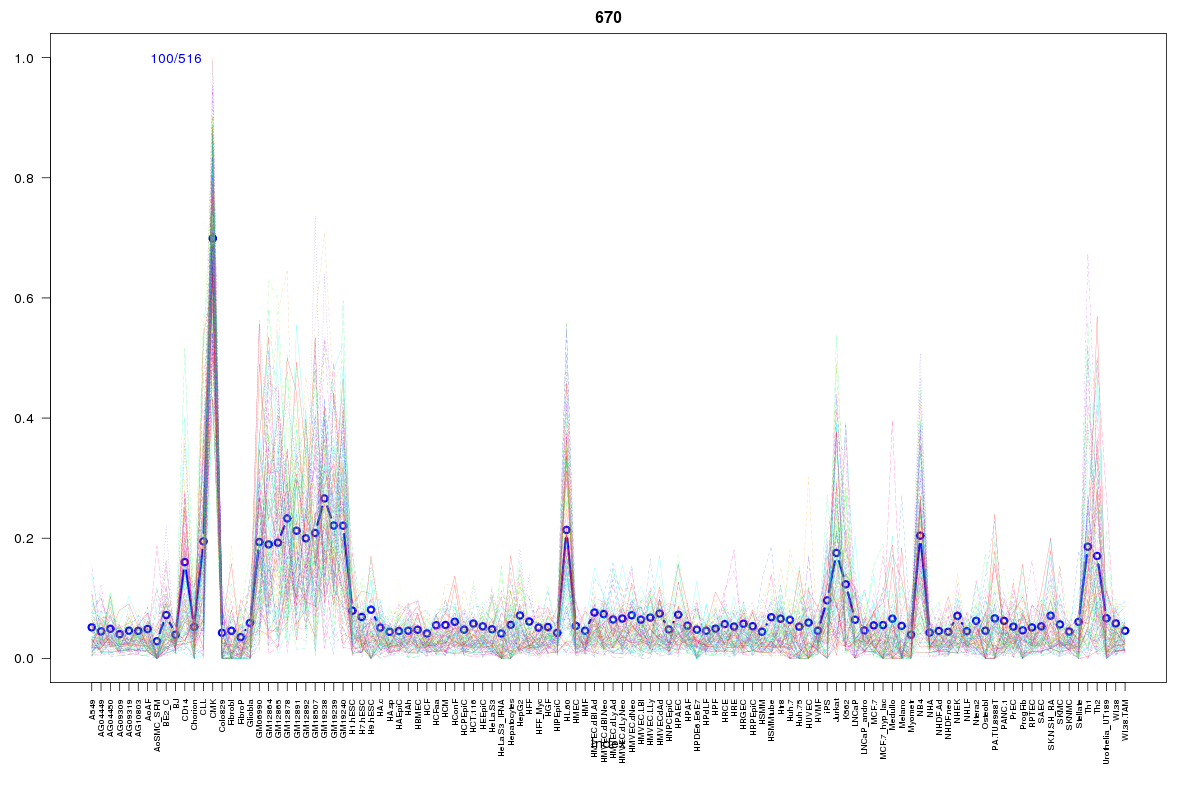 | 670 | 1 |
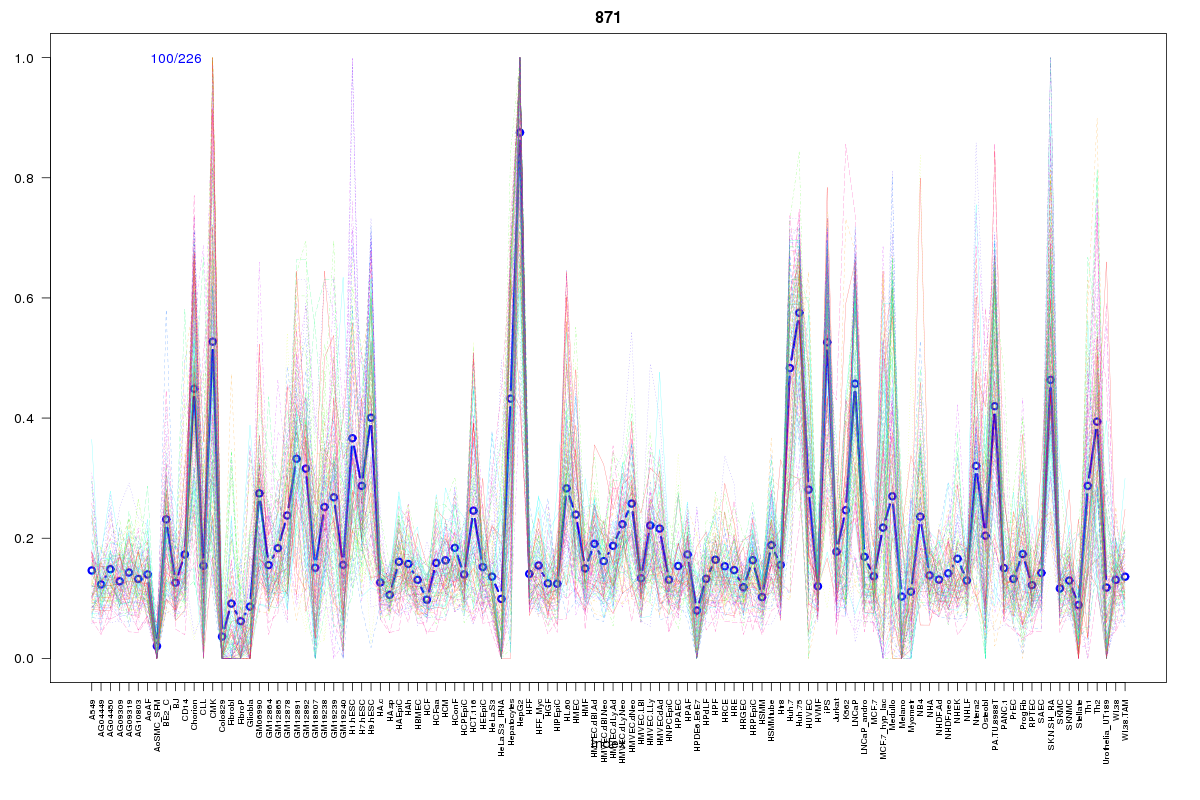 | 871 | 1 |
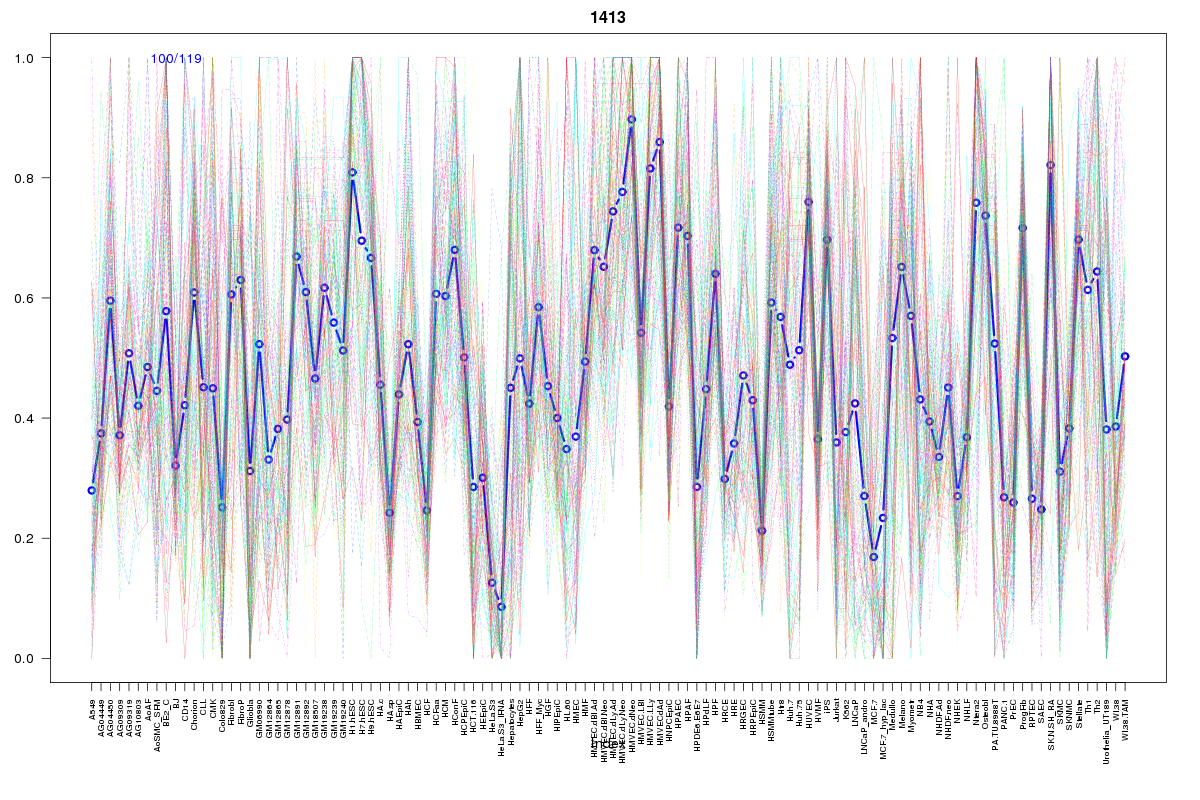 | 1413 | 1 |
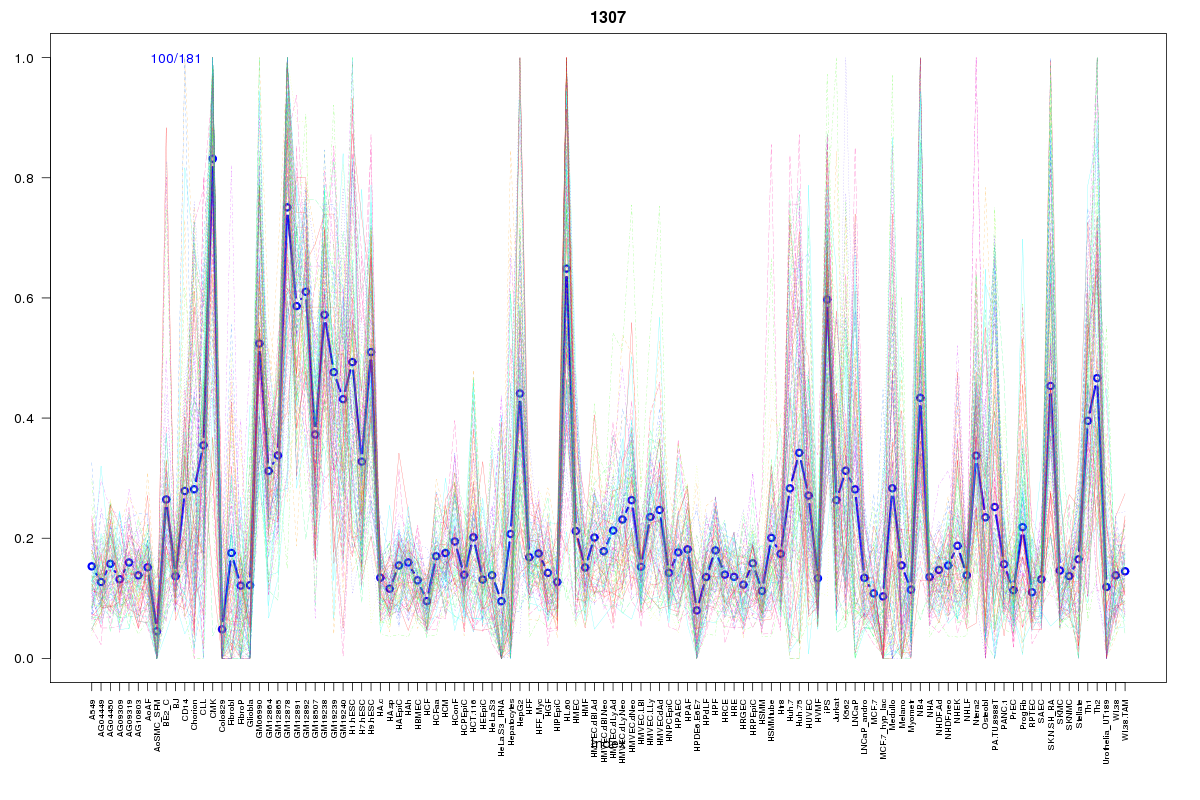 | 1307 | 1 |
 | 881 | 1 |
Resources
BED file downloads
Connects to 62 DHS sitesTop 10 Correlated DHS Sites
p-values indiciate significant higher or lower correlation| Location | Cluster | P-value |
|---|---|---|
| chr1:1361905-1362055 | 2279 | 0.001 |
| chr1:1366520-1366670 | 770 | 0.001 |
| chr1:1336680-1336830 | 570 | 0.001 |
| chr1:1373520-1373670 | 1019 | 0.001 |
| chr1:1368885-1369035 | 871 | 0.001 |
| chr1:1336305-1336455 | 1022 | 0.002 |
| chr1:1368225-1368375 | 2303 | 0.002 |
| chr1:1368425-1368575 | 1115 | 0.002 |
| chr1:1311720-1311870 | 670 | 0.002 |
| chr1:1373725-1373875 | 772 | 0.002 |
| chr1:1495740-1495890 | 568 | 0.002 |
External Databases
UCSCEnsembl (ENSG00000215915)