Gene: RP11-269F19.2
chr1: 45224708-45227849Expression Profile
(log scale)
Graphical Connections
Distribution of linked clusters:
You may find it interesting if many of the connected DHS sites belong to the same cluster.| Cluster Profile | Cluster ID | Number of DHS sites in this cluster |
|---|---|---|
 | 2062 | 3 |
 | 66 | 2 |
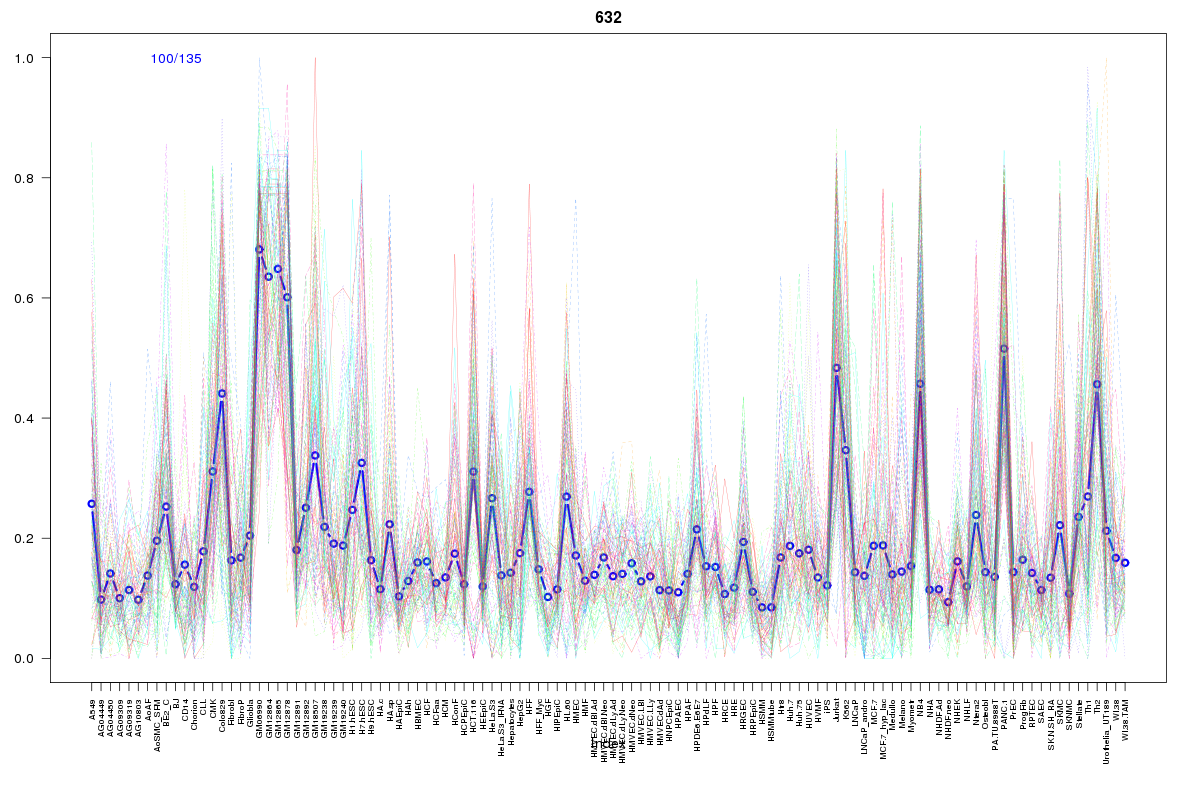 | 632 | 2 |
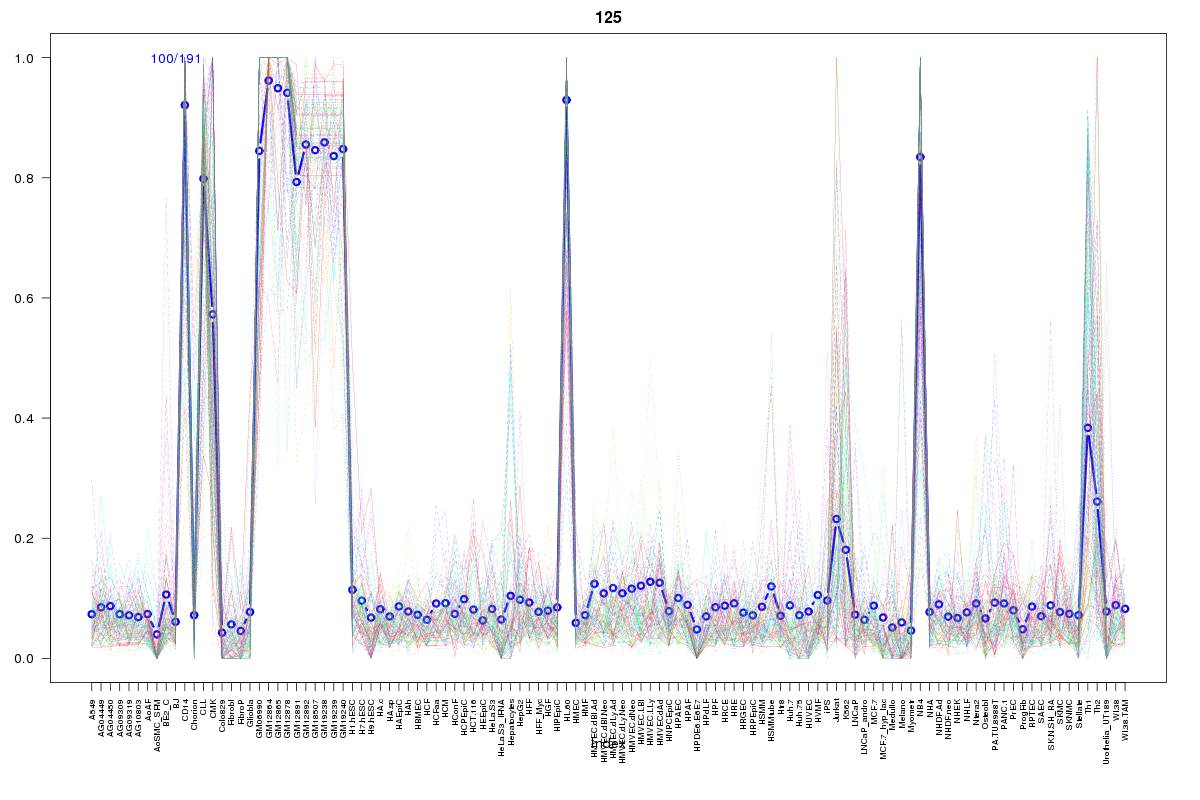 | 125 | 1 |
 | 2072 | 1 |
 | 2052 | 1 |
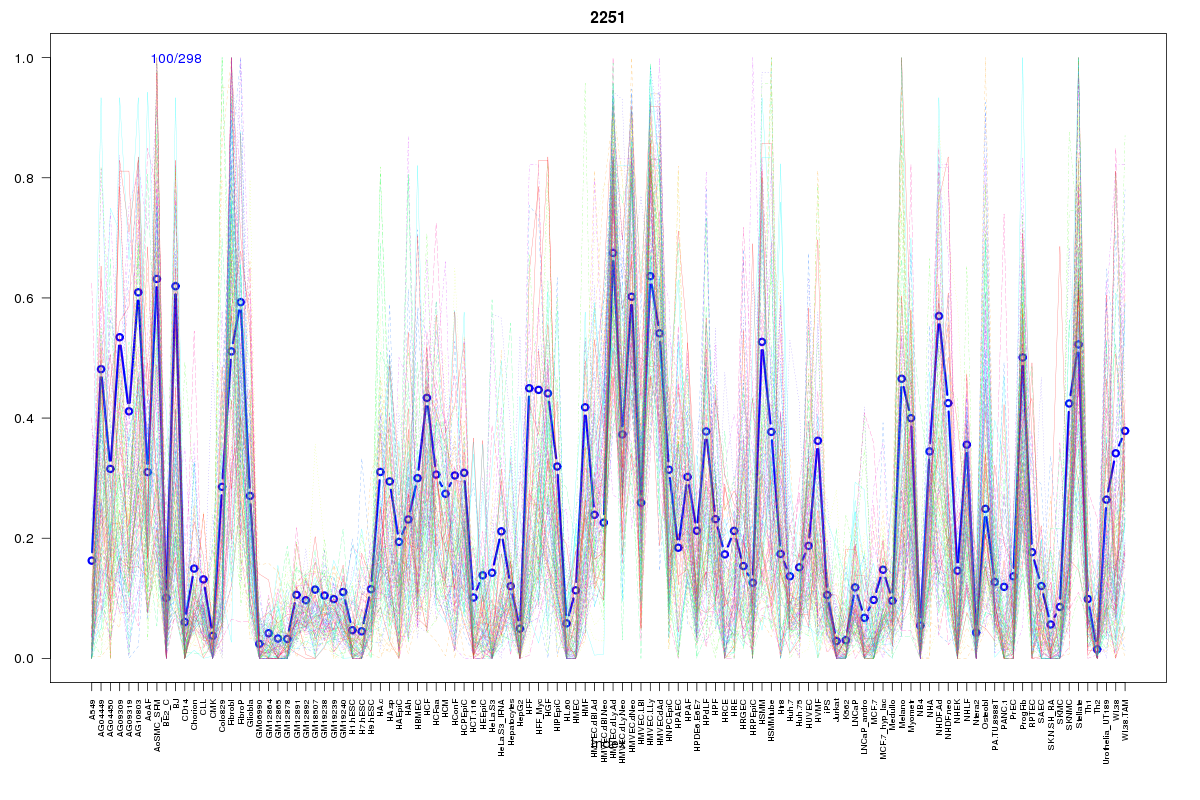 | 2251 | 1 |
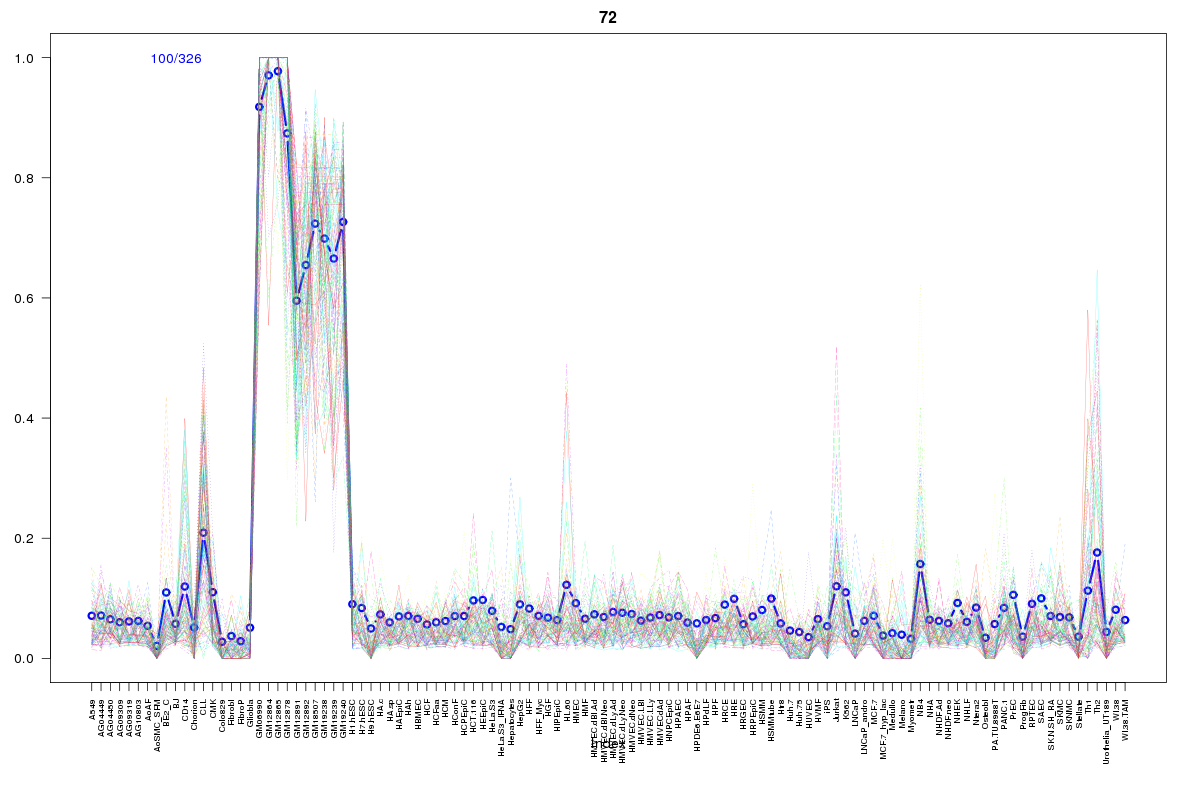 | 72 | 1 |
 | 421 | 1 |
 | 274 | 1 |
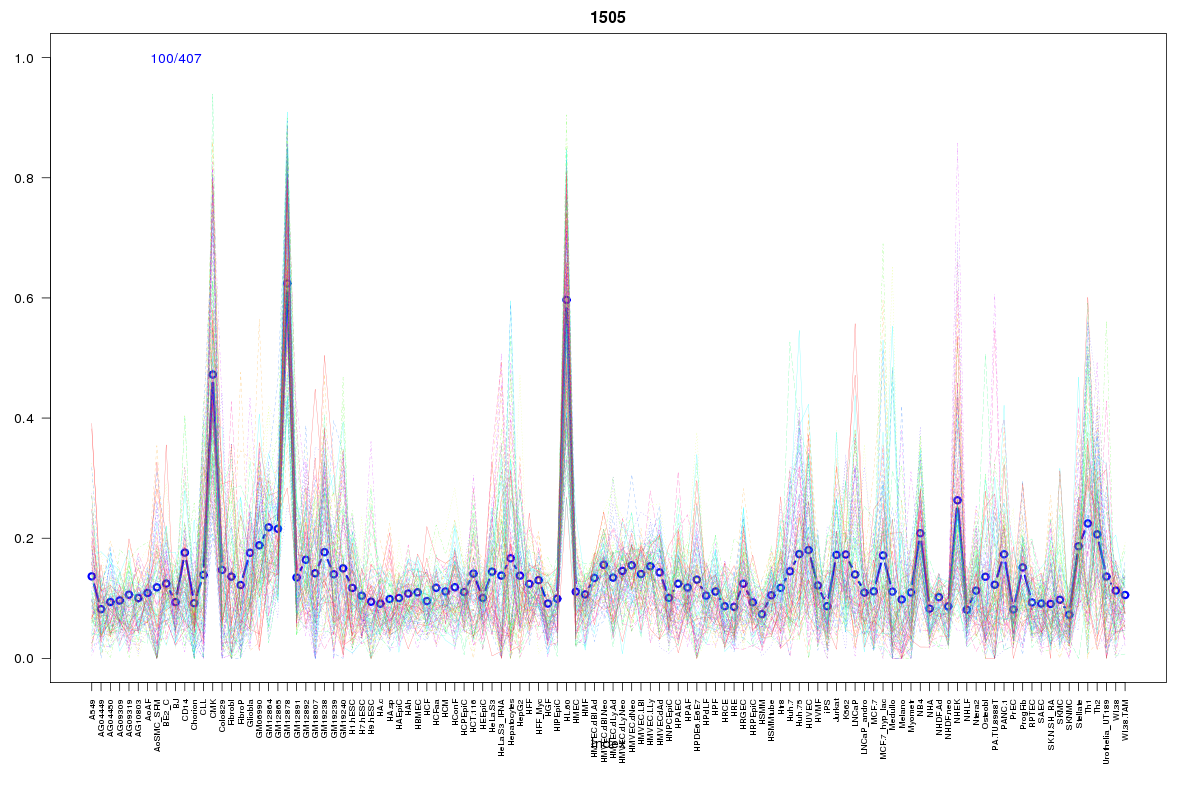 | 1505 | 1 |
 | 2211 | 1 |
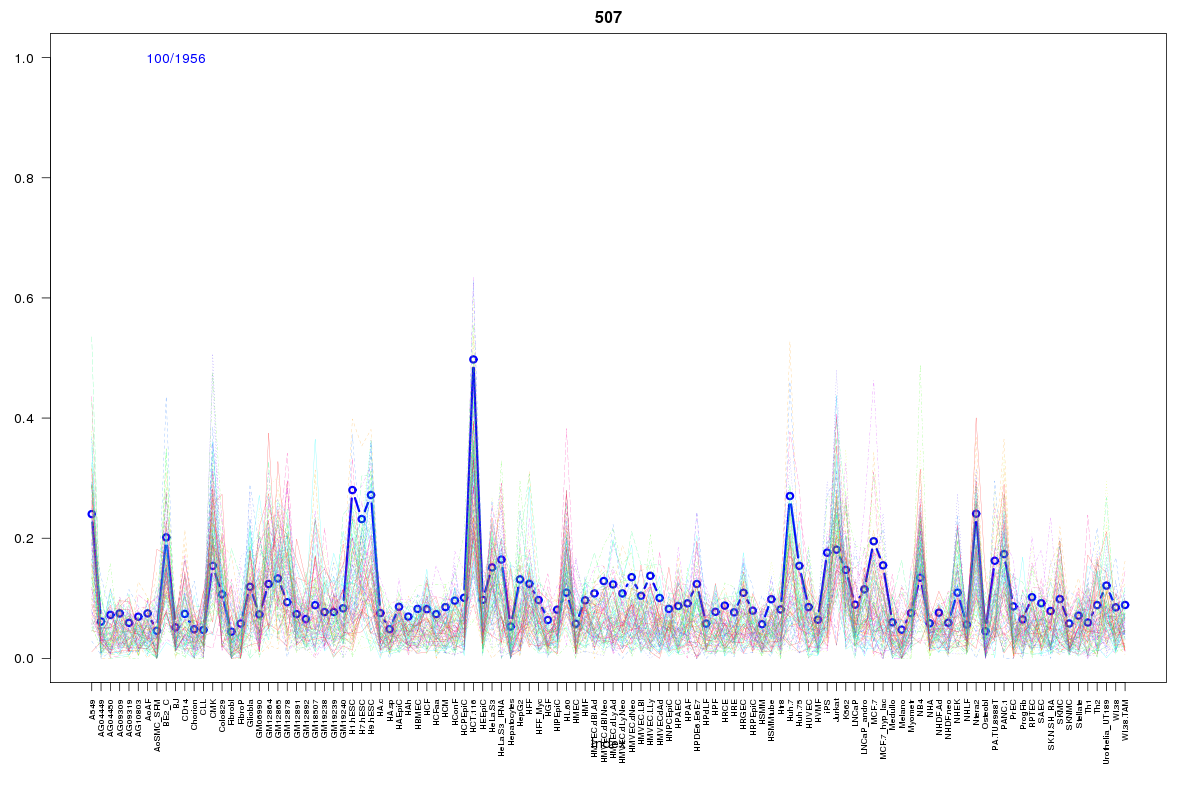 | 507 | 1 |
 | 1457 | 1 |
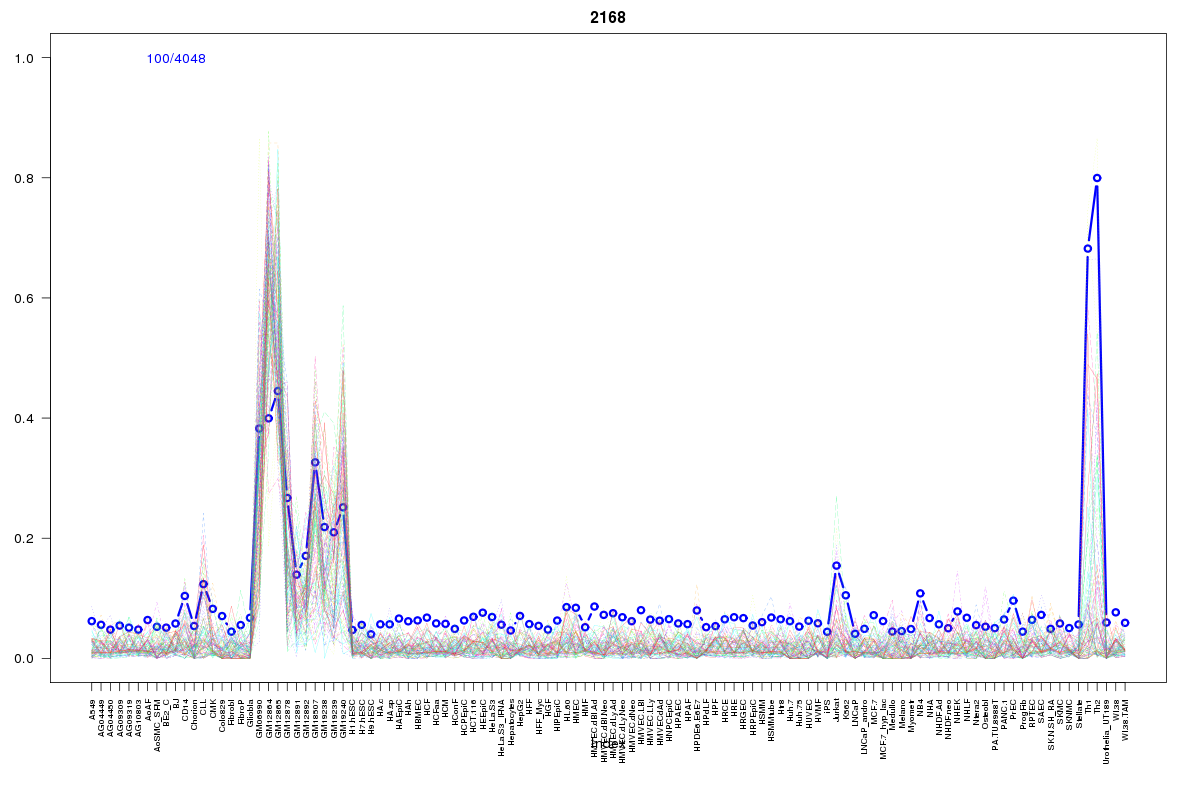 | 2168 | 1 |
 | 1970 | 1 |
 | 2170 | 1 |
 | 615 | 1 |
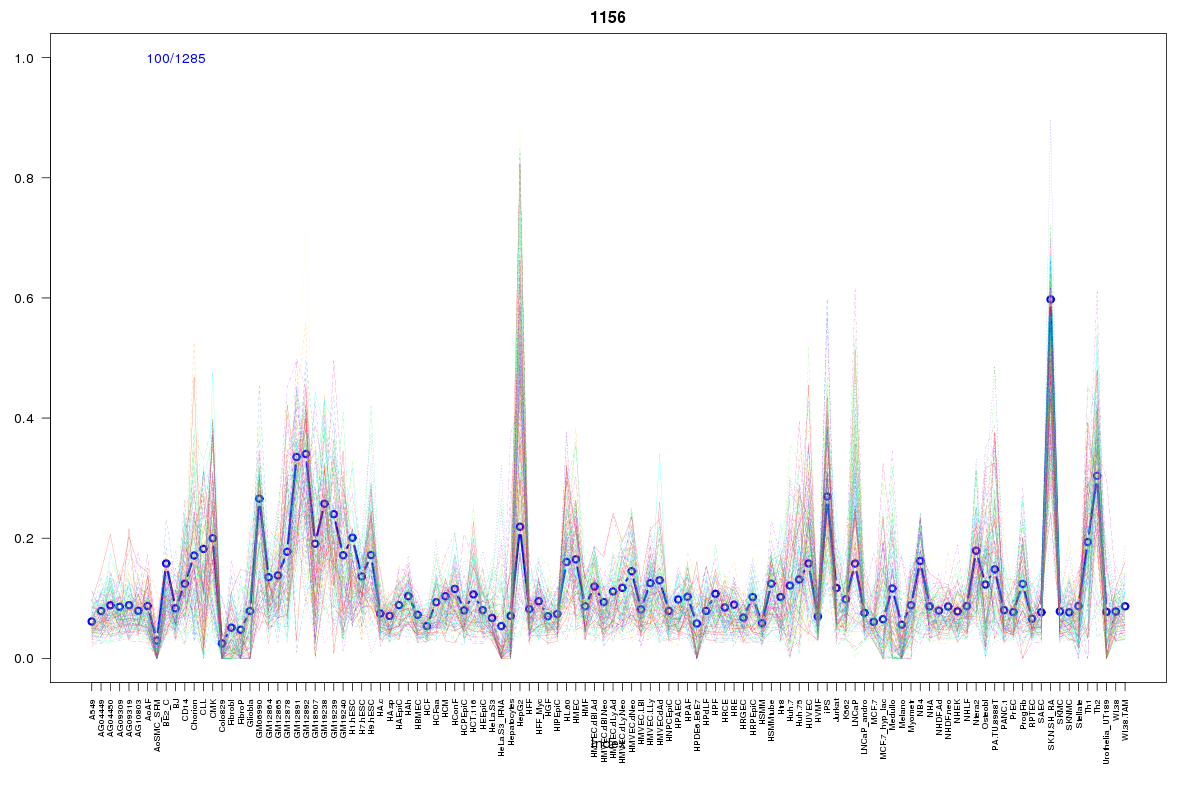 | 1156 | 1 |
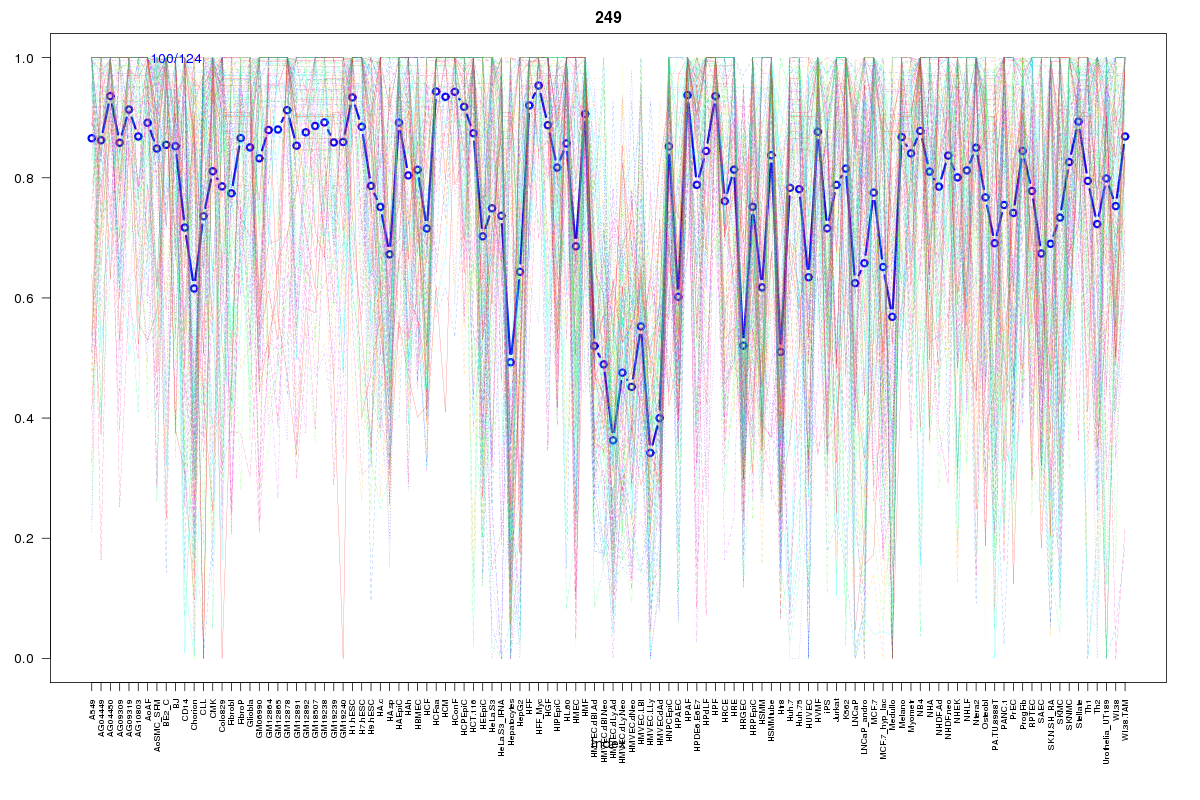 | 249 | 1 |
 | 1605 | 1 |
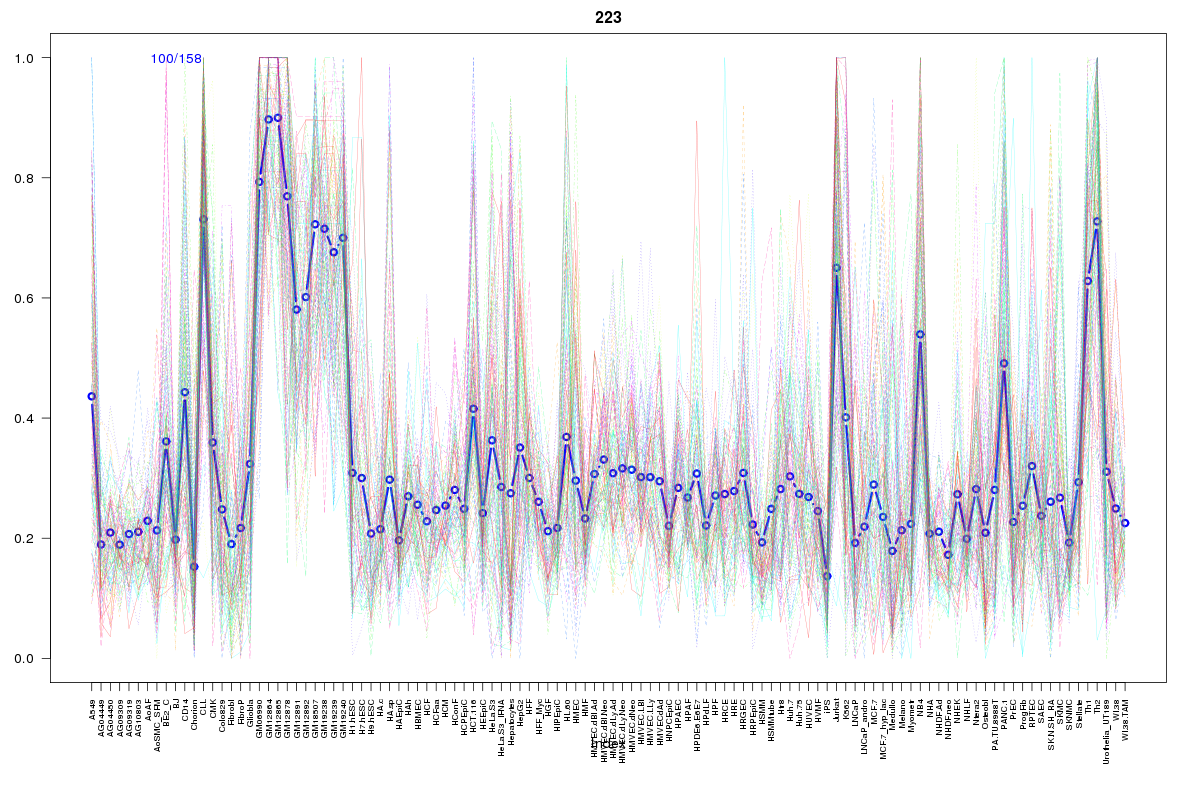 | 223 | 1 |
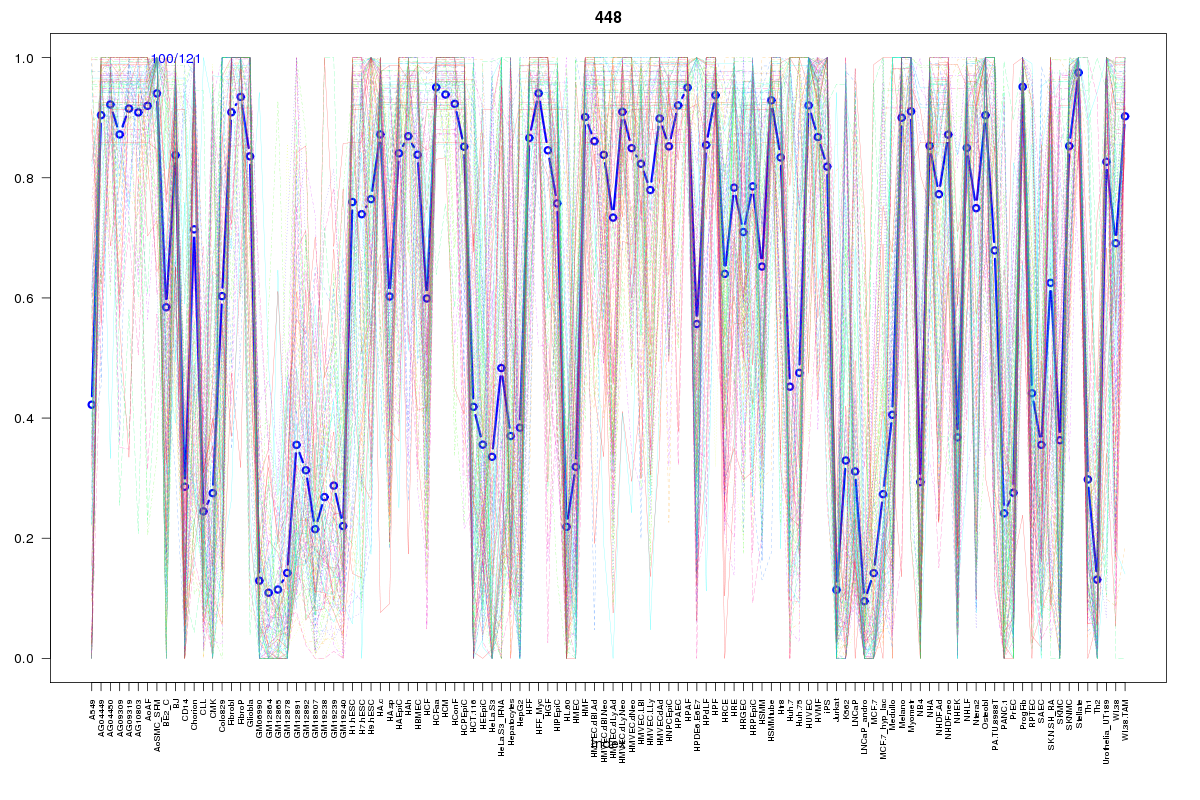 | 448 | 1 |
 | 192 | 1 |
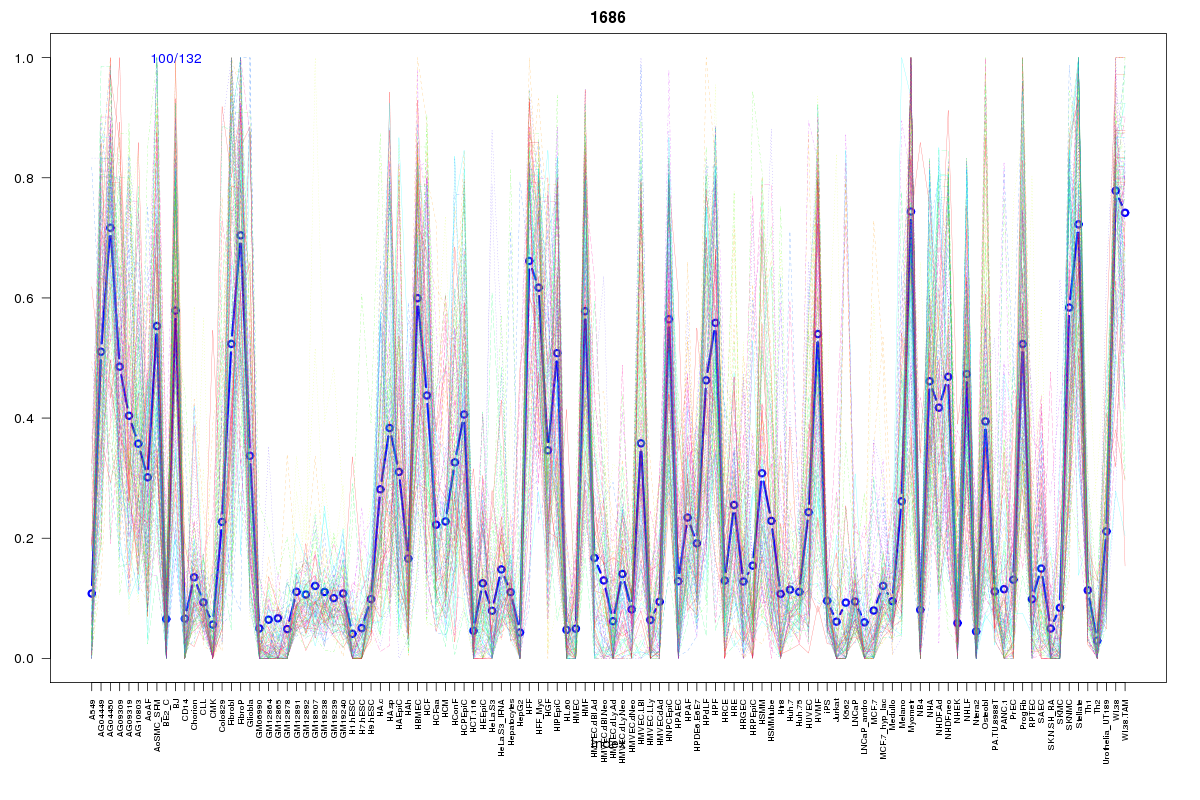 | 1686 | 1 |
 | 186 | 1 |
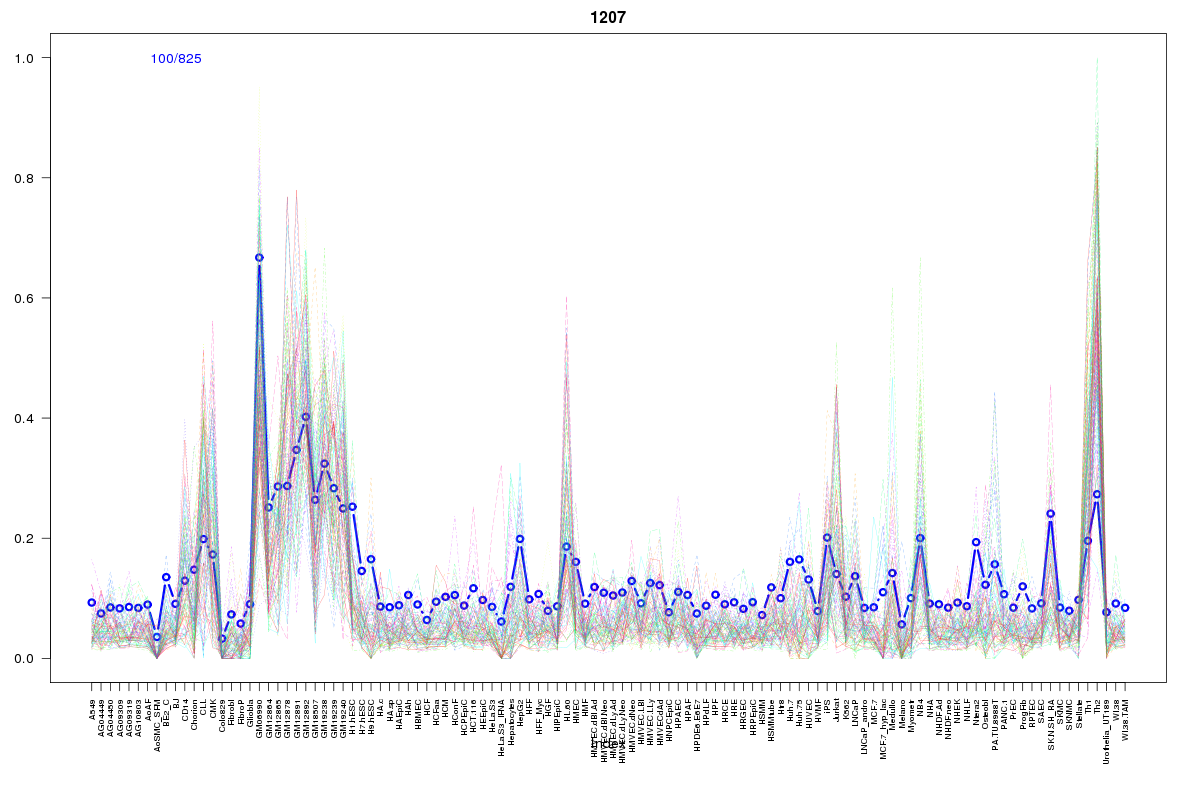 | 1207 | 1 |
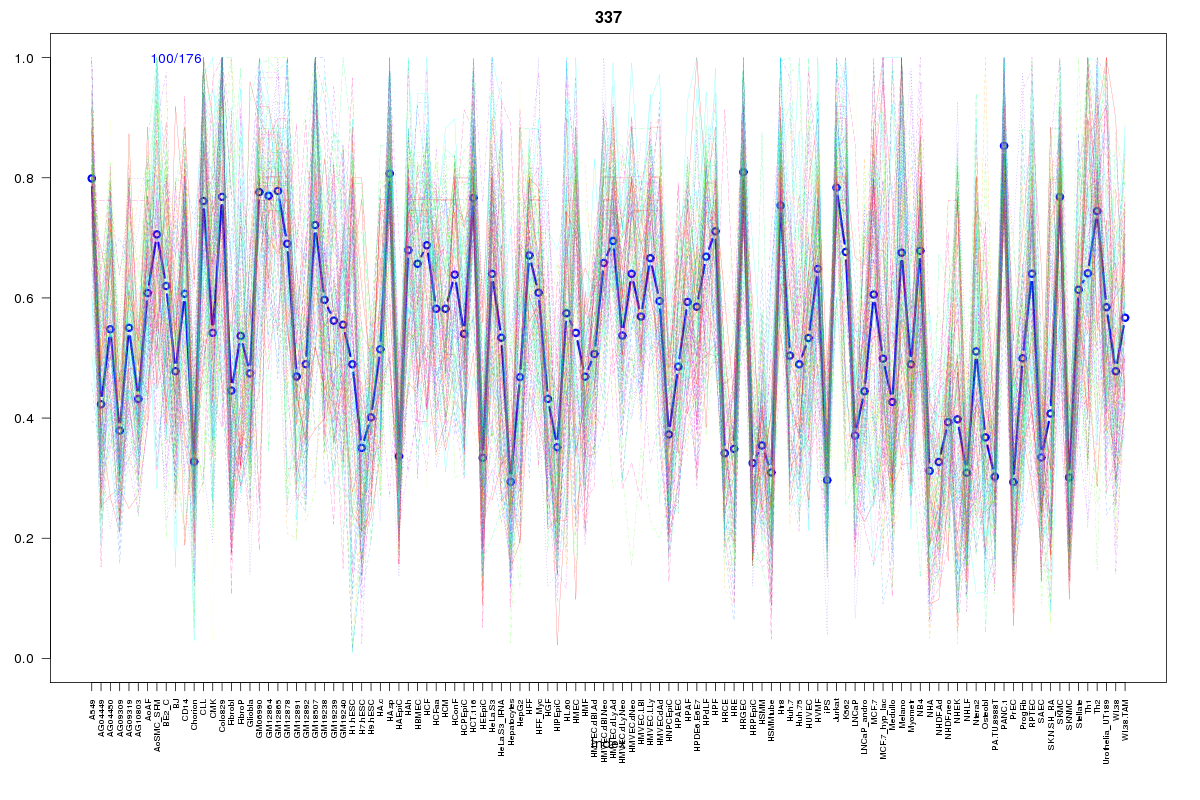 | 337 | 1 |
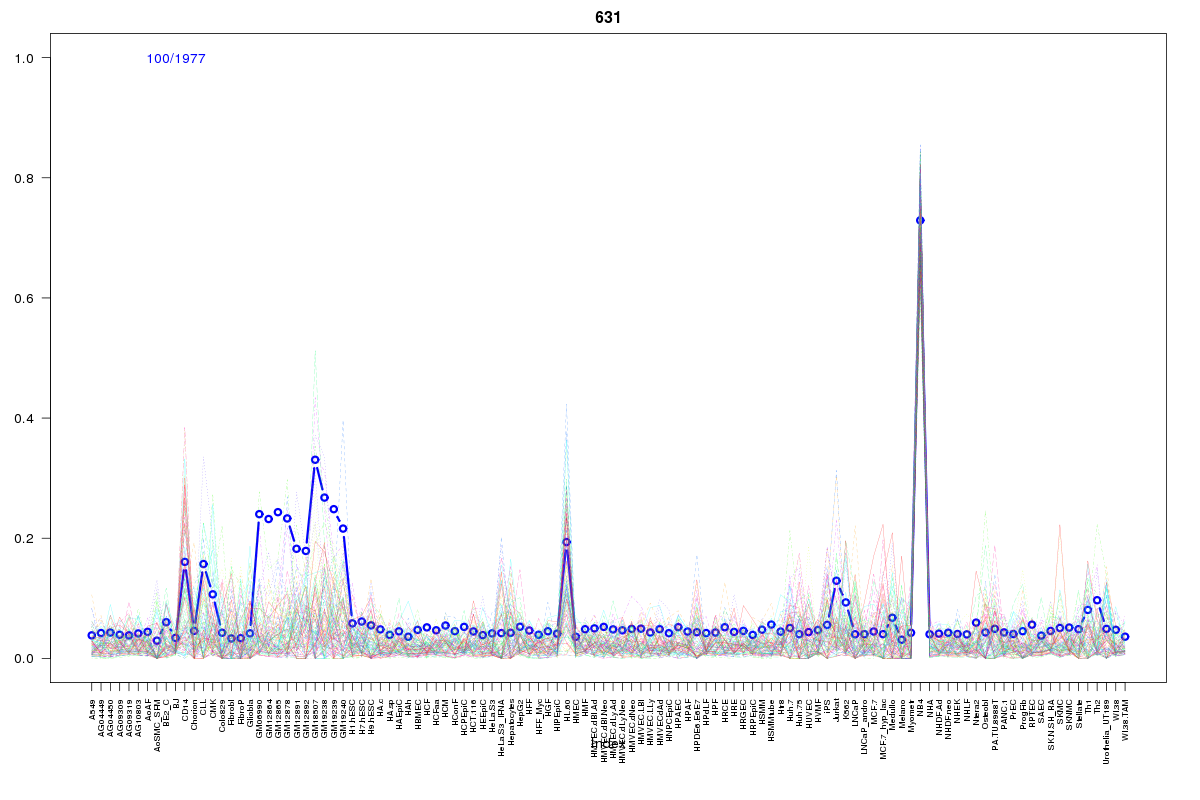 | 631 | 1 |
Resources
BED file downloads
Connects to 33 DHS sitesTop 10 Correlated DHS Sites
p-values indiciate significant higher or lower correlation| Location | Cluster | P-value |
|---|---|---|
| chr1:45181040-45181190 | 2170 | 0 |
| chr1:45188900-45189050 | 1207 | 0.001 |
| chr1:45187760-45187910 | 192 | 0.002 |
| chr1:45187545-45187695 | 223 | 0.002 |
| chr1:45188745-45188895 | 2062 | 0.003 |
| chr1:45162540-45162690 | 1457 | 0.003 |
| chr1:45197540-45197690 | 2072 | 0.003 |
| chr1:45285620-45285770 | 337 | 0.006 |
| chr1:45187020-45187170 | 632 | 0.006 |
| chr1:45269920-45270070 | 1605 | 0.009 |
| chr1:45150420-45150570 | 274 | 0.01 |
External Databases
UCSCEnsembl (ENSG00000225721)